
GPU SPECTRAL VIEWER
A Tool for an Enhanced Colorimetric Perspective of Cultural Heritage
Denis Pitzalis, Philippe Colantoni, Ruven Pillay and Genevieve Aitken
Centre de Recherche et de Restauration des Mus
´
ees de France, Palais du Louvre, Paris, France
Keywords:
Image processing software, GPU, Cultural Heritage.
Abstract:
During the EU IST project CRISATEL the consortium made around one hundred multispectral scans of paint-
ings conserved in several museums. The high resolution images obtained allow us to not only have an accurate
colour rendering but also to perform in depth quantitative scientific measurement on the colour structure of
these works of art.
One of these paintings in particular required special attention. It was Leonardo da Vinci’s “Mona Lisa”.
In order to study it special GPU-based software was developed. In this paper we will present how GPU
computation and computer vision can deliver the high performance and the analytic capability required to
study complex works of art in a different and subtle way.
1 INTRODUCTION
The CRISATEL EU Project (RSPL05) gave us the
possibility to design and construct an innovative cam-
era. This new camera is able to scan at ultra high res-
olution (12,000x20,000 pixels) at 13 different wave-
lengths of light from the ultraviolet to the near in-
frared covering the whole of the visible spectrum.
Multispectral analysis of paintings, available via a
complex image processing pipeline, allows us to in-
vestigate and navigate within the details of a painting
in ways that were unavailable until now.
To perform the analysis of the Mona Lisa in the
limited time we had, it was necessary to develop a
special processing tool to better perform our com-
plex image analysis in a way suited to art preserva-
tion. GPU based software is better than common CPU
driven computer visualization software because we
offload the algebraic processing to dedicated process-
ing units with the GPU, which are designed to handle
these kinds of calculations. This allows us to provide
the user with a custom image processing tool with the
necessary precision and responsive high performance
in order to analyze and simulate new case studies.
In order to better understand the functions of the
different software modules built for this application
we introduce the colour computations used to handle
the multispectral images. The GPU core algorithm
has been described in a previous, related, publication
(CPP
∗
06).
2 COLOUR COMPUTATION
The CI EXYZ system is based on the response curves
of the eye’s three colour receptors. Since these differ
slightly from one person to another, CIE has defined
a “standard observer” whose spectral response corre-
sponds more or less to the average response of the
population. This objectifies the colorimetric determi-
nation of colours.
The CRISATEL project produces 13 images
which correspond to the following 40nm bandwidth
filters: 400, 440, 480, 520, 560, 600, 640, 680, 720,
760, 800, 900 and 1000nm. Only the first 10 filters
interact with the visible part of the spectrum. Consid-
ering this, the XYZ tri-stimulus formulae are:
⎧
⎨
⎩
X =
∑
λ=760
λ=400
x(λ).R(λ).V (λ).L(λ)
Y =
∑
λ=760
λ=400
y(λ).R(λ).V (λ).L(λ)
Z =
∑
λ=760
λ=400
z(λ).R(λ).V (λ).L(λ)
(1)
where R(λ) is the reflectance spectrum, V (λ) is
the varnish transmittance and L(λ) is the light spec-
trum (used as illuminant). Using these formulae we
can compute the resulting XYZ values for each pixel
of the source image. One of the modules of our appli-
cation can simulate varnish removal using the known
transmittance properties of the varnish based on this
formulae. Of course, the obtained values are only an
approximation of the values that would be measured
in front of the original painting.
492
Pitzalis D., Colantoni P., Pillay R. and Aitken G. (2008).
GPU SPECTRAL VIEWER - A Tool for an Enhanced Colorimetric Perspective of Cultural Heritage.
In Proceedings of the Third International Conference on Computer Graphics Theory and Applications, pages 492-496
DOI: 10.5220/0001100304920496
Copyright
c
SciTePress
CI EL
∗
a
∗
b
∗
colour space is derived from CI E X YZ
(1931) and is an attempt to linearize the perceptibility
of unit vector colour differences and provide a scien-
tific basis for the measurement of colour. The colori-
metric difference measure is called ΔE and exists in
different forms. In our software we use three of them:
• ΔE
76
the Euclidean distance (CIE95);
• ΔE
94
distance based on psycho-visual experi-
ments (CIE95; LCR01);
• ΔE
2000
complex distance also based on psycho-
visual experiment (LCR01). This distance com-
putation requires the use of some CPU consum-
ing mathematical functions, which are more effi-
ciently handled in the GPU.
In order to provide calibrated colour (similar to the
effective colour stimuli) on a specific display device
we must also make sure we characterize it (VT99).
Visualization device calibration is based on the input
(e.g. RGB input values of the display device) and the
output (e.g. XYZ values measured on the display de-
vice by a spectrometer) values. This characterization
process is used to calibrate the visual quality of the
colour generated by our software using a custom vir-
tual illuminant (fig. 3). A specially designed module
in our software is in charge of the calibration process.
It allows us to generate a 3D Look Up Table (LUT)
that will be used to compute the RGB values needed
to display, or to print, the closest colour stimuli corre-
sponding to the mathematical L
∗
a
∗
b
∗
model.
All these computations are done in the GPU pro-
viding a real-time interaction environment where the
user can manipulate different parameters.
3 SOFTWARE MODULES
This section will present all the colorimetric measures
and visualization modules that will be used in our ap-
plication. This software is based on a 2D rendering
engine developed in-house which uses OpenGL. This
engine was designed to be platform independent and
run on Linux, Unix, MacOSX and various versions
of Windows. It requires, however a Shader Mod-
els 3.0 compatible graphics card (such as the latest
n
VIDIA
TM
graphics cards) in order to work fully. A
custom C++ library based on a composition engine
has been designed for this purpose. This library al-
lows us to build applications from a new set of wid-
gets rendered using textures and frame buffer objects.
The result is a fast and portable GUI with additional
eye candy such as transparency and 3D effects that
make the user interaction more friendly.
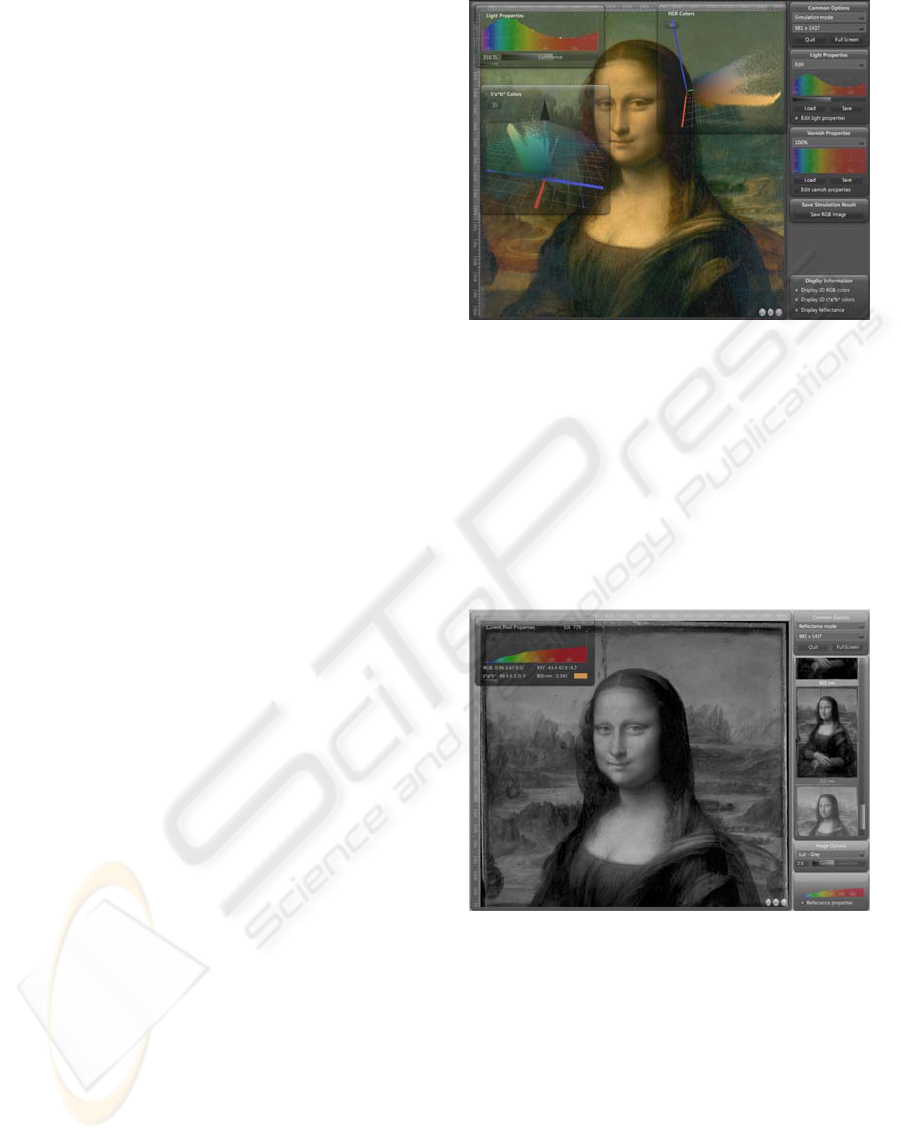
Figure 1: Simulation of a custom illuminant.
3.1 Multispectral Information
Visualization
The multispectral information visualization module is
used to display the reflectance image as a set of 16bit
grey level images. Different LUTs and a gamma cor-
rection factor can be modified during the visualization
process (fig. 2).
Figure 2: Reflectance image visualization.
From the perspective of the expert user, the ability
to superimpose and compare different wavelengths or
perform other mathematical operations, such as sub-
tracting views etc, on the multispectral images at high
resolution is a huge improvement on traditional anal-
ysis using low definition, separate and monospectral
infra-red, colour and ultraviolet images. To search,
for example, a drawing under the paint layer done us-
ing graphite we simply have to search in the infra-red
(NIR, between 850 and 1050m) images.
GPU SPECTRAL VIEWER - A Tool for an Enhanced Colorimetric Perspective of Cultural Heritage
493
3.2 Colour Reconstruction
Based on XYZ and L
∗
a
∗
b
∗
colour spaces and on a our
colour management process, this module allows the
user to interact in real-time with a virtual environ-
ment light source (CBR03). All the generated and
displayed images are High Dynamic Range images
(HDR).
The graphic interface associated with this module
includes:
• an RGB image viewer;
• a virtual light selector (based on standard illumi-
nants or on customized spectra);
• a virtual varnish simulator;
• a L
∗
a
∗
b
∗
colour cloud viewer, including the gamut
of the current display (we use it in order to see if
all the colours are visible on the current display
device);
• an RGB colour cloud viewer (fig. 3).
Figure 3: Colour reconstruction.
This module is intended to help the simulation of
different environments. For example to simulate the
light used in an exibition, or to allow CMYK calibra-
tion for reproductions.
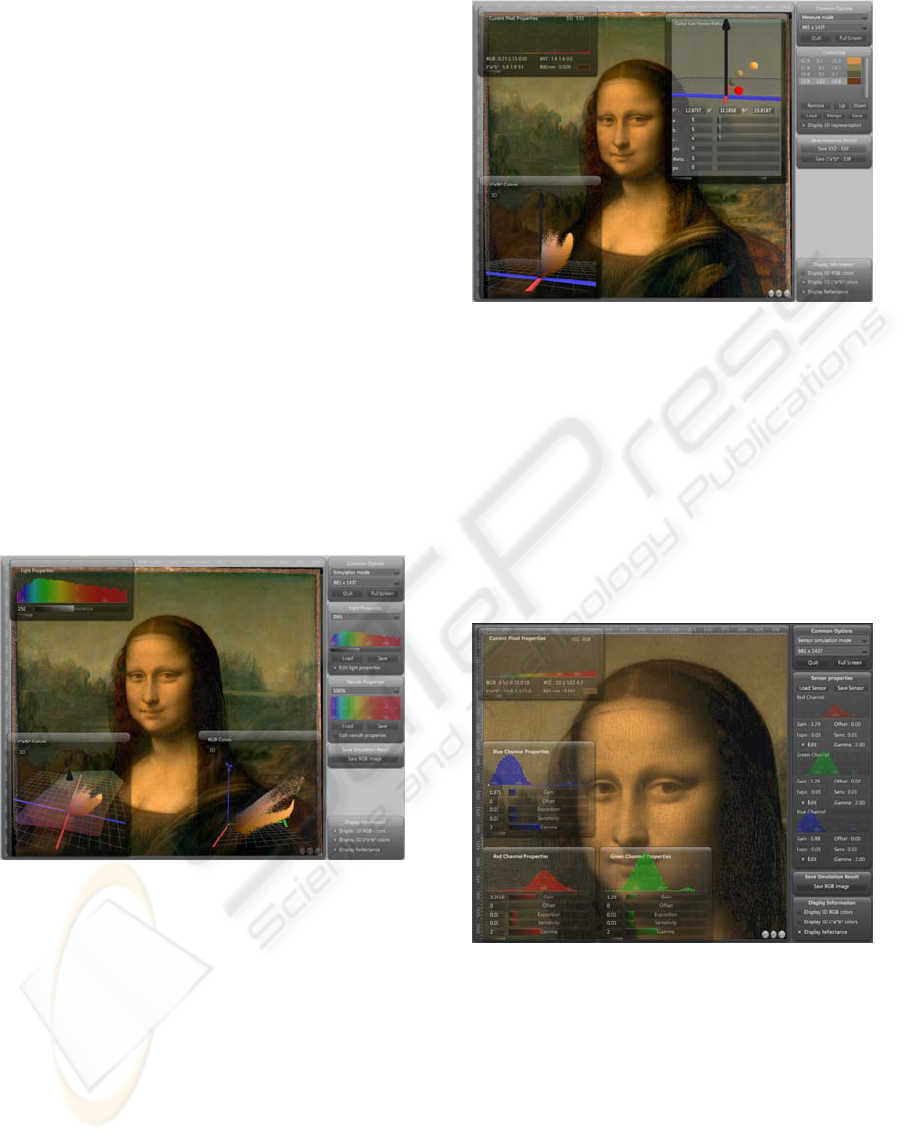
3.3 Colour Measurement
We use the same GPU processing graph for this mod-
ule as that presented in (CPP
∗
06) but the resulting
L
∗
a
∗
b
∗
colour image is different because we use the
white reference as a virtual illuminant to do the com-
putation. Using this new L
∗
a
∗
b
∗
image we can pro-
vide a more usable and precise interface for colour
selection (fig. 4).
Figure 4: Colour measure.
3.4 Sensor Simulation
The analysis of a painting using colour can not be
precise using a simple colour reconstruction based on
different virtual lights (metameric analysis for exam-
ple (S05; B01)). For this reason we have created an-
other module which allows the user to choose inter-
actively the sensitivity curves of a virtual RGB sensor.
These sensitivities can be based on existing sensors
(like in fig. 5) or interactively drawn by the user.
Figure 5: Simulated sensitivity of a Canon 20D.
3.5 Colour Segmentation
The segmentation process investigated for this appli-
cation is based on colour clustering and threshold ap-
proaches. It can be time consuming, especially if we
use a complex colour distance (e.g. measured with
ΔE
2000
) and a large set of reference colours. The two
methods are described here:
• threshold: associate a ΔE threshold (ΔE
76
,ΔE
94
or
ΔE
2000
) to a reference colour. This generates a 3D
GRAPP 2008 - International Conference on Computer Graphics Theory and Applications
494
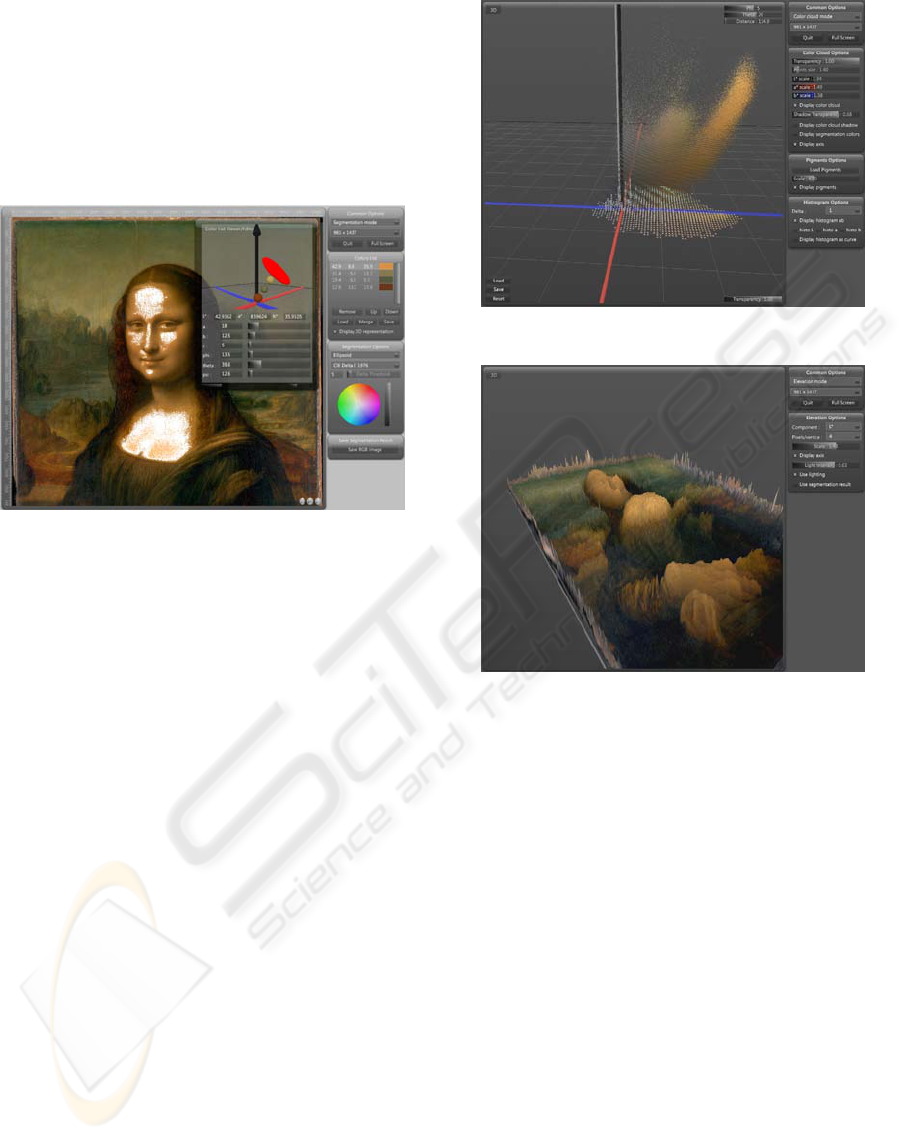
primitive (sphere, ellipsoid or cylinder) in L
∗
a
∗
b
∗
colour space. The colours appearing in this 3D
volume are associated to the same label (fig. 6);
• clustering: uses an algorithm which isolates and
labels individual colours by finding in a colour
reference set the closest match. With this step we
provide a full segmentation of the image.
Figure 6: Segmentation.
3.6 Colour Cloud Analysis
The colour cloud analysis can be done using a 3D rep-
resentation of the colours in the L
∗
a
∗
b
∗
space (fig. 7).
This module is useful in order to apply a statistical
view of the colour distribution of the painting and it
includes:
• the colour cloud
• the selected colour (associated to the correspond-
ing 3D primitives)
• the 2D and 1D histogram (showing the colour
density)
• a pigment injection utility (with the 3D represen-
tation of pigments identified by their reflectance)
Once we have obtained the colour map we can
start investigating the relationships between the dif-
ferent colour groups looking at their position in
L
∗
a
∗
b
∗
space. For example, whether the pigment is
pure or mixed, whether areas are composed of the
same pigment, etc.
3.7 Luminance Elevation Map
This module is a useful tool for colour experts who
wish to analyse separately each colour component (lu-
minance for example). A colour component (L*, a*,
b*, X, Y, Z , R, G, B) is represented as the Z value
Figure 7: Colour cloud analysis.
Figure 8: Elevation map. We can easily identify areas of
higher luminance.
in an elevation map where the reconstructed image is
mapped.
In figure 8 we can see that the highest luminance
values are around the chest of the “Mona Lisa”. The
high peaks that we can see around the border repre-
sent areas of pigment without (luminance reducing)
varnish.
4 RESULTS
In this section we provide some benchmarks, such
as the computational time of different processes for
a 1963 × 2874 pixel ×13 planes (using half float in-
ternal representation - 16bit per channel) reflectance
image. We used a 3D graphics card based on an
n
VIDIA
TM
G80 graphics processor (GeForce 8800
GTX) with the following specifications: 575MHz
GPU core, 1350MHz stream processors and 768Mb
of 1800MHz RAM (SDRAM DDR3).
All these operations (table 1) correspond to a
GPU SPECTRAL VIEWER - A Tool for an Enhanced Colorimetric Perspective of Cultural Heritage
495
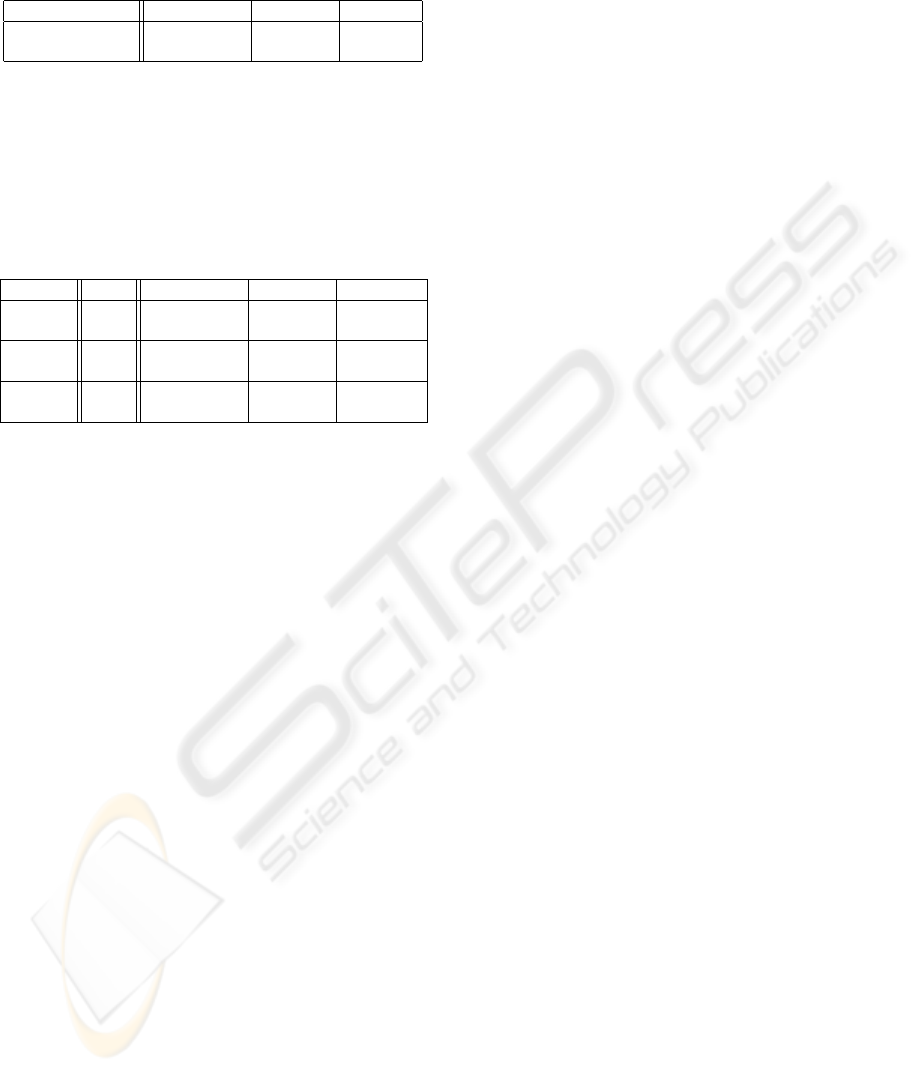
Table 1: Simulation Measure Process and Sensor Simula-
tion Process.
processing type Time Images/s Pixels/s
colour simulation 0.010311149 96.9824 547 ∗ 10
6
sensor simulation 0.00648231 154.266 870 ∗ 10
6
per-pixel process which requires the execution of a
pipeline of several complex mathematical and vector
calculations (FM04). As the GPU is more suited to
these kinds of operations, the results obtained are an
improvement in comparison to using only the CPU.
Table 2: Segmentation process.
colours ΔE Time Images/s Pixels/s
1 1976 0.000652175 1533.33 8650 ∗ 10
6
1 2000 0.003529765 283.305 1598 ∗ 10
6
5 1976 0.005996138 166.774 940 ∗ 10
6
5 2000 0.043635729 22.917 129 ∗ 10
6
10 1976 0.01042655 95.909 541 ∗ 10
6
10 2000 0.086909666 11.5062 65 ∗ 10
6
Table 2 indicates that the GPU performs very well
in this particular case study; especially if we only seg-
ment one colour. Nevertheless, it looks like this algo-
rithm grows linearly with the number of colour refer-
ences used.
5 CONCLUSIONS
The main aim of this work has been to investigate and
develop a new tool to help in the study and the anal-
ysis of multispectral images of paintings. The work
was focused on developing something innovative for
the Cultural Heritage domain using new technologies
such as GPU-based computation systems. The poten-
tial offered by colour spectrum decomposition tech-
niques opens up new ways to study works of art.
The Mona Lisa not only gave inspiration to
Leonardo, but also to our group to develop an applica-
tion capable of discovering details otherwise invisible
to the naked eye. This approach based on the fusion
between art, science and computer vision represents
a valuable aid in the field of art conservation, restora-
tion and art history and will require more in-depth in-
vestigation and a more multi-disciplinary community.
REFERENCES
Berns R. S.: The science of digitizing paintings for colour
accurate image archives: a review. In Journal of Imag-
ing Science and Technology 45 (2001), pp. 305–325.
Colantoni P., Boukala N., Rugna J. D.: Fast and accu-
rate colour image processing using 3d graphics cards.
In Vision Modeling anv Visualization, VMV (2003),
pp. 383–390.
CIE, Commission Internationale de l’Eclairage: Interna-
tional Congress on Illumination. Proceedings, In-
ternational Congress on Illumination (1931), Cam-
bridge.
CIE, Commission Internationale de l’Eclairage: Industrial
colour-difference evaluation. Proceedings, Interna-
tional Congress on Illumination (1995), Tech. Rep.
Colantoni P., Pillay R.,Lahanier C. and Pitzalis D.: Analy-
sis of multispectral images of paintings. In EUSIPCO
(2006), Florence, Italy.
Fung J., Mann S.: Computer Vision Signal Processing
on Graphics Processing Units. In Proceedings of the
IEEE International Conference on Acoustics, Speech,
and Signal Processing (2004), Montreal, Quebec,
Canada, May 17–21, 2004.
Luo M., Cui G., Rigg B.: The development of the CIE 2000
colour-difference formula: CIEDE2000. In Ph.D.
Thesis, University of Derby (1998), Derby.
Rib
´
es A., Schmitt F., Pillay R., Lahanier C.: Calibration
and spectral reconstruction for crisatel: an art painting
multispectral acquisition system. In Journal of Imag-
ing Science and Technology 49 (2005), 563–573.
Staniforth S.: Retouching and colour marching: the restorer
and metamerism. In Journal of Studies in Conserva-
tion 30 (1985), 101–111.
Vrhel M. J., Trussell H. J.: colour device calibration: a
mathematical formulation. In IEEE Transactions on
Image Processing 8, 12 (1999), 1796–1806.
GRAPP 2008 - International Conference on Computer Graphics Theory and Applications
496
