
MERGING OF ADVICES FROM MULTIPLE ADVISORY SYSTEMS
With Evaluation on Rolling Mill Data
Pavel Ettler
COMPUREG Plzeˇn, s.r.o., Plzeˇn, Czech Republic
Josef Andrýsek, Václav Šmídl, Miroslav Kárný
Department of Adaptive Systems, ÚTIA, AV
ˇ
CR, Praha, Czech Republic
Keywords:
Advisory system, Bayesian decision-making, Bayesian model averagin g, multiple-participant decision-
making.
Abstract:
The problem of evaluation of advisory system quality is studied. Specifically, 18 advisory strategies for op-
erators of a cold rolling mill were designed using different modelling assumptions. Since some assumptions
may be more appropriate in different working regimes, we also design a new advising strategy based on the
on-line merging of advices. In order to measure actual suitability of the advisory systems, we define two
measures: operator’s performance index and coincidence of the observed operator’s actions with the advices.
A time-variant model of advisory system suitability is proposed. Merging of the advices is achieved using
Bayesian theory of decision-making. Final assessment of the original advisory systems and the new system is
performed on data recorded during 6 months of operation of a real rolling mill. This task is complicated by
the fact that the operator did not follow any of the recommendations generated by the advisory systems. Val-
idation was thus performed with respect to the proposed measures. It was found that merging of the advising
strategies can significantly improve quality of advising. The approach is general enough to be used in many
similar problems.
1 INTRODUCTION
Theory and algorithms for design of advisory system
based Bayesian decision-making theory have been
consistently developed for years (Kárný et al., 2005).
The theory was applied primarily to the probabilis-
tic mixtures (Titterington et al., 1985) and the result-
ing algorithms were implemented in a Matlab toolbox
Mixtools (Nedoma et al., 2005) which is also avail-
able as a platform-independent library. The first in-
dustrial application of the algorithms was designed
for the twenty-high cold rolling mill in Kovohut
ˇ
e
Rokycany within the international project ProDaC-
Tool and was commissioned in autumn 2002 (Quinn
et al., 2003), (Ettler et al., 2005a).
Development of the library continued, and within
two years, its new version was ready for testing. The
new library extended the number of possible settings
of the advisory system. Great care was taken to elim-
inate the need for tuning knobs, and only discrete set
of choices (such as class of models describing sys-
tem behavior) was allowed. Thus, after three years
of operation, the use of the original advisory system
was suspended, it was replaced by a new experimen-
tal version and an experiment was undertaken to test
suitability of these choices. To minimize the impact
of the experiments on the production, mill operators
were not asked to follow recommendations made by
the system running in the experimental mode. Thus,
we can not evaluate quality of the new systems from
behavior of the closed loop, but we have to design
evaluation criteria using only the open loop data.
Since only a small number of discrete choices is
available, all possible combinations of these choices
yield 18 different advisory systems, advisers. Each
adviser is capable to generate recommendations for
operators, advices. Thus, rather then simply choos-
ing the best system, we also explore the possibility
of merging advices from all the advisers. The merg-
ing rule is designed via a proposed model of evolution
of advising quality. Relations of this approach to the
Bayesian model averaging (Raftery et al., 1997) and
66
Ettler P., Andrýsek J., Šmídl V. and Kárný M. (2008).
MERGING OF ADVICES FROM MULTIPLE ADVISORY SYSTEMS - With Evaluation on Rolling Mill Data.
In Proceedings of the Fifth International Conference on Informatics in Control, Automation and Robotics - ICSO, pages 66-71
DOI: 10.5220/0001500900660071
Copyright
c
SciTePress

multiple participant decision-making (Kárný et al.,
2007) is discussed.
2 COLD ROLLING MILL
A reversing cold rolling mill is essentially used to re-
duce the thickness of a strip of metal. This is done by
passing the strip between rolls in alternating direction
under high applied pressure and strip tensions. Sev-
eral basic types of cold rolling mills are distinguished
according to the arrangement of working and backup
rolls. Data for experiments came from the twenty-
high rolling mill mentioned in the Introduction. For
this machine the strip thickness is measured by con-
tact meters on both sides of the rolling mill, providing
measurements of the input and output thickness and
its deviation from the nominal value. A target thick-
ness is defined, and this needs to be achieved with
high accuracy depending on the actual nominal thick-
ness and on the type of material. A typical required
tolerance in the considered data set was ± 10µm (mi-
crons).
Strip thickness variation h
2
on the output side of
the rolling mill is considered as the main system out-
put and the only criterial variable for further con-
siderations. The output is, under normal conditions,
securely controlled by the AGC (Automatic Gauge
Control) (Ettler and Jirkovský, 1991). The term "nor-
mal conditions" is worth a discussion: perfectly work-
ing hydraulic roll-positioning system, operating strip
thickness measurement together with values of rolling
force, strip tensions and speeds and other adjustments
from the technologically correct ranges are prerequi-
sites. Nevertheless, performance of the system may
not be optimal in all regions within these ranges due to
e.g. some hardly observable vibrations, unequal cool-
ing and lubrication conditions, etc. Thus even if the
AGC keeps the thickness deviation well in tolerance,
its performance can be further improved by tuning of
its working conditions. This is a task for an expe-
rienced operator. An advisory system was designed
to support potentially inexperienced operators (Quinn
et al., 2003; Ettler et al., 2005b). Evaluation of quality
of advices and their potential improvement is consid-
ered next.
The operator directly adjusts variety of variables
(actions), we consider just three of them: input and
output strip tensions and output strip speed. Actual
values of these actions form three-dimensional vector,
u
t
. The operator makes his decision according to his
experience, using the provided digital measurements
of key internal variables but also his senses (e.g. hear-
ing an unusual noise). On the other hand, the advisory
system must depend only on the measured quantities.
In the considered experiment, the advisory system op-
erated on ten variables including the three operators
actions listed above. The full vector of observed data
will be denoted by d
t
= [y
0
t
, u
0
t
].
Behavior of the operator and its improvement is
difficult to quantify. We define a quantitative cri-
terion, operator’s performance index, on a batch of
1000 subsequent data records:
P =
E(h
2
2
)
E((h
1
− h
1
)
2
)
, (1)
Here, E(h
2
2
) is the expected value of square devia-
tions of output thickness from the desired value, and
E((h
1
− h
1
)
2
) is the expected value of square devia-
tions of input thickness from the mean value of the
batch. The expected values are evaluated empirically
with respect to all data in the batch. In effect, (1)
measures the ratio of output quality to input quality.
An experienced operator is able to adjust conditions
for the AGC so that good output quality is achieved
even if the input quality is low, yielding small values
of P. On the other hand, high values of P indicate
worse output quality than optimum when input qual-
ity was relatively good, which is a sign of suboptimal
settings.
3 ADVISORY SYSTEM DESIGN
An advisory system is a special case of a control sys-
tem, control actions of which are not implemented
automatically, but only displayed to an operator who
has the freedom to follow or ignore the advice. How-
ever, the advices should be designed in such a way
that if followed, the system achieves the optimal per-
formance. Thus, an advisory system can be designed
using methodology developed for design of adaptive
controllers (Kárný et al., 2005). This methodology is
divided in two phases:
Off-line Phase: a family of parametric models of the
system is chosen, and the best model within this
family is identified using historical data. Bayesian
approach to this step involves the tasks of prior
elicitation, parameter estimation, model selection,
and model validation. Then, desired behavior of
the closed-loop system (i.e. the original system
controlled by an ideal controller) is formalized in
the form of a target model.
On-line Phase: the optimal advising strategies are
designed such that the closed loop of the con-
trolled system complemented by the advising
strategy is the closest to the target behavior. The
MERGING OF ADVICES FROM MULTIPLE ADVISORY SYSTEMS - With Evaluation on Rolling Mill Data
67
M
T
mov
M
T
max
M
T
est
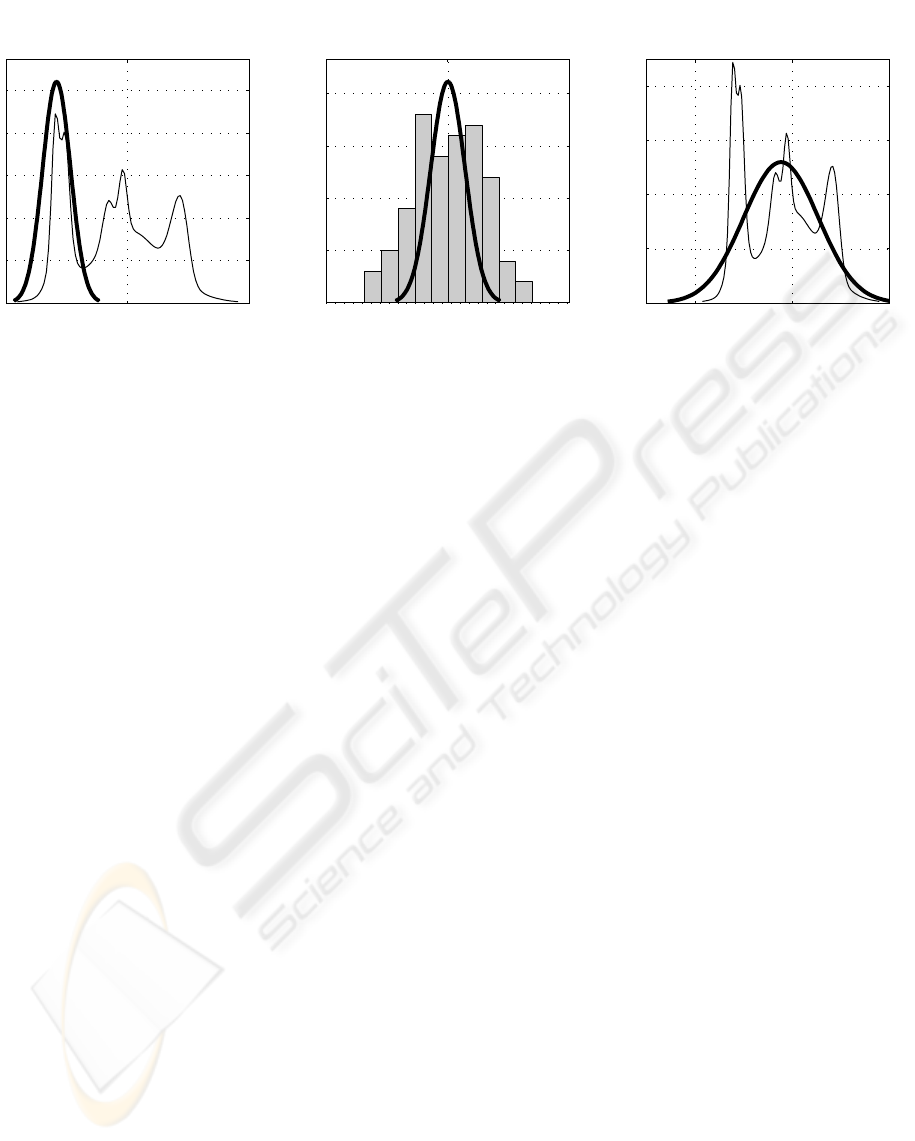
Figure 1: Graphic representation of construction of the target mixture M
T
. Shown for a single dimension for the sake of
clearness - M
T
is depicted by the thick line, M
I
or histogram by the thin line. Values of covariance for M
max
T
and M
mov
T
are
chosen by the user while covariance of M
est
T
is the result of estimation. Normalization is omitted here.
resulting optimized advising strategy is then pre-
sented to the operator in a simplified form. Typi-
cally, a small number of low dimensional projec-
tions of the probability distribution describing the
advising strategy is automatically selected. Spe-
cific recommendations such as “Increase the out-
put strip tension to 25 kN” are also provided.
The advising system implemented in Mixtools uses
Gaussian mixtures as the main modeling family.
Probabilistic mixture is a convex combination of
probability densities on the same variables, which are
called components. Gaussian mixture is a probabilis-
tic mixture with Gaussian components, i.e.
M : f (d
t
) =
c
∑
i=1
w
i
f (d
t
|µ
i
, Σ
i
). (2)
Here, d denotes the modeled data, f (d|µ
i
, Σ
i
) is the
ith Gaussian component with mean value µ
i
and vari-
ance Σ
i
, w
i
is the weight of ith component, c denotes
number of components. This choice of the model of
the system is motivated by universal approximating
properties of mixture models (Maz’ya and Schmidt,
2001). All introduced parameters, i.e. w
i
, µ
i
, Σ
i
and c
are considered to be unknown for all i.
Under this choice, an advisory system is designed
as follows: (i) the unknown parameters are estimated
in the off-line phase, yielding a mixture with esti-
mated parameters, M
I
, (ii) the target behavior of the
closed loop is defined as M
T
with specific choice of
parameters in (2), and (iii) the part of M
I
representing
control strategy, is replaced by a parametric model,
parameters of which are then optimized to minimize
a statistical divergence to the target M
T
; the result of
this optimization is a new mixture M
A
, for details see
(Kárný et al., 2005). In each of these steps, it is pos-
sible to make several modeling choices, as described
now in detail.
3.1 Variants of the System Model
A principal distinction in modeling of the system is
the choice of static or dynamic model. The static ap-
proach models all observed data as independent re-
alizations from the same density. The dynamic ap-
proach models also temporal dependence between
subsequent data. This distinction is demonstrated in
mixture models as follows:
M
stat
I
: all observed data, d
t
, t = 1, . . . , T , are as-
sumed to be generated from model (2) with time-
invariant parameters µ
i
, Σ
i
, w
i
.
M
dyn
I
: observed data at time t, d
t
, are assumed to be
generated from model (2) with time-variant mean
value, µ
i
= θ
i
d
t−1
, and time-invariant parameters
Σ
i
, w
i
.
3.2 Variants of the Target Mixture
Theoretically, the user can specify an arbitrary mix-
ture model as his desired behavior. In practice how-
ever, he is concerned mostly with variables that are
critical for the overall performance. If no suitable
expert knowledge is available for the remaining non-
critical variables, the target model on these must be
chosen. Three variants of this choice of M
T
were con-
sidered for experiments:
M
max
T
: Means of the non-critical variables in a
single-component M
T
are given by the maximum
marginal probability of M
I
in particular axes as
depicted in Fig. 1, left. Thus, M
T
remains un-
changed during on-line operation of the system.
ICINCO 2008 - International Conference on Informatics in Control, Automation and Robotics
68

M
mov
T
: Means of the non-critical variables vary in
time according to the outputs of the moving-
average filter processing actual data. Therefore
M
T
slightly differs for every step of the on-line
operation as indicated in Fig. 1, middle.
M
est
T
: A set of historical data from high-quality op-
erating regimes were used to estimate parameters
of a single-component mixture. This mixture was
used as M
T
afterward. During on-line computa-
tion M
T
is not changed. An example of M
est
T
is
displayed in Fig. 1, right.
3.3 Variants of the Advising Strategy
Since the advising system is not hard-linked with the
controlled system, its advices does not have to con-
sider only the directly adjustable parameters. An ad-
vice does not have to be a numeric value, but it can
suggest the operator to move into another operating
mode of the machine, without being explicit about
numerical values of adjustable parameters. Thus the
freedom in design of an advisory system is with which
parameters of the advising strategy are to be opti-
mized. This decision influences the resulting advis-
ing strategy and thus the advisory mixture, M
A
. Three
variants of M
A
were considered for experiments:
M
acad
A
: optimization is done only with respect to
weights w
i
of the advising strategy. In effect,
M
acad
A
is composed of the same components as M
I
(i.e all µ
i
and Σ
i
are the same), however, the com-
ponent are weighted by different weights w
i
.
M
ind
A
: optimization is done with respect to the means
µ
i
. Weights w
i
are assumed to be given by the
process. Thus M
ind
A
differs from M
I
in component
means and variances but not in their weights.
M
simult
A
: is a combination of both previous ap-
proaches, i.e. both the weights and the component
parameters are being optimized.
4 MERGING OF ADVICES
The Bayesian theory that was used for design of the
advisory system ensures that all nuisance parameters
were set (or integrated out). The discrete choices
mentioned above are the only degrees of freedom con-
sidered in this experiment. All possible combinations
of these yield 2 × 3 × 3 = 18 different complete advi-
sory systems, advisers. The task is to assess suitabil-
ity of these advisers for the production of a real rolling
mill. An ideal experiment would be to run a selected
task 18 times under the same conditions, each time
following different adviser. Since this is practically
not feasible, we need to find an alternative evaluation
method.
Moreover, each adviser may be more suitable for
different operating conditions, and the best advising
strategy is then to merge advices of all advisers to-
gether. In order to do that, we need to estimate the re-
lation between advices of each adviser and operator’s
performance index, P
t
. Let us consider a measure of
coincidence of the current operator’s actions with the
recommendations of the ith adviser at time t:
C
i,t
= E
1 −
max
|u
t
− u
?
i,t
|, u
t
u
t
. (3)
Here, u
t
denotes the observed actions, u
?
i,t
recom-
mended actions by the ith adviser, and | · | denotes ab-
solute value. Thus, C
i,t
= 1 when the operator follows
recommendation the ith adviser exactly. Furthermore,
lets assume that P
t
is related to C
i
via an unknown
function, P
t
= g
i
(C
i
). In order to estimate local ap-
proximation of this function, we seek a parametric
model of this relation. Since the advisers were de-
signed to improve quality of control, we assume that
g
i
() is a monotonic function. Application of the Tay-
lor expansion at operating point C
i,t
at time t yields
P
t
= g
i
(C
i,t
) + g
0
i
(C
i,t
)(C
i,t
−C
i,t
) + e
t
, (4)
where g
0
i
() denotes the first derivative of g
i
(), C
i,t
is the fixed point of expansion, and e
t
is an aggrega-
tion of higher order term in the expansion. (4) moti-
vates the following parametric model
P
t
= b
i,t
+ a
i,t
C
i,t
+ σ
i,t
v
t
, (5)
where a
i,t
, b
i,t
, and σ
i,t
are unknown time-variant
parameters and v
t
is a Gaussian distributed distur-
bance, v
t
∼ N (0, 1). (5) constitutes a linear regres-
sion, parameters of which can be estimated using re-
cursive least squares. The lack of knowledge about
evolution of parameters a
i,t
, b
i,t
, σ
i,t
in time motivates
the use least squares with forgetting (Kulhavý and
Zarrop, 1993), which is appropriate for slowly vary-
ing parameters.
We consider an advice to be optimal if it mini-
mizes the operator’s performance index in the next
step:
u
mer
t+1
= argmin
u
t
E(P
t+1
|u
t+1
). (6)
The expected value is with respect to all unknown
parameters
E(P
t+1
|u
t+1
) =
18
∑
i=1
α
i,t
f (P
t+1
|C
i,t+1
(u
t+1
)), (7)
MERGING OF ADVICES FROM MULTIPLE ADVISORY SYSTEMS - With Evaluation on Rolling Mill Data
69

where f (P
t+1
|C
i,t+1
(u
t+1
)) is obtained by inte-
grating (5) over b
i,t
, a
i,t
, σ
i,t
, and α
i
denotes probabil-
ity that the ith adviser is reliable,
α
i,t
= f (i
t
= i|P
t
,C
t
) ∝ f (P
t
|C
i,t
, i). (8)
Here, ∝ denotes equality up to a normalizing con-
stant, and f (P
t
|C
i,t
, i) is obtained by integrating (5)
over b
i,t
, a
i,t
, σ
i,t
.
We note the following:
• Evaluation of expectation (7) and its weights (8)
is closely related to Bayesian model averaging
(Raftery et al., 1997). The only difference of
our approach is the recursive evaluation of time-
variant weights α
i,t
.
• One possible interpretation of this approach is to
consider each adviser as a decision-making unit
(DMU) in multiple participant decision-making
(Kárný et al., 2007). If the units are not aware
of each other presence, they generate individual
advices. If they are forced to cooperate in order to
maximize common aim—i.e. maximum expected
increase in performance (6)—the final advice is a
result of negotiation defined via (7)–(8).
5 EXPERIMENTS
The approach was tested on a data set collected during
6 month of production of a cold rolling mill consist-
ing of more than 4,2 million of 10 dimensional data
records. The set contains data from a wide range of
operating conditions such as different materials or dif-
ferent passes through the mill. The quality of final
product was within the required range for great major-
ity of the data, and so was the operator’s performance
index, see Fig 2. This implies that the AGC low-level
controller worked very well, and thus the space for
improvement that can be achieved via the use of an
advisory system is rather small. Hence, evaluation of
the designed advisers is challenging.
Both operator’s performance index and coinci-
dence was computed for each model for each of the
4227 data batches. These numbers form irregular
clusters, discouraging parametric modeling of the re-
lation. Hence, we propose to split all data records in
two sets: (i) high-quality data, P <
ˆ
P, and (ii) low-
quality data, P ≥
ˆ
P. Here,
ˆ
P denotes a chosen thresh-
old of quality which can be chosen e.g. from his-
togram on Fig 2. For each of the data set, we eval-
uate median value of coincidence C
i,t
for all advisers
as their representative statistics. These values are dis-
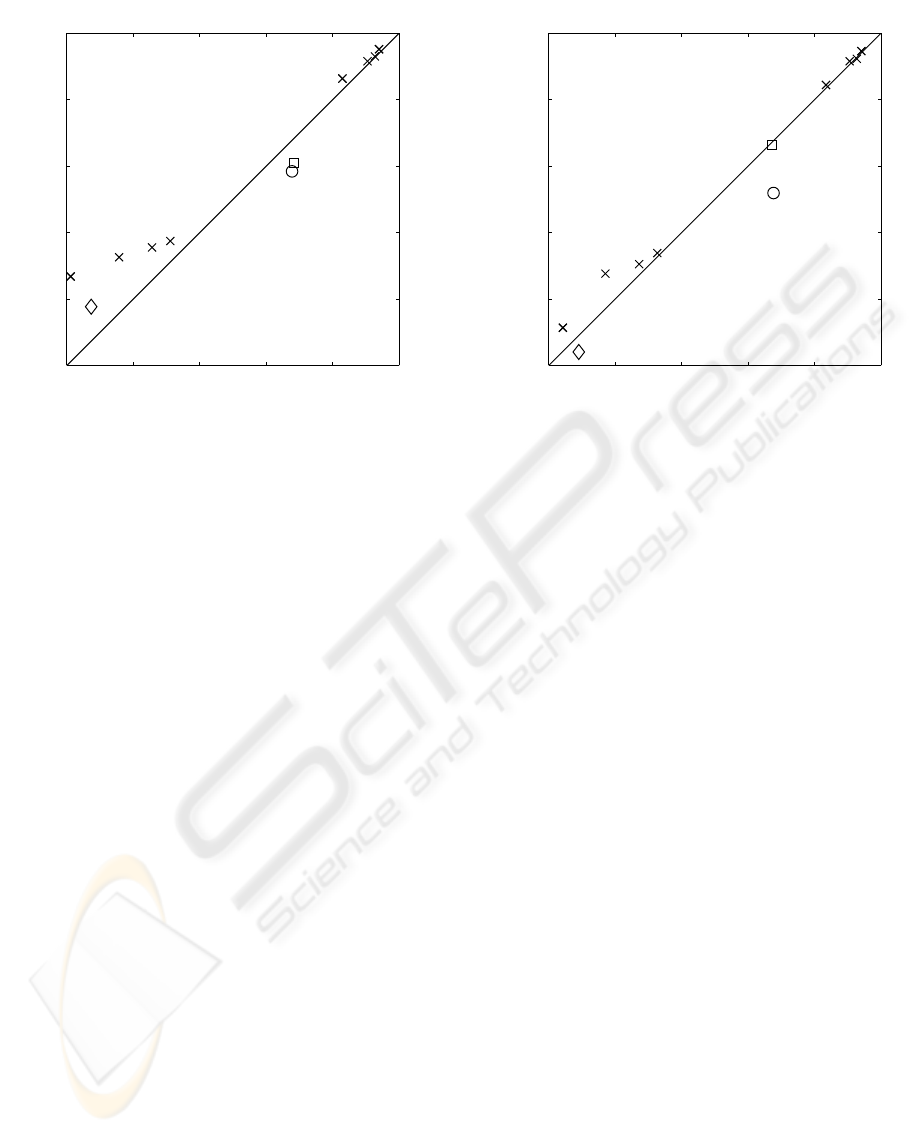
played for selected advisers in Fig. 3. Interpretation
of these results is as follows: advices generated by a
0 0.5 1 1.5 2 2.5 3
0
50
100
150
200
250
300
350
400
450
Figure 2: Histogram of operator’s performance index for
the considered data set. Only the range between 0 to 3 is
displayed for clarity. Data records with P > 3 are infrequent
but considerable.
good advising system should coincide with the opera-
tors actions at high-quality data region, but should dif-
fer in low-quality data regions, pointing (hopefully) in
the direction of improvement. The line in the middle
indicates a region where an adviser’s coincidence is of
the same value for both high-quality and low-quality
data. An ideal adviser should be in the right-bottom
quadrant of the plot.
Due to the lack of data in low-quality data set,
the results are sensitive to the choice of the thresh-
old
ˆ
P, see results for
ˆ
P = 1.1 and
ˆ
P = 1.4 in Fig.
3. This sensitivity leads to a different choice of the
best adviser from the original 18, specifically ad-
viser M
stat
I
, M
mov
T
, M
ind
A
, denoted by , and adviser
M
dyn
I
, M
max
T
, M
simult
A
denoted by . Notably, however,
the merged adviser, denoted by ◦, is performing well
in both criteria.
This result should be taken only as qualitative for
two reasons: (i) sensitivity of the criteria as described
above, and (ii) for computational reasons, several ap-
proximations were used in evaluation of (6). Namely,
integration over all parameters was replaced by con-
ditioning on point estimates, and (7) was minimized
only in the direction of its gradient in u
t
. Neverthe-
less, the results indicate that merging of advices yields
more robust adviser that any of the original ones.
6 CONCLUSIONS
A set of advising systems (advisers) was designed
using different assumptions. A new adviser was
constructed via on-line prediction of suitability of
the original advisers for current working conditions
and merging their recommendations. Performance of
these advisers was assessed on real data. Evaluation
of results was complicated by lack of data generated
by an incorrectly set machine. Nevertheless, the re-
ICINCO 2008 - International Conference on Informatics in Control, Automation and Robotics
70
0.5 0.6 0.7 0.8 0.9 1
0.5
0.6
0.7
0.8
0.9
1
coincidence, C, on high−quality data
coincidence, C, on low−quality data
split at P=1.1
0.5 0.6 0.7 0.8 0.9 1
0.5
0.6
0.7
0.8
0.9
1
coincidence, C, on high−quality data
coincidence, C, on low−quality data
split at P=1.4
Figure 3: Comparison of coincidence C on high-quality and low-quality data for competing advisers. Two different thresholds
between high and low quality were considered:
ˆ
P = 1.1 (left) and
ˆ
P = 1.4 (right). Original advisers with C > 0.5 are
marked by ×, ◦ are denotes the merging adviser, and denote two remarkable original advisers, M
stat
I
, M
mov
T
, M
ind
A
and
M
dyn
I
, M
max
T
, M
simult
A
, respectively.
sults clearly show that merging of several advisers has
the potential to provide better advices and it is more
robust to the chosen evaluation metric.
ACKNOWLEDGEMENTS
Support of grants AV
ˇ
CR 1ET 100 750 401 and
MŠMT 1M0572 (DAR) is gratefully acknowledged.
REFERENCES
Ettler, P. and Jirkovský, F. (1991). Digital controllers for
škoda rolling mills. In Warwick, K., Kárný, M., and
Halousková, A., editors, Lecture Notes: Advanced
Methods in Adaptive Control for Industrial Applica-
tion (Joint UK-CS seminar), volume 158, pages 31–
35. Springer Verlag.
Ettler, P., Kárný, M., and Guy, T. V. (2005a). Bayes for
rolling mills: From parameter estimation to decision
support. In 16th IFAC World Congress, Praha, CZ.
Ettler, P., Kárný, M., and Guy, T. V. (2005b). Bayes
for rolling mills: From parameter estimation to de-
cision support. In Accepted for the 16th IFAC World
Congress, Praha, CZ.
Kárný, M., Böhm, J., Guy, T., Jirsa, L., Nagy, I., Nedoma,
P., and Tesa
ˇ
r, L. (2005). Optimized Bayesian Dynamic
Advising: Theory and Algorithms. Springer, London.
to appear.
Kárný, M., Kracík, J., and Guy, T. (2007). Cooperative de-
cision making without facilitator. In Andrievsky B.R.,
F. A., editor, IFAC Workshop "Adaptation and Learn-
ing in Control and Signal Processing" /9./. IFAC.
Kulhavý, R. and Zarrop, M. B. (1993). On a general con-
cept of forgetting. International Journal of Control,
58(4):905–924.
Maz’ya, V. and Schmidt, G. (2001). On approximate ap-
proximations using Gaussian kernels. IMA Journal of
Numerical Analysis, 16(1):13–29.
Quinn, A., Ettler, P., Jirsa, L., Nagy, I., and Nedoma,
P. (2003). Probabilistic advisory systems for data-
intensive applications. International Journal of Adap-
tive Control and Signal Processing, 17(2):133–148.
Raftery, A., Madigan, D., and J.A.Hoeting (1997).
Bayesian model averaging for linear regression mod-
els. Journal of Thhe American Statistical Association,
97(437):179–191.
Titterington, D., Smith, A., and Makov, U. (1985). Statis-
tical Analysis of Finite Mixtures. John Wiley, New
York.
Nedoma, P., Kárný, M., Bö hm, J., and Guy, T. V. (2005).
Mixtools Interactive User’s Guide. Technical Report
2143, ÚTIA AV
ˇ
CR, Praha.
MERGING OF ADVICES FROM MULTIPLE ADVISORY SYSTEMS - With Evaluation on Rolling Mill Data
71
