
Combining Selective-Presentation
and Selective-Learning-Rate Approaches for
Neural Network Forecasting of Stock Markets
Kazuhiro Kohara
1
1
Department of Electrical, Electronics and Computer Engineering
Chiba Institute of Technology, 2-17-1, Tsudanuma, Narashino, Chiba, 275-0016, Japan
Abstract. We have investigated selective learning techniques for improving the
ability of back-propagation neural networks to predict large changes. We previ-
ously proposed the selective-presentation approach, in which the training data
corresponding to large changes in the prediction-target time series are presented
more often, and selective-learning-rate approach, in which the learning rate for
training data corresponding to small changes is reduced. This paper proposes
combining these two approaches to achieve fine-tuned and step-by-step selec-
tive learning of neural networks according to the degree of change. Daily stock
prices are predicted as a noisy real-world problem. Combining these two ap-
proaches further improved the performance.
1 Introduction
Prediction using back-propagation neural networks has been extensively investigated
(e.g., [1-5]), and various attempts have been made to apply neural networks to finan-
cial market prediction (e.g., [6-16]), electricity load forecasting (e.g., [17]) and other
areas. In the usual approach, all training data are equally presented to a neural net-
work (i.e., presented in each cycle) and the learning rates are equal for all the training
data independently of the size of the changes in the prediction-target time series. Also,
network learning is usually stopped at the point of minimal mean squared error be-
tween the network’s outputs and the desired outputs.
Generally, the ability to predict large changes is more important than the ability to
predict small changes, as we mentioned in the previous paper [12]. When all training
data are presented equally with an equal learning rate, the BPNN will learn the small
and large changes equally well, so it cannot learn the large changes more effectively.
We have investigated selective learning techniques for improving the ability of neural
networks to predict large changes. We previously proposed the selective-presentation
and selective-learning-rate approaches and applied them into stock market prediction
[12-14]. In the selective-presentation approach, the training data corresponding to
large changes in the prediction-target time series are presented more often. In the
selective-learning-rate approach, the learning rate for training data corresponding to
small changes is reduced. The previous paper [12] also investigated another stopping
criterion for financial predictions. Network learning is stopped at the point having the
Kohara K. (2008).
Combining Selective-Presentation and Selective-Learning-Rate Approaches for Neural Network Forecasting of Stock Markets.
In Proceedings of the 4th International Workshop on Artificial Neural Networks and Intelligent Information Processing, pages 3-9
DOI: 10.5220/0001508200030009
Copyright
c
SciTePress

maximum profit through experimental stock-trading.
This paper proposes combining the selective-presentation and selective-learning-
rate approaches. By combining these two approaches, we can easily achieve fine-
tuned and step-by-step selective learning of neural networks according to the degree
of change. Daily stock prices are predicted as a noisy real-world problem.
2 Combining Selective-Presentation and Selective-Learning-Rate
Approaches
To allow neural networks to learn about large changes in prediction-target time series
more effectively, we separate the training data into large-change data (L-data) and
small-change data (S-data). L-data (S-data) have next-day changes that are larger
(smaller) than a preset value.
In the selective-presentation approach, the L-data are presented to neural networks
more often than S-data. For example, all training data are presented every fifth learn-
ing cycle, while the L-data are presented every cycle. In the selective-learning-rate
approach, all training data are presented in every cycle; however, the learning rate of
the back-propagation training algorithm for S-data is reduced compared with that for
L-data. These two approaches are outlined as follows.
Selective-Presentation Approach
1. Separate the training data into L-data and S-data.
2. Train back-propagation networks with more presentations of L-data than of S-data.
3. Stop network learning at the point satisfying a certain stopping criterion (e.g., stop
at the point having the maximum profit).
Selective-Learning-Rate Approach
1. Separate the training data into L-data and S-data.
2. Train back-propagation networks with a lower learning rate for the S-data than for
the L-data.
3. Stop network learning at the point satisfying a certain stopping criterion (e.g., stop
at the point having the maximum profit).
We combine these two approaches to achieve fine-tuned and step-by-step learning
of neural networks according to the degree of change. The outline is as follows.
Combining Selective-Presentation and Selective-Learning-Rate Approaches
1. Separate the training data into L-data and S-data.
2. Separate L-data into two subsets: L1-data and L2-data, where changes in L2- data
are larger than those in L1-data.
3. Separate S-data into two subsets: S1-data and S2-data, where changes in S2-data
are larger than those in S1-data.
4. Train back-propagation networks with more presentations of L1- and L2-data than
of S1- and S2-data, and with a lower learning rate for L1- and S1-data than for L2
and S2-data.
5. Stop network learning at the point satisfying a certain stopping criterion (e.g., stop
4

at the point having the maximum profit).
In general, we can separate the training data into N subsets (N ≥ 2): D
1
-, D
2
-, …,
and D
N
-data, where changes in D
i
-data are larger than those in D
i-1
-data, and give
“selective intensities” I (number of presentations times learning rate) to D
1
-, D
2
-, …,
and D
N
-data as I
1
< I
2
< I
3
< … < I
N
.
3 Evaluation through Experimental Stock-Price Prediction
We considered the following types of knowledge for predicting Tokyo stock prices.
These types of knowledge involve numerical economic indicators [12-14].
1. If interest rates decrease, stock prices tend to increase, and vice versa.
2. If the dollar-to-yen exchange rate decreases, stock prices tend to decrease, and
vice versa.
3. If the price of crude oil increases, stock prices tend to decrease, and vice versa.
We used the following five indicators as inputs to the neural network.
• TOPIX: the chief Tokyo stock exchange price index
• EXCHANGE: the dollar-to-yen exchange rate (yen/dollar)
• INTEREST: an interest rate (3-month CD, new issue, offered rates) (%)
• OIL: the price of crude oil (dollars/barrel)
• NY: New York Dow-Jones average of the closing prices of 30 industrial stocks
(dollars)
TOPIX was the prediction target. EXCHANGE, INTEREST and OIL were cho-
sen based on the knowledge of numerical economic indicators. The Dow-Jones aver-
age was used because Tokyo stock market prices are often influenced by New York
exchange prices. We assume that tomorrow’s change in TOPIX is determined by
today’s changes in the five indicators according to the knowledge. Therefore, the
daily changes in these five indicators (e.g.
Δ
TOPIX(t) = TOPIX(t) - TOPIX(t-1))
were input into neural networks, and the next-day’s change in TOPIX was presented
to the neural network as the desired output (Figure 1). The back-propagation algo-
rithm was used to train the network. All the data of the daily changes were scaled to
the interval [0.1, 0.9]. A 5-5-1 multi-layered neural network was used (five neurons in
the input layer, five in the hidden layer, and one in the output layer).
3.1 Experiments
We used data from a total of 409 days (from August 1, 1989 to March 31, 1991): 300
days for training, 30 days for validation (making decisions on stopping the network
learning), and 79 days for making predictions. In Experiment 1, all training data were
presented in each cycle with an equal learning rate (
ε
= 0.7). In Experiment 2, L-data
were presented five times as often as S-data. Here, the large-change threshold was
14.78 points (about US$ 1.40), which was the median of absolute value of TOPIX
5

daily changes in the training data. In Experiment 3, the learning rate for the S-data
was reduced up to 20% (i.e.,
ε
= 0.7 for the L-data and
ε
= 0.14 for the S-data).
Experimental conditions in Experiments 1, 2, and 3 are shown in Table 1, 2, and 3.
Fig. 1. Neural prediction model.
Table 1. Experimental conditions in Experiment 1: conventional technique.
S-data L-data
Range of absolute
value of
Δ TOPIX(t)
0 to 50% 50 to 100%
Number of data 150 150
Relative number of
presentations (P)
1 1
Learning rate (
ε
)
0.7 0.7
P times
ε
(relative value)
0.7
(1)
0.7
(1)
Table 2. Experimental conditions in Experiment 2: selective presentation.
S-data L-data
Range of absolute
value of
Δ TOPIX(t)
0 to 50% 50 to 100%
Number of data 150 150
Relative number of
presentations (P)
1 5
Learning rate (
ε
)
0.7 0.7
P times
ε
(relative value)
0.7
(1)
3.5
(5)
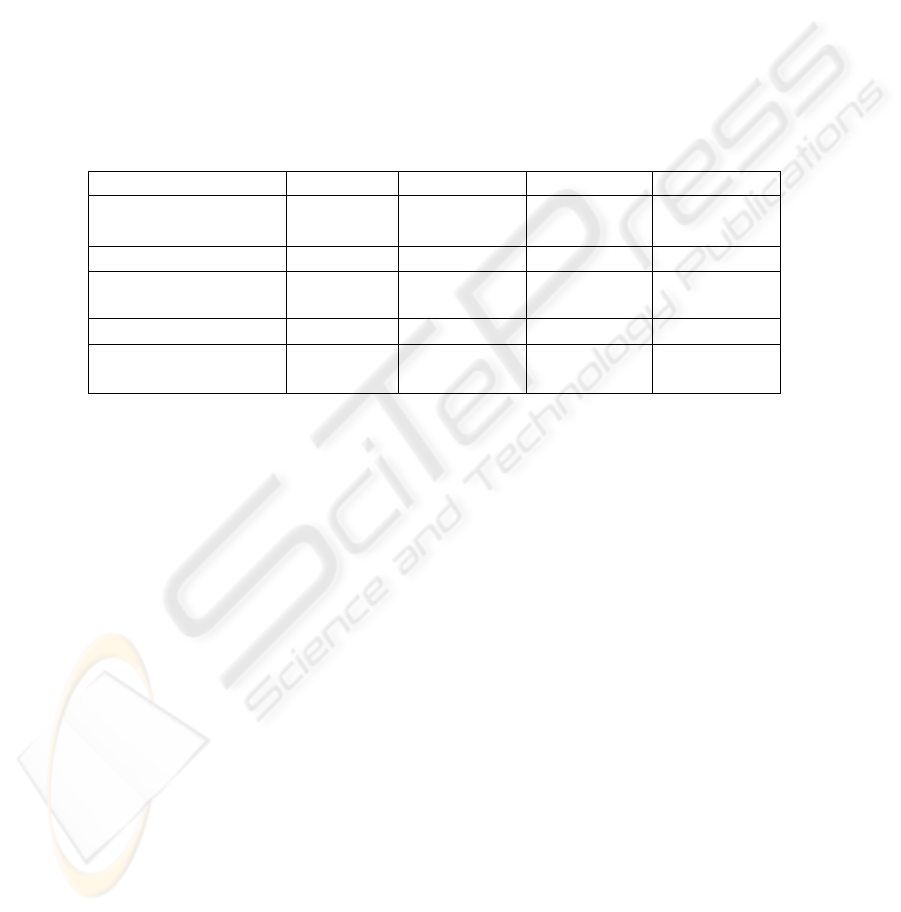
Table 3. Experimental conditions in Experiment 3: selective-learning-rate.
S-data L-data
Range of absolute
value of
Δ TOPIX(t)
0 to 50% 50 to 100%
Number of data 150 150
Relative number of
presentations (P)
1 1
Learning rate (
ε
)
0.14 0.7
P times
ε
(relative value)
0.14
(1)
0.7
(5)
)(
)(
)(
)(
)(
tNY
tOIL
tINTEREST
tEXCHANGE
tTOPIX
Δ
Δ
Δ
Δ
Δ
Neural network
(size: 5-5-1)
)1( +
Δ
tTOPIX
6
Experimental conditions in Experiment 4 are shown in Table 4. S-data were separated
into S1- and S2-data, where changes in S2-data were larger than those in S1-data.
Here, the boundary between S1- and S2-data was at the 25% point. (The 25% point
means that 25% of the data is between the minimum data and the 25% point data. The
50% point corresponds to the “median.”) L-data were separated into L1- and L2-data,
where changes in L2-data were larger than those in L1-data. Here, the boundary be-
tween L1- and L2-data was the 75% point. The 25%, 50%, and 75% points were 5.36
(about US$ 0.51), 14.78 (US$ 1.40) and 31.04 points (US$ 2.94), respectively. L1-,
L2-, S1-, and S2-data each had 75 data. In Experiment 4, L1- and L2-data were pre-
sented five times as often as S1- and S2-data. In Experiment 4, the learning rate for
L1- and S1-data was reduced to 50% (i.e.,
ε
= 0.7 for L2- and S2-data, and
ε
= 0.35
for L1- and S1-data). Relative selective intensities (number of presentations times
learning rate) for S1-, S2-, L1-, and L2-data were 1, 2, 5, and 10, respectively.
Table 4. Experimental conditions in Experiment 4: the hybrid technique.
S1-data S2-data L1-data L2-data
Range of absolute
value of
Δ
TOPIX(t)
0 to 25% 25 to 50% 50 to 75% 75 to 100%
Number of data 75 75 75 75
Relative number of
presentations (P)
1 1 5 5
Learning rate (
ε
) 0.35 0.7 0.35 0.7
P times
ε
(relative value)
0.35
(1)
0.7
(2)
1.75
(5)
3.5
(10)
In each experiment, network learning was stopped at the point having the maxi-
mum profit (the learning was stopped at the point having the maximum profit for the
validation data during 8000 learning cycles). The prediction error and profit were
monitored after every hundred learning cycles.
When a large change in TOPIX was predicted, we tried to calculate “Profit” as fol-
lows: when the predicted direction was the same as the actual direction, the daily
change in TOPIX was earned, and when it was different, the daily change in TOPIX
was lost. This calculation of profit corresponds to the following experimental TOPIX
trading system. A buy (sell) order is issued when the predicted next-day's up (down)
in TOPIX is larger than a preset value which corresponds to a large change. When a
buy (sell) order is issued, the system buys (sells) TOPIX shares at the current price
and subsequently sells (buys) them back at the next-day price. Transaction costs on
the trades were ignored in calculating the profit. The more accurately a large change
is predicted, the larger the profit is.
In each experiment, the momentum parameter
α
was 0.7. All the weights and bi-
ases in the neural network were initialized randomly between -0.3 and 0.3. In each
experiment the neural network was run four times for the same training data with
different initial weights and the average was taken.
7

3.2 Results
The experimental results are shown in Table 5. Multiple regression analysis (MR) was
also used in the experiments. The “prediction error on large-change test data” is the
mean absolute value of the prediction error for the test L-data.
Applying our selective-presentation approach (Experiment 2) reduced the predic-
tion error for test L-data and improved profits: the prediction-error on L-data was
reduced by 7% (1- (21.3/22.9)) and the network’s ability to make profits through
experimental TOPIX-trading was improved by 30% (550/422) compared with the
results obtained with the usual presentation approach (Experiment 1).
The prediction error and profits in Experiment 3 (selective-learning-rate approach)
were comparable to those in Experiment 2 (selective-presentation approach). Com-
bining selective-presentation with selective-learning-rate approaches (Experiment 4)
further reduced the prediction error for test L-data and improved profits: the predic-
tion-error was reduced by 10% (1- (20.7/22.9)) and the network’s ability to make
profits was improved by 38% (581/422).
Table 5. Experimental results.
MR Exp. 1 Exp. 2 Exp. 3 Exp. 4
Presentation
method
equal equal selective equal selective
Learning rate equal equal selective selective
Prediction error for
large-change data
(relative value)
24.3
(1.06)
22.9
(1)
21.3
(0.93)
21.3
(0.93)
20.7
(0.90)
Profit on test data
(relative value)
265
(0.62)
422
(1)
550
(1.30)
563
(1.33)
581
(1.38)
4 Conclusions
We investigated selective learning techniques for forecasting. In the first approach,
training data corresponding to large changes in the prediction-target time series are
presented more often, in the second approach, the learning rate for training data cor-
responding to small changes is reduced, and in the third approach, these two tech-
niques are combined. The results of several experiments on stock-price prediction
showed that the performances of selective-presentation and selective-learning-rate
approaches were both better than the usual presentation approach, and combining
them further improved the performance. Next, we will apply these techniques today’s
stock market and other real-world forecasting problems. We also plan to develop a
forecasting method that integrates statistical analysis with neural networks.
8

References
1. Weigend, A., Huberman, B., Rumelhart, D.: Predicting the future: a connectionist approach.
International Journal of Neural Systems, Vol. 1, No. 3. (1990) 193-209
2. Vemuri, V., Rogers, R. (eds): Artificial Neural Networks: Forecasting Time Series. IEEE
Press, Los Alamitos, CA (1994)
3. Pham, D., Liu, X.: Neural Networks for Identification, Prediction and Control. Springer
(1995)
4. Kil, D., Shin, F.: Pattern Recognition and Prediction with Applications to Signal Charac-
terization. American Institute of Physics Press (1996)
5. Mandic, D., Chambers, J.: Recurrent Neural Networks for Prediction. John Wiley & Sons
(2001)
6. Azoff, E.: Neural Network Time Series Forecasting of Financial Markets. John Wiley and
Sons, West Sussex (1994)
7. Refenes, A., Azema-Barac, M.: Neural network applications in financial asset management.
Neural Computing & Applications, Vol. 2, No. 1. Springer-Verlag, London (1994) 13-39
8. White, H.: Economic prediction using neural networks: the case of IBM daily stock return.
Proceedings of International Conference on Neural Networks. San Diego, CA (1988) II-
451-II-458
9. Baba, N., Kozaki, M.: An intelligent forecasting system of stock price using neural net-
works. Proceedings of International Conference on Neural Networks. Singapore (1992) I-
371-I-377
10. Freisleben, B.: Stock market prediction with backpropagation networks. Lecture Notes in
Computer Science, Vol. 604. Springer-Verlag, Heidelberg (1992) 451-460
11. Tang, Z., Almeida, C., Fishwick, P.: Time series forecasting using neural networks vs. Box-
Jenkins methodology. Simulation, Vol. 57, No. 5. (1991) 303-310
12. Kohara, K., Fukuhara, Y., Nakamura, Y.: Selective presentation learning for neural network
forecasting of stock markets. Neural Computing & Applications, Vol. 4, No. 3. Springer-
Verlag, London (1996) 143-148
13. Kohara, K., Fukuhara, Y., Nakamura, Y.: Selectively intensive learning to improve large-
change prediction by neural networks. Proceedings of International Conference on Engi-
neering Applications of Neural Networks. London (1996) 463-466
14. Kohara, K.: Selective-learning-rate approach for stock market prediction by simple recur-
rent neural networks. Lecture Notes in Artificial Intelligence, Vol. 2773. Springer-Verlag,
Heidelberg, (2003) 141-147
15. Kohara, K.: Neural networks for economic forecasting problems. In: Cornelius T. Leondes
(ed): Expert Systems -The Technology of Knowledge Management and Decision Making
for the 21st Century-. Academic Press. San Diego, CA (2002)
16. Kohara, K.: Foreign Exchange Rate Prediction with Selective Learning BPNNs and SOMs.
Proceedings of World Multi-Conference on Systemics, Cybernetics and Informatics. Orland,
FL (2005) 350-354
17. Park, D., El-Sharkawi, M., Marks II, R., Atlas, L., Damborg, M.: Electric load forecasting
using an artificial neural network. IEEE Transactions on Power Systems. Vol. 6, No. 2.
(1991) 442-449
9
