
FORMALIZING A MODEL TO REPRESENT AND VISUALIZE
CONCEPT SPACES IN E-LEARNING ENVIRONMENTS
Antonina Dattolo
Dipartimento di Matematica e Informatica, Universit`a di Udine, Udine, Italy
Flaminia L. Luccio
Dipartimento di Informatica, Universit`a Ca’ Foscari Venezia, Venezia, Italy
Keywords:
Adaptive educational hypermedia, concept maps, zz-structures, graph theory, e-learning.
Abstract:
Zz-structures offer graph-centric views capable of representing contextual interconnections among different
information. In this paper we use these structures in order to represent and visualize concept spaces in e-
learning environments, and we present their formal analytic description in terms of graph theory. In particular,
we focus our attention on the formal description of two views (H and I views), and we extend these notions
to a number n > 2 of dimensions. We also apply both this formal description, and the particular properties of
zz-structures, to an example in the Web-based education field.
1 INTRODUCTION
Adaptive Educational Hypermedia (AEH) (Cristea
et al., 2006) seek to apply the personalized possibil-
ities of Adaptive Hypermedia (Brusilovsky, 2001) to
the domain of education, thereby granting learners a
lesson individually tailored to them. A fundamental
part of these systems is the concept space (Dagger
et al., 2005): this provides an ontology of the subject
matter including the concepts and their relationships
to one another.
The purpose of concept mapping is not the production
of a map representing in absolute terms the relation-
ships between concepts, but the production of a visual
layout, which can make that specific issue clearer.
Concept spaces are traditionally visualized using a
concept map diagram, a downward-branching, hier-
archical tree structure. In mathematical terms, a con-
cept space map is a directed acyclic graph, a general-
ization of a tree structure, where certain sub-trees can
be shared by different parts of the tree.
Concept maps have got the double advantage of vi-
sually representing an information map and linking it
to useful material contained in a database. Learners
have a referring map to which they can come back to
review previous steps, and, mostly, learn how to orga-
nize information so “it makes sense” for them.
Unfortunately, traditional concept maps (Freire and
Rodriguez, 2005) are inadequate to capture and vi-
sualize very large collections of interrelated infor-
mation. Many of the more innovative tree visual-
ization techniques are not well suited to represent
concept maps: for example Shneiderman’s Treemaps
(Shneiderman, 1992) and Kleiberg’s Botanical trees
(Kleiberg et al., 2001) cannot easily differentiate be-
tween relationship types; other models (e. g. (Cassidy
et al., 2006), based on hyperbolic geometry, or (Suk-
somboon et al., 2007), based on S-nodes are not able
to dynamically switch from a view to another one. It
is often not possible to view the entire concept space
on-screen without zooming out so far that the concept
and relationship labels are no longer readable. Sim-
ilarly, the large number of relationships improve the
difficulty of understanding the structure of the con-
cept space.
In particular, in the e-learning field, there are many
reasons to define opportune structure models for stor-
ing and visualizing concept maps:
• They allow the system to be adaptive: current ap-
proaches and tools (see WebCT, Moodle, etc.) are
not adaptive, as they neither support a comprehen-
sive analysis of users’ needs, demands and oppor-
tunities, nor they support a semantic analysis of
texts.
• They provide interoperability between different
adaptive systems: this feature becomes not only
desirable but also necessary, as it enables the re-
use of previouslycreated material without the cost
339
Dattolo A. and L. Luccio F. (2008).
FORMALIZING A MODEL TO REPRESENT AND VISUALIZE CONCEPT SPACES IN E-LEARNING ENVIRONMENTS.
In Proceedings of the Fourth International Conference on Web Information Systems and Technologies, pages 339-346
DOI: 10.5220/0001525803390346
Copyright
c
SciTePress

of recreating it from scratch (Celik et al., 2006).
• They simplify the authoring process, in which the
user/learner may assume the role of an author
(see, e.g., Wikis and Wiki farms).
Considering the limitations highlighted by the study
of the current literature, we will focus our attention on
an innovative structure, proposed in (Nelson, 2004),
the zz-structure, that constitutes the main part of a
ZigZag system (Nelson, 1999).
Previous work in this direction has shown how flex-
ible this structure is, and how it can be specialized
in different fields, such as, e.g., the modeling of an
information manager for mobile phones (zz-phones)
(Moore and Brailsford, 2004), of the London under-
ground train lines and stations (Nelson, 1999), of
bioinformatics workspaces (Moore et al., 2004), of
data grid systems (Dattolo and Luccio, 2007), of an
authoring system for electronic music (Archimedes)
(Canazza and Dattolo, 2007), or of web-based courses
(Andric et al., 2007). Although the work (Nel-
son, 2004) provides a reference description of zz-
structures, and the other previously mentioned works
use different aspects and features of the model, Nel-
son itself writes: “The ZigZag system is very hard to
explain, especially since it resembles nothing else in
the computer field that we know of, except perhaps a
spreadsheet cut into strips and glued into loops ”.
Thus, in our opinion, a formal description of the struc-
ture may be very useful in simplifying the comprehen-
sion of the model.
Case Study. Our application field is Web-based ed-
ucation; it has become a very important area of edu-
cational technology and a challenge for semantic Web
techniques. Web-based education enables learners
and authors (teachers) to access a wide quantity of
continuously updated educational sources. In order
to simplify the learning process of learners, and the
course creation/modification/organization process of
authors, it is important to offer them tools to:
1. identify the collection of “interesting” documents,
for example applying semantic filtering algo-
rithms (Brodnik et al., 2006), or proximity metrics
on the search engine results (Andric et al., 2007);
2. store the found collection of documents in ade-
quate structures, that are able to organize and vi-
sualize concept spaces;
3. create personalized adaptive paths and views for
learners.
These three topics are the guidelines of our current
research. In this paper, we focus our attention only on
point 2. We assume that an author has a collection
of available documents on a given topic that have to
be organized in concept maps, suitable for different
learners. E.g., some users could be preparing a degree
thesis, others could be studying for an examination on
a particular topic, others could be doing research on
a specific research area, and so on. Thus, the author
needs adequate tools to organize documents in a con-
cept space, and to create semantic interconnections
and personalized maps.
Contributions of this Work. The general goal of
this work is to propose a formal structure for repre-
senting and visualizing a concept space. This model
is based both on zz-structures and on graph theory.
We will show how identifying and defining in an
analytic way the graph theoretical structure of zz-
structures can both provide interesting insights to ed-
ucational hypermedia designers (facilitating a deeper
understanding of which model might best support the
representation and interaction aims of their systems),
and to learners (offering them support for Web orien-
tation and navigation).
Our novel contributions are:
• a formal analytic graph-based description of zz-
structures. Particular attention has been devoted
to the formalization of two views (H and I views),
present into all ZigZag implementations;
• an extension of the concept of H and I views from
a number 2 towards a number n > 2 of dimen-
sions;
• a new concept map model for e-learning environ-
ments, based on our model.
The paper is organized as follows: in Section 2, we
introduce the reader to zz-structures and we present
some basic graph theory definitions; in Section 3, we
propose our formal definition of zz-structures, and we
use these structures as a reference model for repre-
senting concept maps. Finally, in Section 4 we first
introduce the definition of the standard H and I view,
and we then extend this definition to the non-standard
n-dimensions view (with n > 2). Conclusion and fu-
ture works conclude the paper.
2 Zz-STRUCTURES AND GRAPH
THEORY
This section is introduced for consistency. If the
reader has a background on the ZigZag model and on
basic graph theory, can skip this section.
WEBIST 2008 - International Conference on Web Information Systems and Technologies
340

2.1 An Introduction to Zz-Structures
Zz-structures (Nelson, 2004) introduce a new, graph-
centric system of conventions for data and computing.
A zz-structure can be thought of as a space filled with
cells. Each cell may have a content (such as integers,
text, images, audio, etc.), and it is called atomic if
it contains only one unit of data of one type (Moore
et al., 2004), or it is called referential if it represents
a package of different cells. There are also special
cells, called positional, that do not have content and
thus have a positional or topographical function.
Cells are connected together with links of the
same color into linear sequences called dimensions.
A single series of cells connected in the same dimen-
sion is called rank, i.e., a rank is in a particular di-
mension. Moreover, a dimension may contain many
different ranks. The starting and an ending cell of
a rank are called, headcell and tailcell, respectively,
and the direction from the starting (ending) to the
ending (starting) cell is called posward (respectively,
negward). For any dimension, a cell can only have
one connection in the posward direction, and one in
the negward direction. This ensures that all paths are
non-branching, and thus embodies the simplest pos-
sible mechanism for traversing links. Dimensions are
used to project different structures: ordinary lists are
viewed in one dimension; spreadsheets and hierarchi-
cal directories in many dimensions.
The interesting part is how to view these struc-
tures, i.e., there are many different ways to arrange
them, choosing different dimensions and different
structures in a dimension. A raster is a way of se-
lecting the cells from a structure; a view is a way of
placing the cells on a screen. Generic views are de-
signed to be used in a big variety of cases and usually
show only few dimensions or few steps in each di-
mension. Among them the most common are the two-
dimensions rectangular views: the cells are placed,
using different rasters, on a Cartesian plane where the
dimensions increase going down and to the right. Ob-
viously some cells will not fit in these two dimensions
and will have to be omitted. The simplest raster is the
row and column raster, i.e., two rasters which are the
same but rotated of 90 degrees from each other. A cell
is chosen and placed at the center of the plane (cursor
centric view). The chosen cell, called focus, may be
changed by moving the cursor horizontally and ver-
tically. In a row view I, a rank is chosen and placed
vertically. Then the ranks related to the cells in the
vertical rank are placed horizontally. Vice versa, in
the column view H, a rank is chosen and placed hor-
izontally and the related ranks are placed vertically.
All the cells are denoted by different numbers. Note
that in a view the same cell may appear in different
positions as it may represent the intersection of dif-
ferent dimensions.
2.2 Basic Graph Theory Definitions
In the following we introduce some standard graph
theory notation, for more details refer to (Harary,
1994).
A graph G is a pair G = (V, E), where V is a finite
non-empty set of elements called vertices and E is a
finite set of distinct unordered pairs {u, v} of distinct
elements of V called edges.
A multigraph is a triple MG = (V, E, f) where V is a
finite non-empty set of vertices, E is the set of edges,
and f : E → {{u, v} | u, v ∈ V, u 6= v} is a surjective
function.
An edge-colored multigraph is a triple ECMG =
(MG,C, c) where: MG = (V, E, f) is a multigraph, C
is a set of colors, c : E → C is an assignment of colors
to edges of the multigraph.
In a multigraph MG = (V, E, f ), edges e
1
, e
2
∈ E are
called multiple or parallel iff f(e
1
) = f(e
2
). Thus, a
graph as a particular multigraph G = (V, E, f) without
parallel edges.
Given an edge e = {u, v} ∈ E, we say that e is incident
to u and v; moreover u and v are neighboring vertices.
Given a vertex x ∈ V, we denote with deg(x) its de-
gree, i.e., the number of edges incident to x, and with
d
max
the maximum degree of the graph, i.e., d
max
=
max
z∈V
{deg(z)}. In an edge-colored (multi)graph
ECMG, where c
k
∈ C, we define deg
k
(x) the num-
ber of edges of color c
k
incident to vertex x. A vertex
of degree 0 is called isolated, a vertex of degree 1 is
called pendant.
A path P = {v
1
, v
2
, . . . , v
s
} is a sequence of neighbor-
ing vertices of G, i.e., {v
i
, v
i+1
} ∈ E, 1 ≤ i ≤ s − 1.
A graph G = (V, E) is connected if: ∀x, y ∈ V, ∃ a
path P = {x = v
1
, v
2
, . . . , v
s
= y}, with {v
k
, v
k+1
} ∈ E,
1 ≤ k ≤ s − 1. Two vertices x and y in a connected
graph are at distance dist if the shortest path connect-
ing them is composed of exactly dist edges.
Finally, a m × n mesh is a graph M
m,n
= (V, E) with
v
i, j
∈ V, 0 ≤ i ≤ m − 1, 0 ≤ j ≤ n − 1, and E con-
tains exactly the edges (v
i, j
, v
i, j+1
), j 6= n − 1, and
(v
i, j
, v
i+1, j
), i 6= m− 1.
3 THE FORMAL MODEL
In this section, we formalize the model presented in
(Nelson, 2004) in terms of graph theory. In the rest
of this paper we describe formal definitions through a
simple example in the e-learning field: an author has
a collection of available papers that first wants to link
FORMALIZING A MODEL TO REPRESENT AND VISUALIZE CONCEPT SPACES IN E-LEARNING
ENVIRONMENTS
341
through different semantic paths and then wants to
merge into a unique concept space. Papers that have
been published in the proceedings of the same con-
ference, or papers that investigate a common topic, or
papers that share one author, are examples of seman-
tic paths, which automatically generate concept maps.
3.1 Zz-Structures
A zz-structure can be viewed as a multigraph where
edges are colored, with the restriction that every ver-
tex has at most two incident edges of the same color.
Differently from (McGuffin, 2004), but as mentioned
in (McGuffin and Schraefel, 2004; Dattolo and Luc-
cio, 2007), we consider undirected graphs, i.e., edges
may be traversed in both directions. A zz-structure is
formally defined as follows.
Definition 1 (Zz-structure). A zz-structure is
an edge-colored multigraph S = (MG,C, c),
where MG = (V, E, f), and ∀x ∈ V, ∀k = 1, 2,
..., |C|, deg
k
(x) = 0, 1, 2. Each vertex of a zz-structure
is called zz-cell and each edge zz-link. The set of
isolated vertices is V
0
= {x ∈ V : deg(x) = 0}.
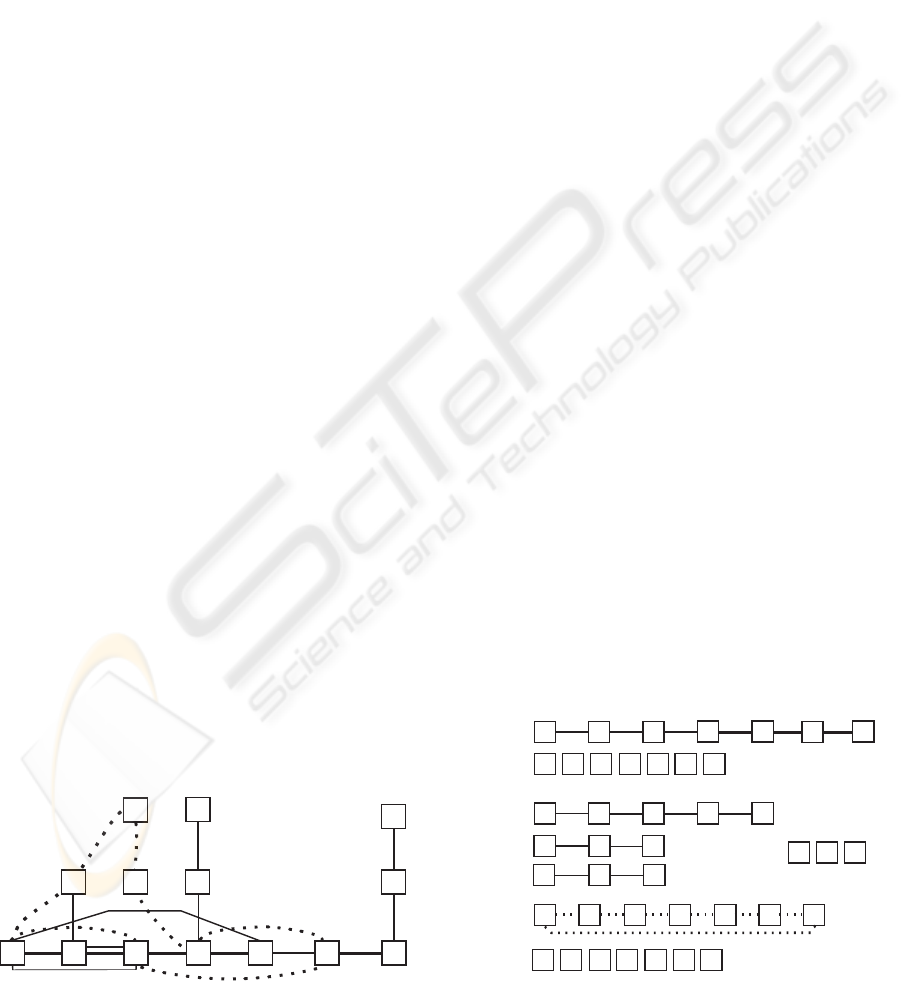
An example of a zz-structure is given in Figure 1. The
structure is a graph, where vertices v
1
, . . . , v
14
repre-
sent different papers, and edges of the same kind rep-
resent the same semantic connection.
In particular, in this example, thick edges connect
a sequence of papers published at the same confer-
ence (e.g., WEBIST2007), normal edges group pa-
pers that have at least an author in common, finally,
dotted lines link papers that have a keyword in com-
mon (e.g., wbe, that stands for web-based education).
3.2 Dimensions
An alternative way of viewing a zz-structure is a
union of subgraphs, each of which contains edges of
a unique color.
Proposition 1 Consider a set of colors
C = {c
1
, c
2
, ..., c
|C|
} and a family of indirect
v
1
v
2
v
5
v
3
v
12
v
6
v
4
v
7
v
10
v
11
v
13
v
14
v
8
v
9
Figure 1: A zz-structure where thick, normal and dotted
lines represent three different colors.
edge-colored graphs {D
1
, D
2
, ..., D
|C|
}, where
D
k
= (V, E
k
, f, {c
k
}, c), with k = 1, ..., |C|, is a graph
such that: 1) E
k
6= Ø; 2) ∀x ∈ V, deg
k
(x) = 0, 1, 2.
Then, S =
S
|C|
k=1
D
k
is a zz-structure.
Definition 2 (Dimension). Given a zz-structure S =
S
|C|
k=1
D
k
, then each graph D
k
, k = 1, . . . , |C|, is a dis-
tinct dimension of S.
From Figure 1 we can extrapolate three dimensions,
one for each different color (i.e., one for each differ-
ent semantic connection). As shown in Figure 2, we
associate thick lines to dimension D
conference
, normal
lines to dimension D
author
, and dotted lines to dimen-
sion D
wbe topic
.
Each dimension can be composed of isolated ver-
tices (e.g., vertices v
6
, v
9
, v
12
in dimension D
author
), of
distinct paths (e.g., the three paths {v
8
, v
2
, v
3
, v
1
, v
5
},
{v
4
, v
10
, v
13
} and {v
7
, v
11
, v
14
} in dimension D
author
),
and of distinct cycles (e.g., the unique cycle
{v
1
, v
3
, v
6
, v
4
, v
9
, v
12
, v
8
, v
1
} in dimension D
wbe topic
).
3.3 Ranks
Definition 3 (Rank). Consider a dimension D
k
= (V,
E
k
, f, {c
k
}, c), k = 1, . . . , |C| of a zz-structure S =
∪
|C|
k=1
D
k
. Then, each of the l
k
connected components
of D
k
is called a rank.
Thus, each rank R
k
i
= (V
k
i
, E
k
i
, f, {c
k
}, c), i = 1, . . . , l
k
,
is an indirect, connected, edge-colored graph such
that: 1) V
k
i
⊆ V; 2) E
k
i
⊆ E
k
; 3) ∀x ∈ V
k
i
, 1 ≤
deg
k
(x) ≤ 2. A ringrank is a rank R
k
i
, where ∀x ∈
V
k
i
, deg
k
(x) = 2.
Note that the number l
k
of ranks differs in each
dimension D
k
, e.g. in Figure 2, dimension D
author
has three ranks ({ v
8
, v
2
, v
3
, v
1
, v
5
}, {v
4
, v
10
, v
13
} and
{v
7
, v
11
, v
14
}), and dimension D
conference
has a unique
rank ({v
1
, v
2
, v
3
, v
4
, v
5
, v
6
, v
7
}). A ringrank is, e.g.,
v
1
D
conference
D
author
D
wbetopic
v
2
v
3
v
6
v
8
v
3
v
1
1
v
1
0
v
1
2
v
1
1
v
1
3
v
1
4
v
1
0
v
8
v
1
2
v
9
v
5
v
9
v
8
v
2
v
6
v
5
v
9
v
6
v
12
v
4
v
4
v
8
v
2
v
3
v
v
1
1
4
4
v
11
v
4
v
10
v
v
13
7
v
7
v
5
v
1
v
7
v
1
Figure 2: The three dimensions.
WEBIST 2008 - International Conference on Web Information Systems and Technologies
342

the cycle {v
1
, v
3
, v
6
, v
4
, v
9
, v
12
, v
8
, v
1
} of dimension
D
wbe topic
.
Definition 4 (Parallel Ranks). Given a zz-structure
S = ∪
|C|
k=1
D
k
, m ranks R
k
j
= (V
k
j
, E
k
j
, f, {c
k
}, c), (j =
1, 2, . . . , m, 2 ≤ m ≤ l
k
) are parallel ranks on the same
dimension D
k
, k ∈ {1, . . . , |C|} iff V
k
j
⊆ V, E
k
j
⊆
E
k
, ∀ j = 1, 2, . . . , m, and ∩
m
j=1
V
k
j
=
/
0.
In Figure 2 the three ranks of dimension D
author
are parallel.
3.4 Cells and their Orientation
A vertex has local orientation on a rank if each of its
(1 or 2) incident edges has assigned a distinct label
(1 or -1). More formally (see also (Flocchini et al.,
1998)):
Definition 5 (Local Orientation). Consider a rank
R
k
i
= (V
k
i
, E
k
i
, f, {c
k
}, c) of a zz-structure S = ∪
|C|
k=1
D
k
.
Then, ∃ a function g
i
x
: E
k
i
→ {−1, 1}, such that, ∀x ∈
V
k
i
, if ∃y, z ∈ V
k
i
: {x, y}, {x, z} ∈ E
k
i
, then g
i
x
({x, y}) 6=
g
i
x
({x, z}). Thus, we say that each vertex x ∈ V
k
i
has a
local orientation in R
k
i
.
Definition 6 (Posward and Negward Directions).
Given an edge {a, b} ∈ E
k
i
, we say that {a, b} is in
a posward direction from a in R
k
i
, and that b is its
posward cell iff g
i
a
({a, b}) = 1, else {a, b} is in a neg-
ward direction and a is its negward cell. Moreover, a
path in rank R
k
i
follows a posward (negward) direc-
tion if it is composed of a sequence of edges of value
1 (respectively, -1).
For simplicity, given a rank R
k
i
, a way to represent
a path composed of a vertex x and a sequence of its
negward and posward cells, is by using the notation
. . . x
−2
x
−1
xx
+1
x
+2
. . . , where, x
−1
represents the neg-
ward cell of x and x
+1
the posward cell. In gen-
eral, x
−i
(x
+i
) is a cell at distance i in the negward
(posward) direction. We also assume that x
0
= x.
Definition 7 (Headcell and Tailcell). Given a rank
R
k
i
= (V
k
i
, E
k
i
, f, {c
k
}, c), a cell x is the headcell of R
k
i
iff ∃ its posward cell x
+1
and 6 ∃ its negward cell x
−1
.
Analogously, a cell x is the tailcell of R
k
i
iff ∃ its neg-
ward cell x
−1
and 6 ∃ its posward cell x
+1
.
4 VIEWS
We now formalize the standard notion of H and I
views in two dimensions, and we then propose a new
definition of H and I-views in n dimensions. We
also show some interesting applications of these new
higher dimensional views.
In the following, that we denote with x ∈ R
a
(x)
the
rank R
a
(x)
related to vertex x of color c
a
.
Definition 8 (H-view). Given a zz-structure S =
∪
|C|
k=1
D
k
, where D
k
= ∪
l
k
i=1
(R
k
i
∪V
k
0
), and where R
k
i
=
(V
k
i
, E
k
i
, f, {c
k
}, c), the H-view of size l = 2m + 1
and of focus x ∈ V = ∪
l
k
i=0
V
k
i
, on main vertical di-
mension D
a
and secondary horizontal dimension D
b
(a, b ∈ {1, ..., l
k
}), is defined as a tree whose embed-
ding in the plane is a partially connected colored l ×l
mesh in which:
• the central node, in position ((m+ 1), (m+ 1)), is
the focus x;
• the horizontal central path (the m+1-th row) from
left to right, focused in vertex x ∈ R
b
(x)
is:
x
−g
. . . x
−1
xx
+1
. . . x
+p
where x
s
∈ R
b
(x)
, for s =
−g, . . . , +p (g, p ≤ m).
• for each cell x
s
, s = −g, . . . , +p, the related
vertical path, from top to bottom, is:
(x
s
)
−g
s
. . . (x
s
)
−1
x
s
(x
s
)
+1
. . . (x
s
)
+p
s
, where
(x
s
)
t
∈ R
a
(x
s
)
, for t = −g
s
, . . . , +p
s
(g
s
, p
s
≤ m).
Intuitively, the H-view extracts ranks along the two
chosen dimensions. Note that, the name H-view
comes from the fact that the columns remind the
vertical bars in a capital letter H. Observe also that
the cell x
−g
(in the m + 1-th row) is the headcell of
R
b
(x)
if g < m and the cell x
+p
(in the same row) is the
tailcell of R
b
(x)
if p < m. Analogously, the cell x
−g
s
is the headcell of R
a
(x
s
)
if g
s
< m and the cell x
+p
s
is
the tailcell of R
a
(x
s
)
if p
s
< m. Intuitively, the view is
composed of l × l cells unless some of the displayed
ranks have their headcell or tailcell very close (less
than m steps) to the chosen focus.
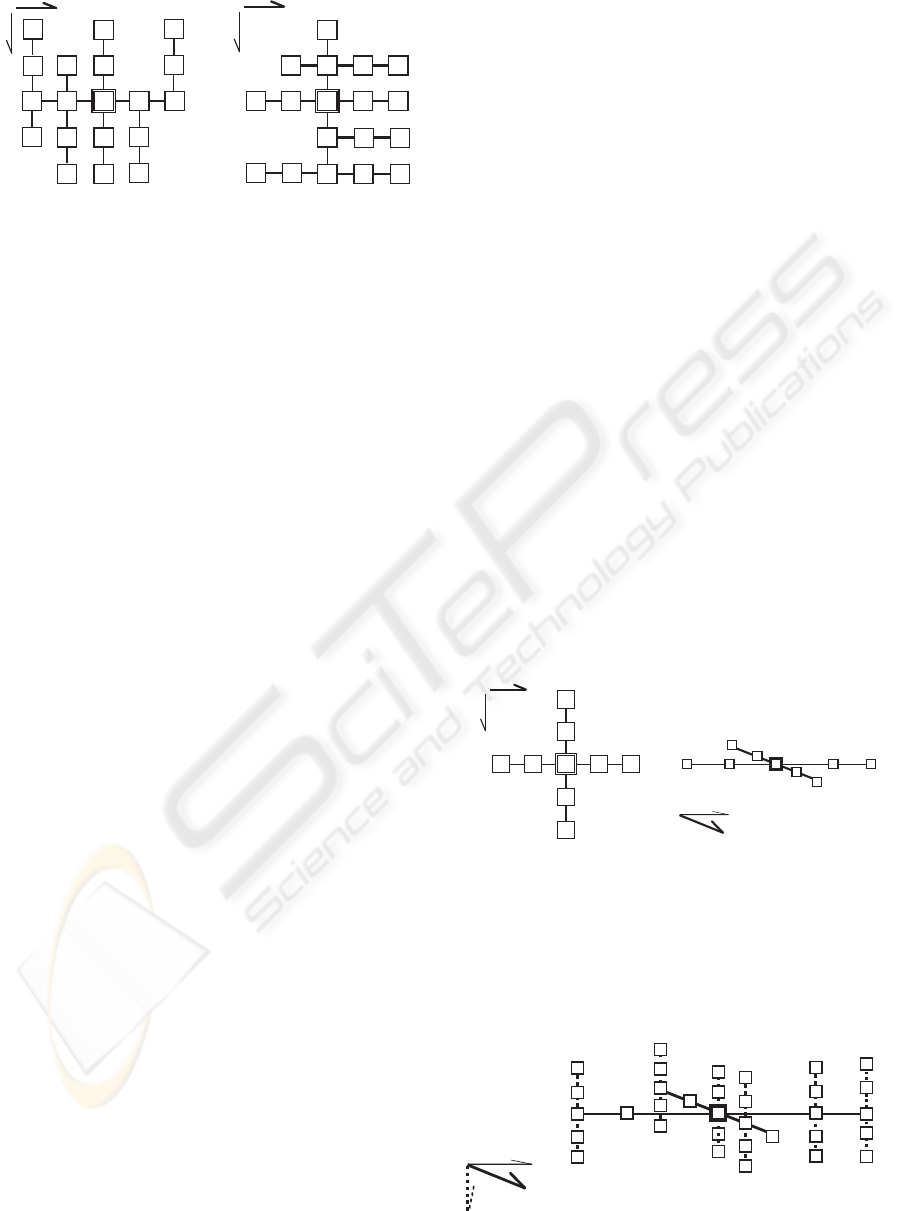
As an example consider Figure 3 left that refers
to the zz-structure of Figure 1. The main vertical
dimension is D
author
and the secondary horizon-
tal dimension is D
conference
. The view has size
l = 2m + 1 = 5, the focus is v
3
, the horizontal
central path is v
−2
3
v
−1
3
v
3
v
+1
3
v
+2
3
= {v
1
, v
2
, v
3
, v
4
, v
5
}
(g, p = 2). The vertical path related to v
−1
3
= v
2
is
(v
−1
3
)
−1
(v
−1
3
)(v
−1
3
)
+1
(v
−1
3
)
+2
= {v
8
, v
2
, v
3
, v
1
} (g
s
= 1
and p
s
= 2), that is (v
−1
3
)
−1
= v
8
is the headcell of
the rank as g
s
= 1 < m = 2.
Analogously to the H-view we can define the I-view.
Definition 9 (I-view). Given a zz-structure S =
∪
|C|
k=1
D
k
, where D
k
= ∪
l
k
i=1
(R
k
i
∪V
k
0
), and where R
k
i
=
FORMALIZING A MODEL TO REPRESENT AND VISUALIZE CONCEPT SPACES IN E-LEARNING
ENVIRONMENTS
343
v
v
2
2
v
v
v
3
3
3
v
5
v
v
1
10
v
v
1
1
v
4
v
2
v
v
v
5
5
13
v
8
v
8
v
1
v
v
v
2
2
6
v
3
v
5
v
1
v
4
v
v
4
4
v
2
v
5
v
8
v
1
v
1
D
conference
H-view I-view
D
author
D
conference
D
author
v
3
v
v
v
v
3
3
3
7
Figure 3: H-view and I-view, related to Figure 1.
(V
k
i
, E
k
i
, f, {c
k
}, c), the I-view of size l = 2m + 1
and of focus x ∈ V = ∪
l
k
i=0
V
k
i
on main horizontal
dimension D
a
and secondary vertical dimension D
b
(a, b ∈ {1, ..., l
k
}), is defined as a partially connected
colored l × l mesh in which:
• the central node, in position ((m+ 1), (m+ 1)) is
the focus x;
• the vertical central path (the m + 1-th column)
from top to bottom, focused in vertex x ∈ R
b
(x)
is:
x
−u
. . . x
−1
xx
+1
. . . x
+r
where x
s
∈ R
b
(x)
, for s = −u,
. . . , +r (u, r ≤ m).
• for each cell x
s
, s = −u, . . . , +r, the related
horizontal path, from left to right, is:
(x
s
)
−u
s
. . . (x
s
)
−1
x
s
(x
s
)
+1
. . . (x
s
)
+r
s
, where
(x
s
)
t
∈ R
a
(x
s
)
, for t = −u
s
, . . . , +r
s
(u
s
, r
s
≤ m).
Note that, the name I-view comes from the fact that
the rows remind the horizontal serif in a capital letter
I. Observe also that the cell x
−u
(in the m + 1-th
column) is the headcell of R
b
(x)
if u < m and the x
+r
(in the same column) is the tailcell of R
b
(x)
if r < m.
Analogously, the cell x
−u
s
is the headcell of R
a
(x
s
)
if
u
s
< m and the x
+r
s
is the tailcell of R
a
(x
s
)
if r
s
< m.
As example consider Figure 3 right. The main hori-
zontal dimension is D
conference
and the secondary ver-
tical dimension is D
author
. The view has size l =
2m+ 1 = 5, the focus is v
3
, the vertical central path is
v
−2
3
v
−1
3
v
3
v
+1
3
v
+2
3
= {v
8
, v
2
, v
3
, v
1
, v
5
} (u, r = 2). The
horizontal path related to v
−1
3
= v
2
is (v
−1
3
)
−1
. . .
(v
−1
3
)
+2
= {v
1
, v
2
, v
3
, v
4
} (i.e., r = 2). Vice versa the
horizontal path related to v
+1
3
= v
1
is {v
1
, v
2
, v
3
} and
v
1
is the headcell. Finally, the horizontal path related
to v
+2
3
= v
5
is {v
3
, v
4
, v
5
, v
6
, v
7
}.
We can now extend the known definition of H and I
views to a number n > 2 of dimensions. Intuitively,
we will build n− 1 different H-views (respectively, I-
views), centered in the same focus, with a fixed main
dimension and a secondary dimension chosen among
the other n− 1 dimensions. Formally:
Definition 10 (n-Dimensions H-view). Given a zz-
structure S = ∪
|C|
k=1
D
k
, where D
k
= ∪
l
k
i=1
(R
k
i
∪V
k
0
), and
where R
k
i
= (V
k
i
, E
k
i
, f, {c
k
}, c), the n-dimensions H-
view of size l = 2m+1 and of focus s x ∈ V = ∪
l
k
i=0
V
k
i
,
on dimensions D
1
, D
2
, . . . , D
n
is composed of n − 1
rectangular H-views, of main dimension D
1
and sec-
ondary dimensions D
i
, i = 2, . . . , n, all centered in the
same focus x.
Analogously, we have the following:
Definition 11 (n-Dimensions I-view). Given a zz-
structure S = ∪
|C|
k=1
D
k
, where D
k
= ∪
l
k
i=1
(R
k
i
∪V
k
0
), and
where R
k
i
= (V
k
i
, E
k
i
, f, {c
k
}, c), the n-dimensions I-
view of size l = 2m+ 1 and of focus x ∈ V = ∪
l
k
i=0
V
k
i
,
on dimensions D
1
, D
2
, . . . , D
n
is composed of n − 1
rectangular I-views of main dimension D
1
, and sec-
ondary dimensions D
i
, i = 2, . . . , n, all centered in the
same focus x.
In Figure 3, we can distinguish only two dimensions
(D
conference
and D
author
).
To display a 3-dimensions H-view we can add a
new dimension (let it be D
wbe topic
). This new H-view
has main dimension D
wbe topic
, and secondary dimen-
sions D
conference
and D
author
. To construct this view
we start from Figure 1 using v
3
as focus, and we con-
sider the two central paths (Figure 4 left), related to
the two secondary dimensions D
conference
and D
author
.
v
2
v
5
v
4
v
1
v
2
v
5
v
1
v
8
D
conference
D
author
v
3
D
D
conference
author
Figure 4: Two secondary dimensions cross the focus v
3
.
The same visualization is shown in Figure 4 right
under a different perspective.
Finally, in Figure 5 we obtain the 3-dimensions H-
view where the vertical paths on main dimension
D
wbe topic
are added.
D
D
D
conference
author
wbetopic
Figure 5: An example of a 3-dimensions H-view.
WEBIST 2008 - International Conference on Web Information Systems and Technologies
344
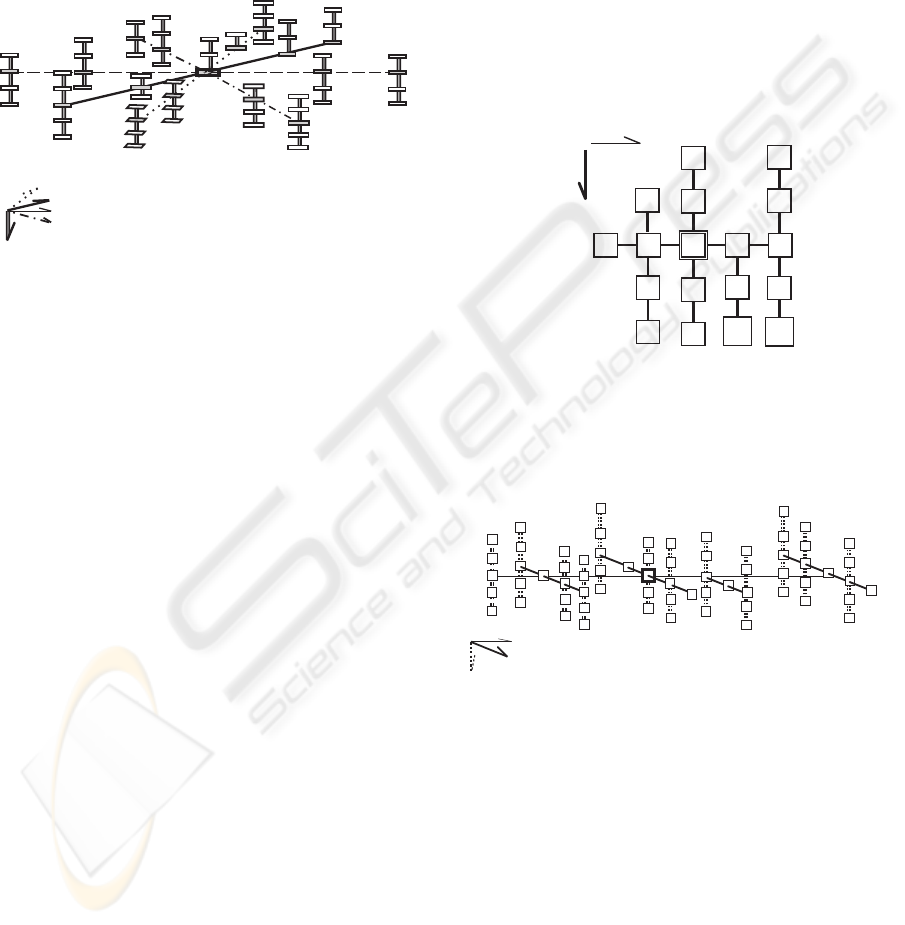
We can now extend this example to the n-dimensions
case. In Figure 6, we show a 5-dimensions view, con-
sidering four secondary dimensions. In our example,
we have added other two dimensions (D
publication year
and D
publishing house
), representing the year of publi-
cation of the article and the publishing house. This
new view has focus v
3
, size l = 2m+ 1 = 5 and main
dimension D
publication year
.
D
D
D
D
D
conference
publishinghouse
publicationyear
author
wbetopic
Figure 6: A 5-dimensions H-view.
In the 3-dimensions case, we can extend the pre-
vious definition of a 3-dimensions H (or I) view. In-
tuitively, we build a standard 2-dimensions H (or I)
view and, starting from each of the related cells as fo-
cus, we display also the ranks in the third dimension.
Formally:
Definition 12 (3-Dimensions extended H-view).
Consider a zz-structure S = ∪
|C|
k=1
D
k
, where D
k
=
∪
l
k
i=1
(R
k
i
∪ V
k
0
), and where R
k
i
= (V
k
i
, E
k
i
, f, {c
k
}, c).
The 3-dimensions extended H-view of size l = 2m+
1 and of focus x ∈ V = ∪
l
k
i=0
V
k
i
, on dimensions
D
1
, D
2
, D
3
, is composed as follows:
• the central path (the m + 1-th row) from left to
right, focused in vertex x ∈ R
3
(x)
: x
−g
. . . x. . . x
+p
,
where x
s
∈ R
3
(x)
, for s = −g, . . . , +p, g, p ≤ m and
g+ p+ 1 = l
′
;
• l
′
rectangular H-views of same size l and of fo-
cuses respectively x
−g
, . . . , x, . . . , x
+p
, on main di-
mension D
1
and secondary dimension D
2
.
Analogously we can define a 3-dimensions extended
I-view.
Definition 13 (3-Dimensions extended I-
view). Consider a zz-structure S = ∪
|C|
k=1
D
k
,
where D
k
= ∪
l
k
i=1
(R
k
i
∪ V
k
0
), and where
R
k
i
= (V
k
i
, E
k
i
, f, {c
k
}, c). The 3-dimensions ex-
tended I-view of size l = 2m + 1 and of focus
x ∈ V = ∪
l
k
i=0
V
k
i
, on dimensions D
1
, D
2
, D
3
, is
composed as follows:
• the central path (the m+1-th column) from top to
bottom, focused in vertex x∈ R
3
(x)
: x
−u
. . . x. . . x
+r
,
where x
s
∈ R
3
(x)
, for s = −u, . . . , +r, u, r ≤ m and
u+ r+ 1 = l
′′
;
• l
′′
rectangular I-views of same size l and of fo-
cuses respectively x
−u
, . . . , x, . . . , x
+r
, on main di-
mension D
1
and secondary dimension D
2
.
As example, we start from Figure 4 and we consider
the related 2-dimensions H-view of size 5 and of fo-
cus v
3
, on main dimension D
conference
and secondary
dimension D
author
. We obtain the H-view shown in
Figure 7.
v
2
v
5
v
v
4
4
v
1
v
v
v
v
2
4
2
6
v
5
v
v
v
1
1
3
v
8
D
conference
D
author
v
v
v
v
3
3
7
3
Figure 7: Standard 2-dimensions H-view.
Now, for each cell of this view, we visualize the
related ranks in dimension D
wbe topic
. The result is
shown in Figure 8.
D
D
D
conference
author
wbetopic
Figure 8: A 3-dimensions extended H-view.
5 CONCLUSIONS
In this paper we have provided a description of zz-
structures, of H-view and I-view, and we have ex-
tended these definition to n-dimensions views. Our
aim is to use this formal model to represent concept
maps and to study their behavior in the Adaptive Ed-
ucational Hypermedia field.
This paper represents a first step in this direction and
it is part of larger project. Starting from the present
model, future works will focus on:
• automatic semantic filtering methodologies;
FORMALIZING A MODEL TO REPRESENT AND VISUALIZE CONCEPT SPACES IN E-LEARNING
ENVIRONMENTS
345

• an extension of this model towards an open, dis-
tributed and concurrent agent based architecture;
• adaptive navigation and presentation for learners;
• authoring facilities for web-based courses.
REFERENCES
Andric, M., Devedzic, V., Hall, W., and Carr, L. (2007).
Keywords linking method for selecting educational
web resources `a la zigzag. International Journal of
Knowledge and Learning, 3(1):30–45.
Brodnik, A., Jonsson, H., Rossiand, P. G., and Tasso, C.
(2006). Interoperability and semantic filtering. Jour-
nal of e-Learning and Knowledge Society, 2(2):165–
175.
Brusilovsky, P. (2001). Adaptive hypermedia. User Mod-
elling and User-Adapted Interaction, 11:87–110.
Canazza, S. and Dattolo, A. (2007). Open, dynamic elec-
tronic editions of multidimensional documents. In
Proceedings of the IASTED European Conference on
Internet and Multimedia Systems and Applications,
pages 230–235. Chamonix, France.
Cassidy, K., Walsh, J., Coghlan, B., and Dagger, D. (2006).
Using hyperbolic geometry for visualisation of con-
cept spaces for adaptive elearning. In Proceedings
of A3H: 1st International Workshop on Authoring of
Adaptive & Adaptable Hypermedia. Dublin, Ireland.
Celik, I., Stewart, C., and Ashman, H. (2006). Interoper-
ability as an aid to authoring: Accessing user models
in multiple AEH systems. In Proceedings of A3EH:
4th International Workshop on Authoring of Adaptive
& Adaptable Educational Hypermedia. Dublin, Ire-
land.
Cristea, A., Carro, R. M., and Garzotto, F. (2006). A3EH:
4th international workshop on authoring of adaptive
& adaptable educational hypermedia (proceedings).
http://www.win.tue.nl/∼acristea/A3H/.
Dagger, D., Conlan, O., and Wade, V. (2005). Funda-
mental requirements of personalised elearning devel-
opment environments. In Proceedings of E-Learn
2005, World Conference on E-Learning in Corporate,
Government, Healthcare & Higher Education, pages
2746–2754. Vancouver, Canada.
Dattolo, A. and Luccio, F. (2007). A new actor-based
structure for distributed systems. In Proceedings of
the MIPRO International Conference on Hypermedia
and Grid Systems (HGS07), pages 195–201. Opatija,
Croatia.
Flocchini, P., Mans, B., and Santoro, N. (1998). Sense of di-
rection: Definitions, properties and classes. Networks,
32(3):165–180.
Freire, M. and Rodriguez, P. (2005). Comparing graphs and
trees for adaptive hypermedia authoring. In Proceed-
ings of A3EH: 3rd International Workshop on Author-
ing of Adaptive & Adaptable Educational Hyperme-
dia, pages 6–14. Amsterdam, Holland.
Harary, F. (1994). Graph Theory. Addison-Wesley, Read-
ing, MA, USA.
Kleiberg, E., van de Wetering, H., and van Wijk, J. J.
(2001). Botanical visualisation of huge hierarchies.
In Proceedings IEEE Symposium on Information Vi-
sualisation, pages 87–94. Austin, TX.
McGuffin, M. (2004). A graph-theoretic introduction to ted
nelson’s zzstructures. http://www.dgp.toronto.edu/
∼mjmcguff/research/zigzag/.
McGuffin, M. and Schraefel, M. (2004). A comparison
of hyperstructures: Zzstructures, mspaces, and pol-
yarchies. In Proceedings of the 15th ACM Conference
on Hypertext and Hypermedia (HT’04), pages 153–
162. Santa Cruz, California, USA.
Moore, A. and Brailsford, T. (2004). Unified hyperstruc-
tures for bioinformatics: escaping the application
prison. Journal of Digital Information, 5(1):Article
No.254.
Moore, A., Goulding, J., Brailsford, T., and Ashman, H.
(2004). Practical applitudes: Case studies of applica-
tions. In Proceedings of the 15th ACM Conference on
Hypertext and Hypermedia (HT’04), pages 143–152.
Santa Cruz, California, USA.
Nelson, T. H. (1999). Welcome to zigzag (the zigzag tuto-
rial). http://xanadu.com/zigzag/tutorial/
ZZwelcome.html.
Nelson, T. H. (2004). A cosmology for a different computer
universe: data model mechanism, virtual machine and
visualization infrastructure. Journal of Digital Infor-
mation: Special Issue on Future Visions of Common-
Use Hypertext, 5(1):298.
Shneiderman, B. (1992). Tree visualisation with tree-maps:
2-d space filling approach. ACM Transactions on
Graphics, 11(1):92–99.
Suksomboon, P., Herin, D., and Sala, M. (2007). Peda-
gogical resources representation in respect in ontology
and course section. In Proceeding of WEBIST 2007,
the 3rd International Conference on Web Information
Systems and Technologies, pages 532–535. Barcelona,
Spain.
WEBIST 2008 - International Conference on Web Information Systems and Technologies
346
