
BLA
CKBIRD MONITORING SYSTEM
Performance Analysis and Monitoring in Information Systems
Jo
˜
ao P. Germano
Vodafone Portugal, AV. D.Jo
˜
ao II, LT.1.04.01 Parque Nac¸
˜
oes 1998-017, Lisboa, Portugal
Alberto R. Silva, Fernando M. Silva
INESC-ID R. Alves Redol, 9 1000-029, Lisboa, Portugal
Keywords:
Application Monitoring, Systems Administration, Application Performance, Component, Adaptable.
Abstract:
This work presents the BlackBird system, which is an analysis and monitoring service for data-intensive en-
terprise applications, without restrictions on the targeted architecture or employed technologies. Monitoring
systems are an essential tool for the effective management of Enterprise Applications and the attainment of the
demanding service level agreements imposed to these applications. However, due to the increasing complexity
and diversity of these applications, adequate monitoring systems are rarely available. The BlackBird monitor-
ing system is able to interact with these applications through different technologies employed by the Monitored
Application, and able to produce Metrics regarding the application service level goals. The BlackBird archi-
tecture is composed by several Application Interface Modules, and by a central component responsible for
Metrics calculation and presentation. Application Interface Modules interact with the target monitored Appli-
cation in order to get performance data in a common format. These data are stored in a common repository
and used for Metrics calculation and presentation. The BlackBird system can be specified through a set of
pre-defined Configuration Objects, allowing it to be extensible and adaptable for applications with different
architectures.
1 INTRODUCTION
As a provider of high technology services, Vodafone
is under constant pressure to implement new tech-
nologies that will allow the diversification of the pro-
vided services and the improvement of existing ser-
vices. Like in most large scale and technology based
business, the Information Technologies (IT) infras-
tructure has become the main base of support to busi-
ness processes, and many Enterprise Applications are
now considered mission-critical having a direct im-
pact on the performance goals of the entire company.
The complexity and diversity of the business rules
and provided services, together with the pressure for
fast implementation demand a vast portfolio of dif-
ferent applications. These applications can be ex-
tremely diverse, in terms of complexity, architecture,
base technologies and application provider. Also, as
result of the fierce competition environment, all these
applications are required to constantly evolve in order
to implement new business requirements and support
new services. In organizations such as Vodafone the
teams responsible for the operation and management
of these applications are faced with the challenge of
assuring the best possible quality of service and the
attainment of the negotiated Service Level Agrement
(SLA). For this task it is essential to have monitoring
systems capable of providing a comprehensive view
of the application status and the most critical com-
ponents, in order to anticipate performance problems
and act before there is any impact on the quality of
service. The currently available monitoring systems
can provide efficient monitoring on the network and
device level, however, due to the complexity and di-
versity of the applications, these systems are unable
to provide the desired monitoring on the application
level.
Most of the available monitoring systems specif-
ically target applications or technologies that have a
large user base, are limited to a fixed architecture, and
monitor pre-determined system parameters and ex-
pected system components. This kind of monitoring
ignores all the functionality that is developed over the
base application, even though, it is this added func-
tionality that implements the business logic and pro-
duces the most relevant contribution to the delivered
46
P. Germano J., R. Silva A. and M. Silva F. (2008).
BLACKBIRD MONITORING SYSTEM - Performance Analysis and Monitoring in Information Systems.
In Proceedings of the Fourth International Conference on Web Information Systems and Technologies, pages 46-53
DOI: 10.5220/0001529100460053
Copyright
c
SciTePress
quality of service. The need for adequate monitor-
ing applications is even more serious for applications
developed in house or when the Monitored Applica-
tion results from an extensive customization of a base
application. In this case the only solution is to de-
velop, also in house, the necessary monitoring sys-
tems. However, this extra development effort will cer-
tainly increase project cost and complexity and risk
development delays.
The BlackBird monitoring system is intended for
assisting in the effective management of the ex-
tremely diversified set of applications from the Infor-
mation & System Technologies department (DTSI) of
Vodafone Portugal. It has two main features: i) can
monitor an extremely diversified range of applications
such as the one found at Vodafone; ii) provides com-
plex Metrics that relate to the main application goals.
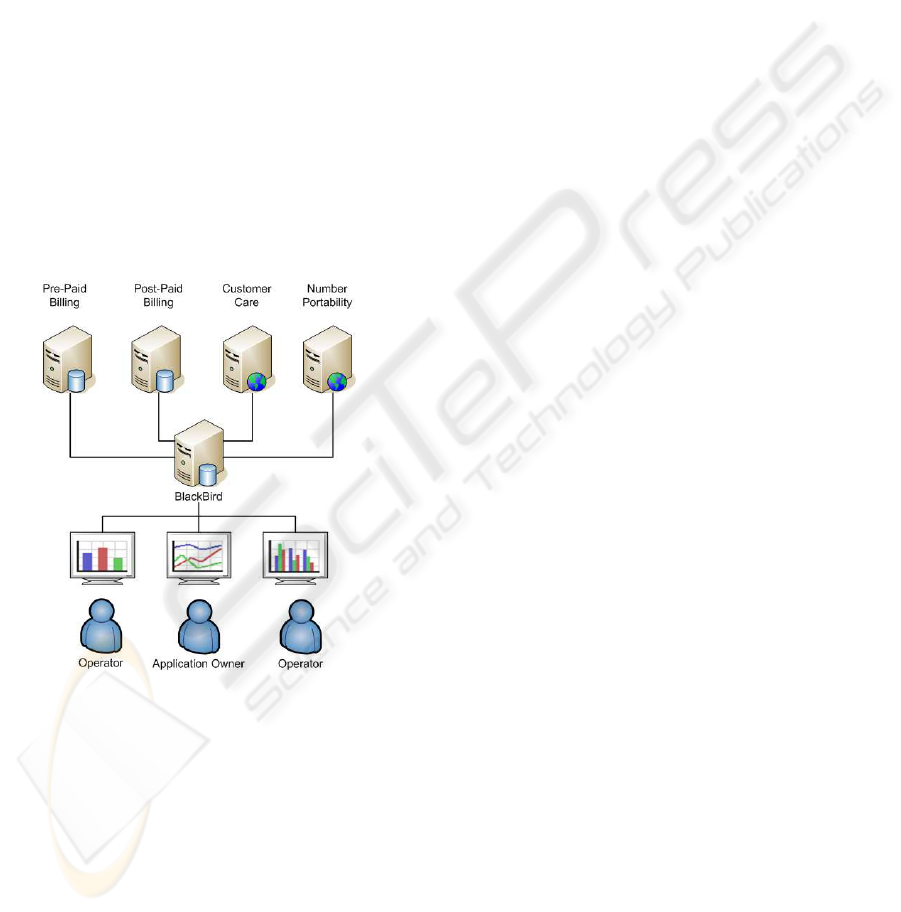
The diagram in fig. 1 represents a general view of the
monitoring system, it obtains data from a number of
servers using different technologies, calculates met-
rics and presents the results to the Operators.
Figure 1: Monitoring System Overview.
1.1 Existing Systems
The need for monitoring systems was born from the
need to assure high availability of the first enterprise
level systems and networks, and as they matured so
did the monitoring systems. Simple Network Man-
agement Protocol (SNMP) (Task-Force, 2007) be-
came the most widely used management protocol and
is currently the base to most network and device man-
agement systems, HP Openview (Hewlett-Packard,
2007) and Nagios (Galstad, 2007). However, due to
the numerous programming languages and the almost
infinite number of architectures and purposes, appli-
cation level monitoring remains an extremely diversi-
fied field with no predominant protocols or method-
ologies.
Application specific systems can provide the best
monitoring of any application. However, develop-
ing dedicated monitoring systems is a costly process
that can only be supported by large companies with a
significant application portfolio, and it becomes im-
possible to combine the monitoring of different ap-
plications working together. Examples of such sys-
tems are Microsoft Operations Manager (Microsoft,
2007). Third party companies will only risk devel-
oping application specific systems for applications
that can guaranty a large user base. Quest Software
provides versions of the Spotlight (Quest-Software,
2007) monitoring system for BEA WebLogic Server,
Oracle, etc. General purpose monitoring systems aim
to provide monitoring services to a range of applica-
tions as wide as possible. For this they will implement
support for standard monitoring technologies and pro-
tocols, and for proprietary protocols used in applica-
tions with a large user base. The option taken by most
companies for adding monitoring capabilities to their
applications is to implement a standard management
technology such as SNMP, JMX or WMI, for integra-
tion with a general purpose monitoring system. One
example is ManageEngine (AdventNet, 2007) from
AdventNet.
In terms of architecture, most monitoring systems
employ a Manager-Agent architecture, there is usu-
ally a central management system and several agents
deployed on the monitored system and relay the ob-
tained data to the central management system using
a protocol such as SNMP (Task-Force, 2007). This
is the architecture that emerged from the first net-
work management systems and is currently used by
all monitoring systems based on the SNMP protocol.
It is especially adequate for monitoring of vast num-
bers of distributed resources such as computer net-
works like Openview (Hewlett-Packard, 2007), Na-
gios (Galstad, 2007) or grid computing systems like
MonALISA (Newman et al., 2003).
As more applications evolved from centralized to
distributed and from raw processing to providing ser-
vices, a new monitoring architecture became possi-
ble, Agentless Monitoring. In this case there is only
a central management system, and all data gather-
ing is accomplished by remote access to the inter-
faces provided by the Monitored Application. Agent-
less Monitoring is usually less intrusive, easier to de-
ploy and does not require continuous development,
but with limited depth of data gathering. Agentless
Monitoring is especially adequate for services based
BLACKBIRD MONITORING SYSTEM - Performance Analysis and Monitoring in Information Systems
47

applications and is the only option for proprietary and
closed source applications. One example of agentless
monitoring system is Longitude (Heroix, 2007) from
Heroix.
Since the first monitoring systems one key ele-
ment of the monitoring process has been application
instrumentation, which consists in modifying the ex-
isting applications in order to collect additional data
during run-time. The importance of application in-
strumentation for the management of complex dis-
tributed application resulted in several technology
level standards like JMX for Java and Java2 Platform
Enterprise Edition (J2EE) and WMI for Microsoft
Products and the Microsoft .NET framework.
1.2 Future Trends
Extensive research has been aimed at improving the
monitoring support of Enterprise Applications, with
the main focus on improving the monitoring exten-
sions provided by the monitored application. Most of
this work is focused on the JMX (Kreger, 2001) tech-
nology which is part of J2SE platform. Although it is
only applicable to Java and the J2SE platform, it has
a close resemblance to the WMI for the .NET frame-
work, and the main concepts are applicable to other
programming languages and architectures, including
legacy applications (Diakov et al., 2000). The use of
standard management architectures and instrumenta-
tion techniques on enterprise applications opens the
way to automated application management and self
managed applications (Diaconescu et al., 2004). All
this research presents a common characteristic, it tar-
gets component based applications, and as a result it
is possible to obtain a good detail of application mon-
itoring.
Whatever the purpose or technology used the
complexity of Enterprise Applications dictates that
the full task to be executed must be split between
simpler tasks, that will be performed by different pro-
gram modules. By considering a definition of Com-
ponent less restrictive than the one usually associated
with Component Based Software it should be possible
to model any application as component based, where
each component may have a number of parameters
that can be used as indicators of the general applica-
tion health and performance. And, by modeling the
application, it should be possible to capture a more
abstract level of application functionality, which is
closer to the business logic and to the main applica-
tion goals of quality of service.
2 REQUIREMENTS
The BlackBird monitoring system must provide five
key features: i) monitor a wide range of applications,
being adaptable to the architecture and technologies
of the Monitored Application; ii) provide in depth ap-
plication level monitoring, component based; iii) eas-
ily adaptable to the evolution of the Monitored Ap-
plication; iv) low impact on the monitored system,
agentless and without additional application instru-
mentation; v) graphic interface for data visualization
and configuration.
The Monitoring Systems referenced in the previ-
ous section are some of the most widely used and
present a representative sample of the existing mon-
itoring solutions. The table 1 summarizes the main
features of these systems. Most of these systems al-
low user defined data gathering, however, the user is
usually required to supply an extensive set scripts for
obtaining data. The BlackBird System requires only
a minimum of information for executing the same
command, handles all data validation and conversion.
Also, the BlackBird System allows the simultaneous
execution of any commands regarded as necessary.
Although most of these system provide some form
of support to user defined Metrics, Metrics based on
different data sources are usually limited to reporting
purposes. The BlackBird System is able to provide
real time Metrics based on any combination of data
sources. From these systems, the ones that provide a
Component Based Monitoring, support only applica-
tions developed using the frameworks J2EE or .NET.
The BlackBird System introduces a simplified Com-
ponent definition for extending the concept of com-
ponent based monitoring to applications that were not
developed as Component Base Applications.
The Blackbird System aims to provide a monitor-
ing service to an application without imposing any
limitations on the target architecture, therefore, the
Blackbird System provides a simplified set of Mon-
itoring Operations that allow a user with detailed
knowledge of the Monitored Application to specify
the required monitoring service: Commands to be
executed where the result will be stored and used to
calculate Metrics; Metrics defined by a formula to be
executed on the stored data to produce a result that
is related to the application’s performance indicators;
Alerts for evaluating thresholds on Metrics and send
notifications; Graphics that use the Metric as a data
source and plot the data according to the type and for-
mat; Pages for containing graphics and structuring the
monitoring interface.
WEBIST 2008 - International Conference on Web Information Systems and Technologies
48
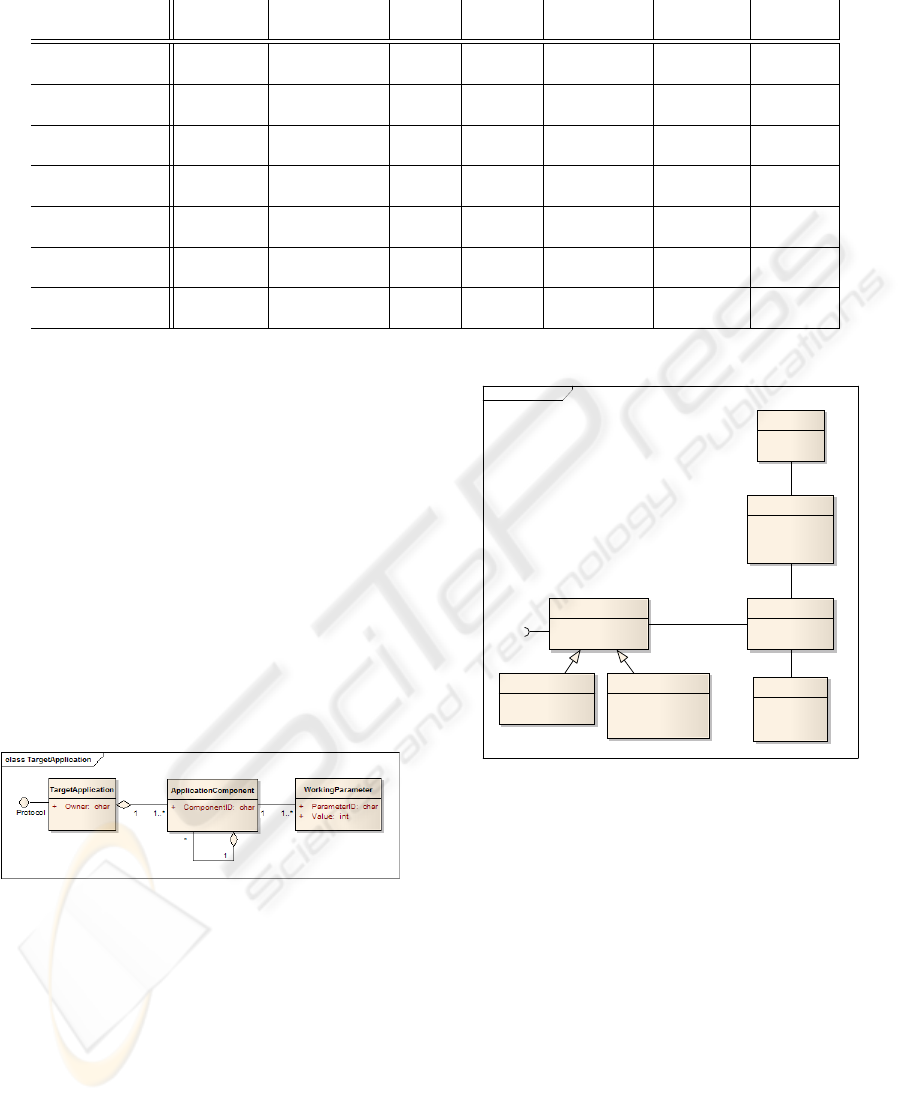
Table 1: Feature Comparison Table.
Targeted Supported Agent Interface User Defined User Defined Component
Systems Protocols Based Data Gathering Metrics Based
HP Openview General SNMP Y Thin Y Y N
Operations Purpose Client
Nagios Network Network services Optional Web Y Y N
and Host
Microsoft Microsoft WMI Y Web Y Y Y
Operations Manager Applications and Client
Spotlight Dedicated JMX Y Thin N N Y
Client
Manage Engine General Multiple Optional Web Y N Y
Purpose
Longitude General Multiple N Web Y Y Y
Purpose
BlackBird General Multiple N Web Y Y Y
Purpose
3 ARCHITECTURE
As proposed in section 1.2, by modeling the Moni-
tored Application as a set of interacting components
it should be possible to obtain a more de detailed
view of the application status and performance, also,
it should be easier to obtain Metrics that relate to
the application performance goals. For the purposes
of this work, we consider a simplified definition of
Application Component: i) executes a well defined
task within the application; ii) can be univocally ref-
erenced; iii) has a set of working parameters which
can be obtained using the application interfaces. Fig-
ure 2 represents the Monitored Application according
to this definition.
Figure 2: Application Model.
Figure 3 presents the high level Domain Model
for the BlackBird System. Each of the required
Monitoring Operations is implemented by a ded-
icated class, except for Commands that is split
between the
Module
class and subclasses dedi-
cated to specific technologies,
DatabaseScript
and
WebserviceRequest
. The
dataStore
attribute of
Module
stores all data produced by the associated
command and provide support to Metrics calculation.
The
Module
sub classes provide an adaptation
layer that isolates the BlackBird architecture from any
technology details, they handle all technology spe-
class Domain Model
Module
+ dataStore: DataStore
Protocol
Metric
+ formula: char
Page
+ layout: char
+ title: char
Graphics
+ datasource: Metric
+ format: char
+ link: char
+ type: int
Alert
+ condition: char
+ message: char
+ state: int
DtabaseScript
+ login: char
+ SQL_statement: char
WebServiceRequest
+ arguments: char
+ login: char
+ method: char
+ WSDL_location: char
+Evaluates *
1
1..*
+Contains 1
+DataSource
1
1
+DataSource
1..* 1
Figure 3: Domain Model.
cific logic like establishing a connection, authentica-
tion, formatting the command, obtaining and validat-
ing the response. Finally, they convert the command
result to a normalized Extensible Markup Language
(XML) document and deliver that document to the
dataStore
. For simplifying Metrics definition and
calculation, the
dataStore
is designed to be accessed
as a relational entity. The
Metric
class provides the
data processing and aggregation functionalities of the
BlackBird System by computing the
formula
spec-
ified in the Monitoring Requirement. The
Graphic
class provides the visual presentation to the
Metric
objects, it will use the output of the
Metric
as a data
source and apply the type of graphic and the format
request in the Monitoring Requirement. A
Graphic
may be a table of values or various chart formats. The
Page
class provides the base for generating the mon-
BLACKBIRD MONITORING SYSTEM - Performance Analysis and Monitoring in Information Systems
49
itoring interface that will be accessed and navigated
by the operators. By combining the information from
the
Page
and
Graphic
objects, the BlackBird system
generates the required interface as an Web Applica-
ton containing the requested charts and tables. The
Alert
class provide automatic notification of perfor-
mance problems. It is defined as boolean condition to
be evaluated.
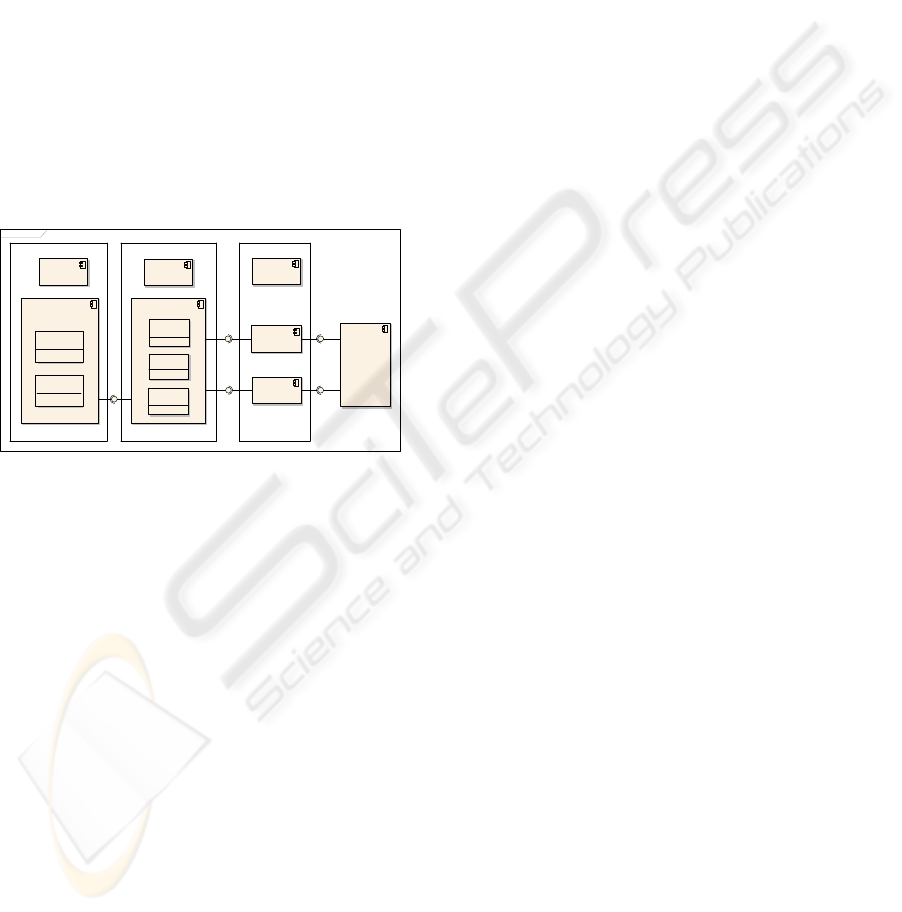
3.1 BlackBird Components
The Blackbird system uses an agentless architecture,
it is composed of an Adaptation Layer itself com-
posed by a variable number local Interface Modules
designed for specific protocols, an Aggregation Layer
that handles data storage and Metrics calculation, and
a Presentation Layer for generating the monitoring
pages and graphics. The Component Diagram of the
BlackBird System is represented in fig. 4.
cmp Architecture
Adaptation Layer
Presentation
Layer
DatabaseScript
Module
WEBSercices
Module
Database
Database::
DataStore
ApplicationServer
ApplicationServer:
Page
ApplicationServer:
:
Graphic
Database::
Metric
ModuleManagerMetricManager
PageManager
Monitored
Application
Agregation Layer
Database::
Alert
JDBC
WEBServiceCall
JDBC
JDBC
JDBC
Figure 4: BlackBird Components.
The Adaptation Layer provides one of the main
features of the BlackBird System, adaptation to the
technologies of the Monitored Application. All tech-
nology and protocol specific processing is performed
by interface modules, where each type of inter-
face module handles a specific technology or proto-
col, performs all the tasks necessary for executing
the requested command, converts the command out-
put to the normalized format and delivers it to the
dataStore
. The Adaptation Layer also performs the
first step for providing a monitoring service adapted to
the architecture of the monitored system. By allowing
multiple
Module
to execute independently it becomes
possible to specify as many data sources as required
for compiling a complete repository of performance
data that will allow the calculation of any relevant
Metrics. The ModuleManager component controls
execution of the Interface Modules and manages the
dataStore
of those objects. For this work only two
modules where developed, an SQL module that uses
JDBC to connect to the monitored Database for exe-
cuting an SQL statement and an Web Services mod-
ule that implements the Apache Axis Framework for
dynamically invoking Web services. These technolo-
gies are base to most of Vodafone applications, and
allow the demonstration of the BlackBird capabilities
in combining data obtained using different technolo-
gies.
The BlackBird architecture is expandable to other
types of protocols. Adding support for aditional pro-
tocols to the BlackBird system requires no changes
to existing components only the development of: i) a
new interface module to handle the required protocol;
ii) two new configuration tables and associated views;
iii) new stored procedures for the edit operations on
the new type of module.
The Aggregation Layer stores all performance
data in an organized an easily accessible form, per-
forms Metrics calculation and alerts verification. The
Aggregation Layer contains the
dataStore
attributes
from all existing
Module
objects implemented as
database tables and views, the combination of all
these objects constitutes a complete repository of all
performance data gathered from the Monitored Appli-
cation. And, since all this data is accessible through
relational queries, it should be possible to implement
any Metric required by the Application Owner. The
Aggregation Layer is responsible for other of the
main features of the BlackBird System, Component
Based Monitoring. Since all performance data gath-
ered from the application can be used as input for
the
Metric
objects, it is possible aggregate the data
collected by different Modules using the component
identifier to produce Metrics that provide a complete
view of all aspects for that Application Component.
The MetricManager component is responsible for cre-
ating and updating the implementation of
Metric
for-
mulas, and actively evaluating alert conditions.
The Presentation Layer is responsible for the final
output of the BlackBird Monitoring System, which
are monitoring pages containing visualizations of the
status and performance of the Monitored Applica-
tion. The monitoring pages are generated from the
Graphic
and
Page
objects and deployed on an Appli-
cation Server as a Web Application. However, the au-
tomated generation of the Web Application was con-
sidered to be out the scope of this work, so the We-
bcockpit (Klauser, 2007) application is used to gen-
erate the monitoring pages based on a configuration
file created by the BlackBird System from the existing
Page
and
Graphic
objects. The
PageManager
com-
ponent is responsible for managing the generation and
deployment of the Web Application that provides the
monitoring interface.
WEBIST 2008 - International Conference on Web Information Systems and Technologies
50
4 IMPLEMENTATION AND
DESIGN
In order to isolate the BlackBird architecture from any
technology details it is necessary to define a normal-
ized format for the results data, this format must be: i)
capable of containing any result; ii) easily convertible
to a relational format. According to the application
model defined in the previous section (fig. 2), and to
support component level monitoring, the output of a
command executed on the monitored system may be
defined as a tree of components each containing any
number of working parameters, including a compo-
nent identifier. According to this definition, any re-
sult may be formatted as a XML document with the
schema from fig. 5.
Figure 5: XML Schema.
Because the BlackBird System is intended for an
enterprise environment where security and role sepa-
ration is always a major concern, for each Monitored
Application there is a dedicated database schema for
contain the implementations of
dataStore Metric
and
Alert
for that application. The BlackBird main
schema presented in fig. 6 is used for controlling the
monitoring process, contains Monitoring Objects def-
initions, and additional entities for implementing ap-
plication separation and access control. The Moni-
tored Application Schema contains the database ob-
jects that implements the
dataStore
and
Metric
.
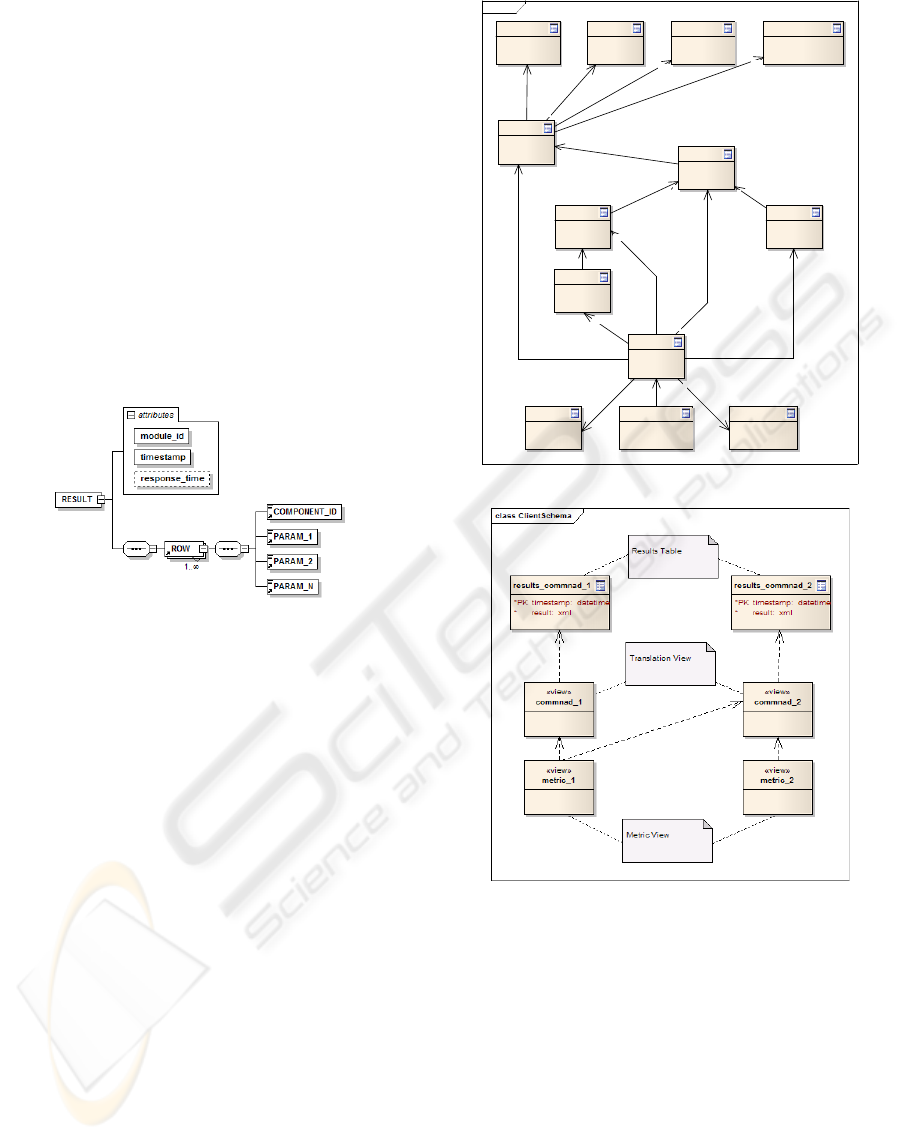
Figure 7 presents an example schema containing the
implementation of two dataStore and two
Metric
ob-
jects.
The final implementation of
dataStore
is com-
posed of a Results Table and a Translation View, re-
sult data is stored XML format in the Results Table,
then based on the format of the XML result the Black-
Bird System creates a view for selecting all XML el-
ements as columns of result set. The complex imple-
mentation of the
dataStore
allows the implementa-
tion of the
Metric
object simply as a database view
created from the SQL
formula
defined in the
Metric
.
The final output of the monitoring process is an
Web application containing charts and tables that pro-
class dbo
alert
application
graphic
metric
module
page
SQL_command SQL_login
application_owner error_messagesoperator
WEBServ _commandWEBServ _login
1..*
1..*
1
1..*
1
0..1
*
0..1
*
0..1
1
0..1
1
1..*
0..*
1
0..1
1
1
*
1
1..*
1
1..*
1
1..*
1
1..*
1
1..*
*
1..*
Figure 6: Main Schema.
Figure 7: Monitored Application Schema.
vide a visual representation of Metrics. From the ex-
isting
Page
and
Graphic
objects, the
PageManager
generates the Webcockpit configuration file that spec-
ifies the contents of the required Web application.
Then, the Webcockpit application is used to gener-
ate the Java Server Pages (JSP) that implement the
required charts and tables.
5 CASE STUDY
The BlackBird System is currently integrated in the
production environment of some of the main appli-
BLACKBIRD MONITORING SYSTEM - Performance Analysis and Monitoring in Information Systems
51

cations of Vodafone Portugal DTSI, Mediation De-
vice (MD), Pre Paid Billing System (PPB), ARBOR
Billing System, Provisioning Agent (PA) and AC-
TIVIS Number Portability. All are Mission Crit-
ical applications that require 24 hour support and
monitoring. The previously existing monitoring sys-
tems, HP Openview Operations and dedicated moni-
toring systems, provide complete network and device
monitoring and a small degree of application level
monitoring. The BlackBird System is used to com-
plement these systems providing detailed application
level monitoring.
5.0.1 Pre Paid Billing System
The PPB application is responsible for lifecycle man-
agement of all pre-paid clients, it was developed at
Vodafone, it contains an Oracle database and was de-
veloped using C and PL/SQL. This example will add
monitoring of recent functionalities of the PPB appli-
cation that have not yet been included in the dedicated
monitoring system.
Recent Business Requirements have introduced
new types of requests, a database table acts as pro-
cessing queue and the processing of each request re-
quires a call to a WebService for confirming current
balance. The main performance criteria for this task
are the average processing time and maximum pro-
cessing time for these requests. For monitoring this
aspect of the PPB application, problems diagnosis and
performance tuning, it would be extremely helpful to
have a line chart presenting the average request exe-
cution time, the average Web Service response time,
and the difference between the two times, which rep-
resents the contribution of the PPB System to the to-
tal processing time. This is a relatively simple ex-
ample, however, the presented parameters have direct
relation to the application performance goal. Further-
more, by splitting the application goal into sub param-
eters, it becomes easier to identify the contribution of
each application component to the final result.
Once the required output is defined, the Applica-
tion Owner must elaborate the Monitoring Require-
ment in order to specify the Configuration Objects
necessary for producing the desired monitoring out-
put. The Monitoring Requirement for this example
contains the following Configuration Objects: i) Lo-
gin details for the PPB database; ii) Login details for
Web Service calls; iii) SQL command for obtaining
the average processing time; iv) Web command for
obtaining the Web Service response time; v) Metric
for combining data from both commands; vi) A line
chart that uses that
Metric
; vii) A page for containing
the the
Graphic
.
The final output of the PPB monitoring example is
shown in fig. 8. This chart shows the evolution of the
Seconds
Figure 8: PPB Queue.
requests processing time and the contributions of the
Web Service call and PPB processing.
In this example the BlackBird System was used
for fast implementation of a detailed monitoring ser-
vice, and to generate Metrics that aggregate data ob-
tained using different technologies, Database access
and Web Services call.
5.0.2 Mediation Device
The Mediation Device processes billing records of all
traffic types, GSM, 3G, GPRS, SMS, etc. It collects
billing records from all Network Elements, validates
and rates billable records. The Mediation Device was
also developed at Vodafone, it contains an Sybase
database and was developed using C and Transact
SQL. The Mediation Device processes various types
of records refereed to as Data Stream, and for each
Data Stream, there are various Network Elements,
this architecture can easily be modeled into compo-
nents. The basic components are the Network El-
ements that have parameters such as current delay
and records processing rate. These elements can be
grouped into the main application components the
Data Streams. The most critical SLA defined for the
Mediation Device are all related to the delay between
record generation on the network element and its de-
livery to the destination billing systems, and the fun-
damental indicator of performance is the number of
records processed per unit of time.
The first chart from fig. 9 shows the evolution of
the delay in Call Records processing for the Network
Element components of the MD application. The sec-
ond char on fig. 9 also shows the evolution of num-
ber of Call Records processed per hour for the Stream
components of the MD.
In this example the BlackBird System was used
to improve the existing monitoring to detail the infor-
mation on the component level, and provide real time
visualization of Metrics directly related to the SLA an
performance indicators.
WEBIST 2008 - International Conference on Web Information Systems and Technologies
52

Figure 9: Mediation Device Streams.
6 CONCLUSIONS AND FUTURE
WORK
The BlackBird System aims to provide detailed ap-
plication level monitoring to a range of applications
as wide as possible, requiring a minimum of con-
figuration work. The use of a simplified application
model creates a language for describing most appli-
cations as a component hierarchy. Also, it allows the
definition of common data format for containing per-
formance information independently of any technol-
ogy details. Data gathering is performed by technol-
ogy specific Interface Modules, where the Applica-
tion Owner may specify any number of modules for
various protocols. This way, it becomes possible to
gather any relevant data independently of the target
architecture or the employed technologies. The per-
formance data is stored in DataStore units accessible
as relational entities. Data can be referenced by spec-
ifying the Module that collected the data and the ap-
plication component it refers to. Based on this data
repository it is possible to create complex metrics that
merge data from multiple sources, and metrics that re-
late to the performance goals for the application.
Although the data repository provides an easily
accessible source of data, it can become very complex
as the number Interface Modules increases. Also, the
task of defining Metrics in the BlackBird system re-
quires a good knowledge of the BlackBird architec-
ture and SQL. This task can be greatly simplified by
the addition of a graphical query building interface, as
an applet on the Configuration Pages or as a separate
application.
The BlackBird was designed as an expandable
System, therefore some of the main improvements
will be new Interface Modules for additional proto-
cols: Remote Shell for access to unix systems, JMX
for J2EE applications, WMI for .NET application.
REFERENCES
AdventNet (2007). Applications Manager.
http://manageengine.adventnet.com/products/
index.html.
Diaconescu, A., Mos, A., and Murphy, J. (2004). Auto-
matic performance management in component based
software systems. Proceedings of the International
Conference on Autonomic Computing.
Diakov, N. K., van Sinderen, M., and Quartel, D.
(2000). Monitoring extensions for component-based
distributed software. Fifth International Conference
on Protocols for Multimedia Systems.
Galstad, E. (2007). Nagios 3.x documentation.
http://nagios.sourceforge.net/docs/nagios-3.pdf.
Heroix (2007). Longitude. http://www.heroix.com/ agent-
less/agentless performance monitoring main.htm.
Hewlett-Packard (2007). HP Operations Dashboard soft-
ware. http://www.managementsoftware.hp.com/
products/ovd/ds/ovd ds.pdf.
Klauser, P. J. (2007). Webcockpit Open Source Project.
http://webcockpit.sourceforge.net/schema/
schema.html.
Kreger, H. (2001). Java management extensions for appli-
cation management. IBM SYSTEMS JOURNAL, 40.
Microsoft (2007). System Center Operations
Manager. http://technet.microsoft.com/en-
us/opsmgr/default.aspx.
Newman, H., I.C.Legrand, Galvez, P., Voicu, R., and
Cirstoiu, C. (2003). Monalisa : A distributed moni-
toring service architecture. CHEP03.
Quest-Software (2007). Spotlight for BEA WebLogic
Server. http://www.quest.com/spotlight-for-bea-
weblogic-server/.
Task-Force (2007). Simple network management pro-
tocol (snmp) applications. ftp://ftp.rfc-editor.org/in-
notes/rfc3413.txt.
BLACKBIRD MONITORING SYSTEM - Performance Analysis and Monitoring in Information Systems
53
