
MODELING UNIT TESTING PROCESSES
A System Dynamics Approach
Kumar Saurabh
Satyam Learning Center, Satyam Computer Services Ltd., Hyderabad, India
Keywords: System Dynamics Modeling, Unit Testing, Stocks, Simulation.
Abstract: Software development is a complex activity that often exhibits counter-intuitive behavior, in that outcomes
often vary quite radically from the intended results. The production of a high quality software product
requires application of both defect prevention and defect detection techniques. A common defect detection
strategy is to subject the product to several phases of testing such as unit, integration, and system. These
testing phases consume significant project resources and cycle time. As software companies continue to
search for ways for reducing cycle time and development costs while increasing quality, software-testing
processes emerge as a prime target for investigation. This paper presents a system dynamics (SD) model of
software development, better understanding testing processes. Motivation for modeling testing processes is
presented along with an executable model of the unit test phase. Some sample model runs are described to
illustrate the usefulness of the model.
1 INTRODUCTION
In general, testing is finding out how well something
works. In terms of human beings, testing tells what
level of knowledge or skill has been acquired. In
computer hardware and software development,
testing is used at key checkpoints in the overall
process to determine whether objectives are being
met. For example, in software development, product
objectives are sometimes tested by product user
representatives. When the design is complete,
coding follows and the finished code is then tested at
the unit or module level by each programmer; at the
component level by the group of programmers
involved; and at the system level when all
components are combined together. At early or late
stages, a product or service may also be tested for
usability.
Unit testing is a software development process
in which the smallest testable parts of an application
called units are individually and independently
scrutinized for proper operation. Unit testing is often
automated but it can also be done manually. This
testing mode is a component of Extreme
Programming (XP), a pragmatic method of software
development that takes a meticulous approach to
building a product by means of continual testing and
revision.
Unit testing involves only those characteristics
that are vital to the performance of the unit under
test. This encourages developers to modify the
source code without immediate concerns about how
such changes might affect the functioning of other
units or the program as a whole. Once all of the units
in a program have been found to be working in the
most efficient and error-free manner possible, larger
components of the program can be evaluated by
means of integration testing.
2 SYSTEM DYNAMICS
INTRODUCTION
SD is a methodology whereby complex, dynamics
and nonlinear interactions in social systems can be
understood and analyzed, and new structures and
policies can be designed to improve the system
behavior. Similarly we can say, SD is a complex
scientific and technological activity, for which is
epistemological and methodological analysis could
suggest some new and interesting perspectives both
to practitioners and theorists of SD The System
models to have the most realistic representational
content possible (Coyle, 1996). There is a great
different between purely Correlation or Statistical
models and SD. The SD models also try to offer
183
Saurabh K. (2008).
MODELING UNIT TESTING PROCESSES - A System Dynamics Approach.
In Proceedings of the Tenth International Conference on Enterpr ise Information Systems - ISAS, pages 183-186
DOI: 10.5220/0001669101830186
Copyright
c
SciTePress
explanation and understanding, not only forecasting
and control.
2.1 Stock or Level Variables
These represent the accumulation of basic variables
or quantities that change in example in a population
model one stock may represent the population of a
country.
2.2 Flow Variables
These variables represent the instantaneous flow
rates. Unlike in physical systems where the rate
variables mostly follow the laws of nature, in
industrial and in many social and socio-economic
systems, which are man – managed, rate variables
often reflect overall policies governing individual
decisions(Dutta, 2001).
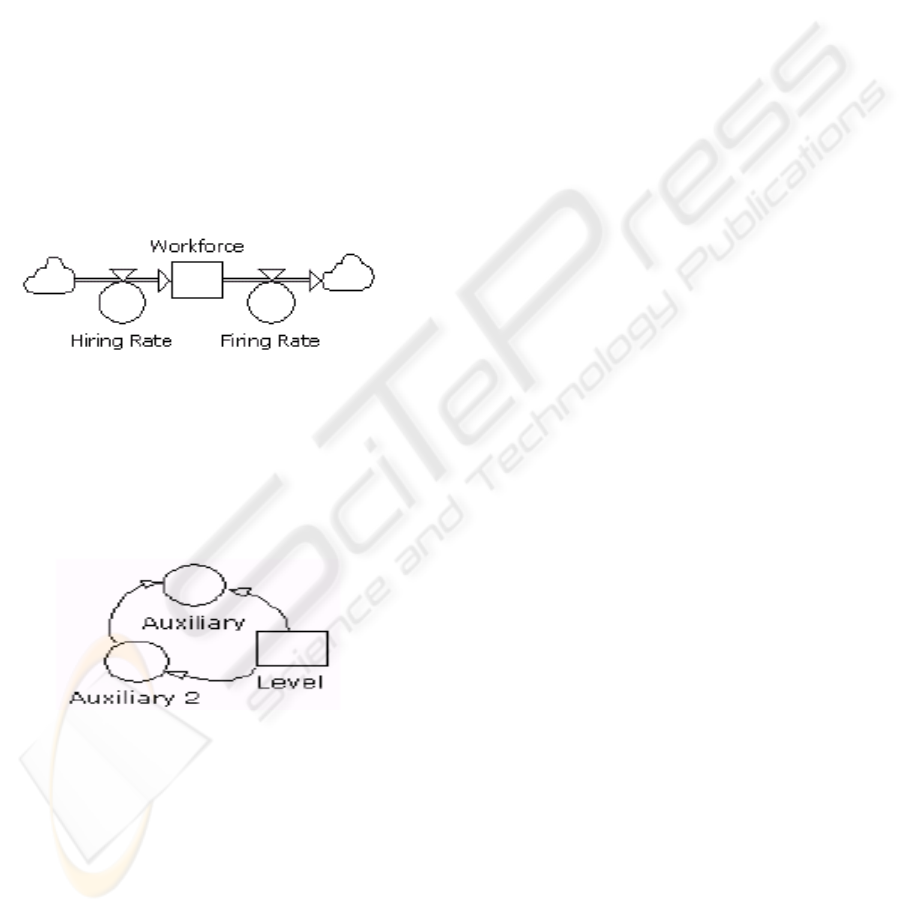
Figure 1: A simple model created in the graphical
modeling language.
2.3 Connectors
A flow represents a physical link between stocks.
However there are also information or dependency
links.
Figure 2: Information links connects various variables.
2.4 Delays
Physical flows quite undergo delays. Examples are,
delays in clerical processing of order mailing of
orders, filling of orders, shipment, training of
unskilled workers, payment of debt and in capacity
installation, etc. These delays have the following
characteristics:
1) A rate variable appearing in a physical flow
undergoes a delay. (2) An accumulation takes place
during the delay. (3) Outflow rate from a delay
depends on the amount accumulated in the delay and
Average time a unit spends inn the delay. (4) During
the study state condition (when the int flow rate is
constant for a long time resulting in a constant
outflow rate), the accumulation in the delay is also
constant and is equal to the product of the inflow
rate and the average delay time constant Exponential
delays have all the above-mentioned characteristics
(Forrester, 1961).
3 MODELING THE UNIT TEST
PHASE
Our initial research efforts in the testing area
focused on modeling the unit test phase. We chose
the unit test phase both because it is the best
understood of the testing phases as well as one of the
most controversial. The controversy in the unit test
phase revolves around the amount of unit testing that
is performed. Although rigorous unit testing is
recommended by many development standards,
individual projects have been completed with
various levels of unit testing dependent upon the
other quality assurance tasks performed and the
difficulty of creating a unit test environment. To
investigate the impact of these various degrees of
unit testing on software development cycle time, we
developed a model of the unit test phase. This model
assumes that the unit test phase begins after clean
compilation and completes when the unit test criteria
have been met and all defects have been fixed. It is
important to note that we view the unit test phase as
including both defect detection and repair. Repair
consists of amending the code to remove the
detected errors and retesting the code to verify the
errors were removed. In order to model the impact
of various unit test strategies, we also include a
defect seepage cost in our model, which addresses
the cost of repairing defects missed by the unit test
phase.
The basic inputs to our model are described below:
ICEIS 2008 - International Conference on Enterprise Information Systems
184
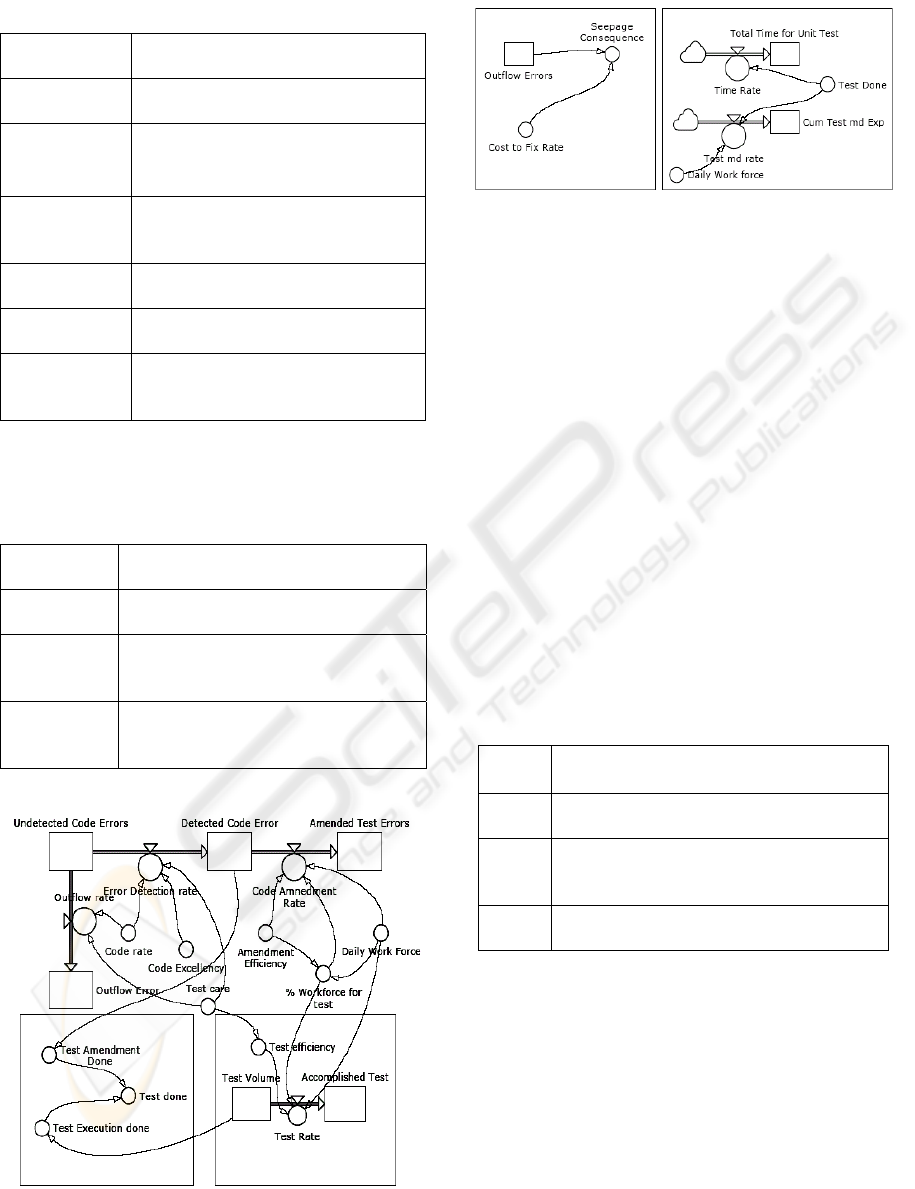
Table 1: Model Input Variables Description on Unit Test.
Variable
Name
Description
Test volume The volume of the unit test activity
measured in lines of code to test
Test care The care of the testing activity
defined as the percentage of defects
detected by the testing
Excellency of
code
Defined as the number of defects per
KLOC which are detectable by the
unit testing
Daily
work force
The number of developers available
for performing unit testing activities
Amendment
efficiency
the number of errors fixed per
developer-day
Cost to fix
later
the number of developer-days needed
in a later test phase to fix an error
missed by unit testing
The model outputs consist of:
Table 2: Model Output Variables Description on Unit
Test.
Variable
Name
Description
Total time
for unit test
Defined as the total number of days
needed to complete the unit test phase
Total cost
for unit test
Defined as the total number of
developer-days needed to complete the
unit test phase
Seepage
consequence
Defined as the number of developer-
days needed to repair the defects not
detected during unit testing
Figure 3: SD Model for Error Detection and Correction for
Unit Test.
Figure 4: SD cost Model of Unit Test.
A simplified view of our SD model is presented in
Figure 3 and 4. The model illustrates code errors
being detected based on an error detection rate
which is dependent upon the testing rate, the
excellency of the code and the care of the testing.
The care of the testing in turn affects the time
needed to perform the testing. The model also
illustrates the rate that detected errors are fixed
which is dependent upon the percentage of
developer time available for defect repairs, the
number of available developers and the amendment
efficiency. Defect seepage is also modeled along
with the increased cost of repairing in later phases
defects, which were not detected by unit testing. To
illustrate the kind of information, which can be
produced by this model, we extracted unit test data
from an engineering organization. Three scenarios
were executed with various levels of unit test care.
The levels of test care were:
Table 3: Levels of Test Care on Unit Test.
Level Description
0.1
Corresponding to very minimal unit
testing
0.7
Corresponding to a level of test care in
which 70% of detectable defects were
detected
1.0
Corresponding to an idealized level of care
in which all defects were detected.
The results for each of the scenarios are presented in
Table 4. To interpret the cost effectiveness of the
unit test activity it is necessary to combine the
columns for
Total Cost for Unit Test and Seepage
Consequence. For this particular organization's
project scenario, the results indicate the benefit of
reducing the unit testing effort.
1. Test Volume: 174,000 assembly equivalent lines
of code
2. Excellency of Code: .39 defects per KLOC
MODELING UNIT TESTING PROCESSES - A System Dynamics Approach
185
3. Daily Work Force: 5 developers available for
performing unit testing activities
4. Amendment Efficiency: 8 errors fixed per
developer-day
5. Cost to Fix Later: 0.36 developer-days needed to
fix an error missed by unit testing in a later test
phase.
The results for each of the scenarios are presented in
Table 4. To interpret the cost effectiveness of the
unit test activity it is necessary to combine the
columns for Total Cost for Unit Test and Seepage
Consequence. For this particular organization's
project scenario, the results indicate the benefit of
reducing the unit testing effort.
This can be explained by the low cost to fix a
defect not detected during unit testing as determined
by the metrics input to the model. Obviously these
results will not apply to all projects since variations
of the input parameters will significantly alter the
Total Cost for Unit Test and Seepage Consequence.
For instance, when the cost to fix a defect not
detected during unit testing is 1.0 error per
developer-day a test.
This can be explained by the low cost to fix a
defect not detected during unit testing as determined
by the metrics input to the model. Obviously these
results will not apply to all projects since variations
of the input parameters will significantly alter the
Total Cost for Unit Test and Seepage
Consequence.For instance, when the cost to fix a
defect not detected during unit testing is 1.0 error
per developer-day a test care goal of 0.7 results in a
lower overall cost.
Table 4: Results of varying test care on Unit Test.
Test
Care
Total Time
For Unit
Test
Total Cost
For Unit Test
Seepage
Consequence
0.1 8.5 42.5 22.3
0.7 12.2 61.2 7.3
1.0 50.0 250.0 0.0
4 CONCLUSIONS
The development of our unit test phase SD model
has increased our understanding of unit testing and
defect repair activities and their relationships. The
model provides a framework for interpreting testing
metrics and analysing areas for optimizing testing
processes. We are currently in the process of
calibrating our testing model with actual industry
metrics in order to provide projects with guidance on
selecting their testing strategy. Our future plans are
to expand our modeling to include the integration
and system test phases. Our testing models will then
be integrated with our incremental software
development SD model in order to more accurately
assess the impact of testing activities in an
incremental development environment.
REFERENCES
Coyle, R.G. 1996. System dynamics modelling: A
practical approach. London: Chapman and Hall.
Dutta, A. 2001. Business planning for network services: A
systems thinking approach.Information Systems
Research 12(3): 260-28.
Forrester, J.W. 1961. Industrial dynamics. MIT Press.
Mohapatra, P.K.J., Mandal, P. and Bora, M.C. 1994.
Introduction to system dynamics modelling.
Hyderabad: Universities Press.
ICEIS 2008 - International Conference on Enterprise Information Systems
186
