
AN ENHANCED SYSTEM FOR PATTERN RECOGNITION AND
SUMMARISATION OF MULTI-BAND SATELLITE IMAGES
Hema Nair
C.T.R.F., 813, 7
th
Main, 1
st
Cross, HAL 2
nd
Stage, Bangalore 560008, India
Keywords: Data mining, pattern recognition, image analysis, feature extraction, blackboard component, linguistic
summary, intelligent system.
Abstract: This paper presents an enhanced system developed in Java
®
for pattern recognition and pattern
summarisation in multi-band (RGB) satellite images. Patterns such as island, land, water body, river, fire,
urban settlement in such images are extracted and summarised in linguistic terms using fuzzy sets. Some
elements of supervised classification are utilised in the system to assist in the development of linguistic
summaries. Results of testing the system to analyse and summarise patterns in SPOT MS images and
LANDSAT images are also discussed.
1 INTRODUCTION
Data mining includes a broad spectrum of processes
and techniques that analyse raw data to discover
implicit patterns that are useful for decision-making.
Pattern recognition is considered as another form of
data mining because both focus on the extraction of
information or relationships from data. All data
mining techniques are not universally applicable to
all types of multimedia. A particular data mining
technique may be successful with one type of
multimedia such as images, but the same technique
may not be well suited to many other types of
multimedia due to varying structure and content.
In (Zaine et al., 1998), the objective is to mine
internet-based image and video. The results
generated could be a set of characteristic features
based on a topic (keyword), a set of association rules
which associate data items, a set of comparison
characteristics that contrast different sets of data, or
classification of data using keywords. From another
perspective, (Barnard et al., 2003a), (Barnard et al.,
2003b) describe the approach involved in matching
images to text. Their work describes models used for
automatic image annotation, browsing support and
auto-illustration of blocks of text. Such models are
focussed on prediction of words (from an available
pool) that match with specific image regions. At this
juncture, a comparison is made with some other
commercially available software that has similar
functionality. Definiens
®
eCognition (Definiens
Industrial Profile, 2001) is based on object-oriented
image analysis. Some rules for pattern classification
are employed by the tool. Contextual information
and data are used as input for this process.
Definiens
®
Professional (Definiens, 2006) works
with panchromatic, multi/hyper-spectral imagery,
infrared, and polarimetric SAR data from space-
borne and air-borne imaging platforms.
A system that classifies and summarises patterns
such as water body, river, land, island, and fire, was
described in (Nair, 2004). The system utilised fuzzy
logic to describe these patterns. (Nair, 2006)
introduced some significant changes to the system.
A few of these changes have been implemented in
C.T.R.F’s
LSGENSYS. LSGENSYS (Linguistic
S
ummary Generation System) draws upon the
earlier techniques of utilising fuzzy logic, but also
adds a new significant element of user interaction
via the blackboard architecture component
(described in Section 2). This paper is organised as
follows. Section 2 explains the architecture and
design of the system. Section 3 explains the
methodology and approach. Section 4 presents
results of testing the system for image analysis,
pattern recognition and summarisation on
LANDSAT and SPOT MS satellite images. Section
5 presents the conclusions and future work.
5
Nair H. (2008).
AN ENHANCED SYSTEM FOR PATTERN RECOGNITION AND SUMMARISATION OF MULTI-BAND SATELLITE IMAGES.
In Proceedings of the Tenth International Conference on Enterprise Information Systems - AIDSS, pages 5-10
DOI: 10.5220/0001670000050010
Copyright
c
SciTePress

2 SYSTEM ARCHITECTURE
This paper presents an enhanced version of
LSGENSYS (Nair, 2007). LSGENSYS is an
integrated system that allows the user to analyse
images, extract feature descriptors such as area,
length, location etc of patterns and then use these
descriptors to form linguistic summaries of these
patterns. This system also provides an interactive
environment, wherein, the user may suggest some
possible linguistic summaries for the image patterns.
The system would evaluate the fitness of these user-
summaries. Alternately, the system could, without
user intervention, generate some possible summaries
and evaluate their fitness and suitability with respect
to the image patterns.
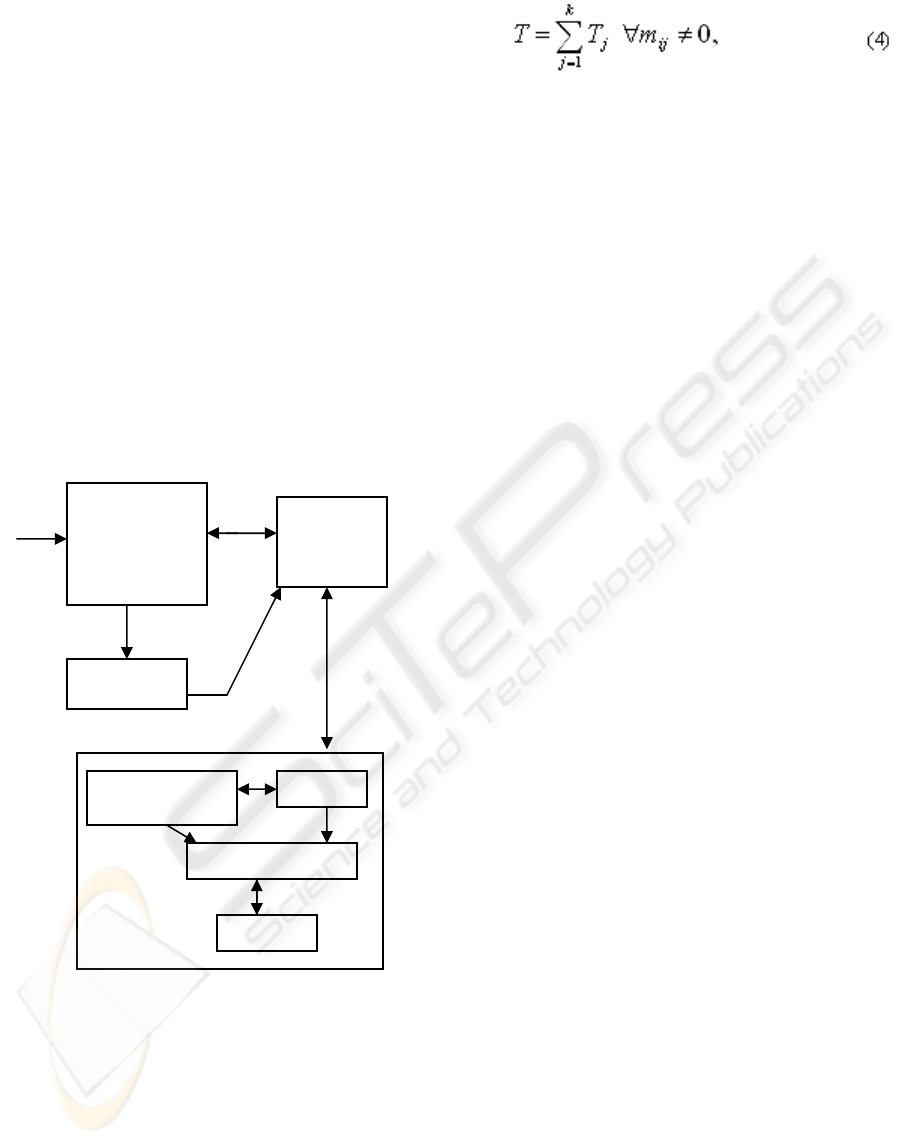
The system architecture is shown in Figure 1.
The input image is analysed and some feature
descriptors extracted. These descriptors are stored
thereafter in a relational table in the database. The
blackboard holds the current state in the process of
developing summaries. The user has the choice of
suggesting concepts such as descriptions of area,
length, location of patterns etc. The knowledge base
uses geographic facts to define feature descriptors
using fuzzy sets. It interacts with a built-in library of
linguistic labels, which also interacts with the
summariser as it supplies the necessary labels to it.
The summariser receives input from these
components and performs a comparison between
actual feature descriptors of the image patterns
stored in the database, the concepts suggested by the
user, and the feature definitions stored in the
knowledge base. After this comparison, the
summariser uses the linguistic labels supplied by the
library to formulate some possible summaries for
each pattern/object in the database. These summaries
are stored in the blackboard. From among these
summaries, the most suitable one describing each
pattern is selected by interaction with the engine
(genetic algorithm). As the GA evolves through
several generations, it generates better summaries
(indicated by higher fitness, as defined in Section 4)
which are then stored and indicated on the
blackboard. Thus, the system includes some
elements of supervised classification and
summarisation. The following set of rules is
developed to perform pattern classification and
identification in multi-band satellite images.
1. If a pattern/object is to be classified as an
island, it should have a water envelope
surrounding it such that it has a uniform band
ratio at at least eight points on this envelope
(corresponding to directions E, W, N, S, NE,
NW, SE, SW). Also grey level values on the
envelope could be lower than the grey level
values on the object.
2. If an object does not have an envelope in all
directions as described in rule (1) above, then
it is classified as land.
3. If an object is to be classified as water body
(expanse of water, river), it is necessary that
it should have a uniform band ratio.
4. Fire is classified as a separate pattern. It is
identified by applying colour density slicing
to the image and by viewing the histogram of
the affected area. The histogram would show
a majority of pixels at lower intensity for the
burnt scar area near the fire.
5. The enhanced system presented in this paper
includes the capability to recognise and
summarise urban settlements in an image.
This new rule for classification is described
as follows. Urban settlements are classified
based on their shape and their grey level
intensity. In this paper, an attempt is made to
identify only rectangular and circular-shaped
urban settlements. The shape ratio (defined as
ratio of the area of the urban settlement to the
area of the bounding rectangle or bounding
circle, as the case may be, provided both
shapes equal in perimeter or circumference)
is a major parameter in this classification
process. Shape ratio closest to a value of 1 is
ideal. The grey level intensity (closeness to
white colour, where the triplet (R,G,B) =
(255,255,255), for urban settlement) is
another parameter used in this process.
(Younes et al., 2004) provided the basis for
the development of this criterion. A
percentage of accuracy is calculated (Section
4) and associated with this classification. No
attempt is made to describe the size of the
urban settlement.
The summaries generated by the system for patterns
such as land, island, water body, and river are also
more descriptive as shown in Section 4.
3 APPROACH
The attributes of patterns that are used to develop
their linguistic summaries are area, length, location
(X, Y pixel co-ordinates of centroid of pattern in
image), Additional Information or Pattern Id, grey
level intensity, and Shape Id. These attributes are
calculated /extracted automatically by the GUI tool.
ICEIS 2008 - International Conference on Enterprise Information Systems
6
The linguistic summary of patterns/objects is
evaluated as follows.
If
p21
y,...y,yY = (1)
then
truth(y
i
isF)=μ
F
(y
i
):i=1,2,...,p, (2)
where μ
F
(y
i
) is the degree of membership of y
i
in the fuzzy set F and 0 ≤ μ
F
(y
i
) ≤ 1. The linguistic
proposition y
i
is F could be instantiated as for
example, Island is moderately large.
In order to generate such summaries, it is
necessary to formulate fuzzy sets that quantify
area/length attributes of the object/pattern.
Triangular and trapezoidal fuzzy sets (totally twenty
nine sets) have been formulated. The linguistic
description is calculated as follows:
njj2j1j
m...mmT ∧∧=
, (3)
Image
Figure 1: System architecture.
where m
ij
is the matching degree (Kacprzyk,
Ziolkowski, 1986) of the ith attribute in the jth tuple.
m
ij
∈[0,1] is a measure of degree of membership of
the ith attribute value in a fuzzy set denoted by a
fuzzy label. The logical AND (∧) of matching
degrees is calculated as the minimum of the
matching degrees (Kacprzyk, Ziolkowski, 1986).
T in equation (4) is a numeric value that represents
the truth of a possible set of summaries of the k
objects in the database. The next section discusses
how the GA evolves the most suitable linguistic
summary for all the objects by maximising T.
4 IMPLEMENTATION ISSUES
This section explains the implementation of the
system, including the genetic algorithm approach
and then discusses the results from applying this
approach to analysing images.
4.1 GA Approach
Genetic algorithms are derived from the theory of
evolution. Biological evolutionary theories are
emulated by the genetic algorithm (GA) as it
attempts to solve optimisation problems (Filho et al.,
1994), (Goodman, 1996), (Smith et al., 1994). Each
binary chromosome string in a population represents
a possible linguistic summary for a pattern. Such a
population of strings is manipulated by selection,
cross-over and mutation operators in the GA (Filho
et al., 1994) such that as the GA evolves through
several generations, only those strings with highest
fitness survive. The evaluation or fitness function for
the linguistic summaries or descriptions of all
objects in the table is
f=max(T), (5)
where T is evaluated as shown in the previous
section.
4.2 Results and Discussion
Image objects/patterns are classified at the highest
level into land, water or fire. Land is further
classified into island and other land. Water is further
classified into river and other water body. Urban
settlement is a pattern that can be identified on land
or island. The fuzzy sets that quantify area or length
are defined with reference to geographic facts such
as:
• Largest continent is Asia with area of
44579000 km
2
• Largest freshwater lake is Lake Superior
with area of 82103 km
2
Image Analysis
&
Feature
Extraction GUI
Tool
Database
Blackboard
architecture
Knowledge base
Librar
y
Summarise
r
En
g
ine
AN ENHANCED SYSTEM FOR PATTERN RECOGNITION AND SUMMARISATION OF MULTI-BAND
SATELLITE IMAGES
7
• Smallest continent is Australia/Oceania
with area of 7687000 km
2
• Longest river is the Nile with length 6669
km
In (6), the triangular fuzzy set for considerably large
expanse of water is shown. The triangular fuzzy set
for fairly large expanse of water is shown in (7).
waterof expanse largely considerab
μ
(x)=1-(55068.66-x)/27034.33,
for 28034.33≤x≤55068.66
=1-(x-55068.66)/27034.33,
for 55068.66≤x≤ 82103
=0, x< 28034.33
=0, x> 82103 (6)
waterof expanse largefairly
μ
(x)=1-(1000-x)/900, for 100≤x≤1000
=1-(x-1000)/27034.33, for 1000≤x≤ 28034.33
=0, x< 100
=0, x> 28034.33 (7)
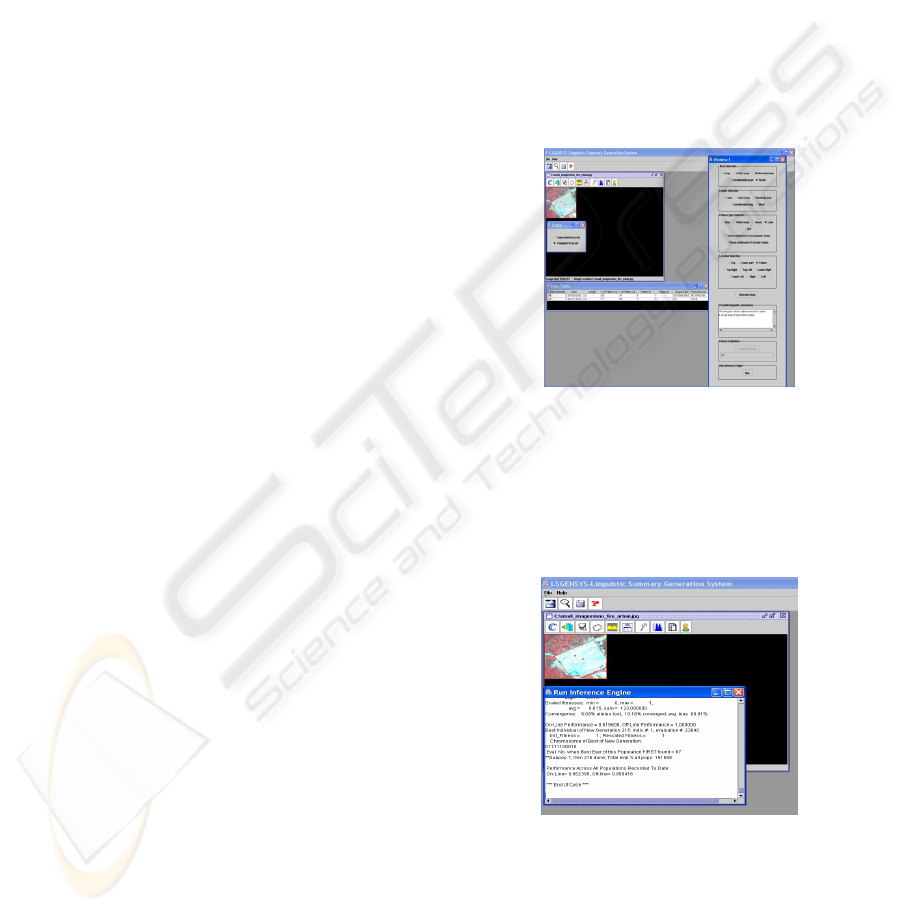
An example SPOT MS satellite image to be
analysed is shown in Figure 2. Figure 2 shows the
image analysis tool of the system as it extracts the
area attribute of two patterns in the image. These
attributes are calculated and displayed in the data
table in the figure. Pattern id attribute denotes
numbers as follows: 0= River, 1=Water Body,
2=Island, 3=Land, 4=Fire, 5 = Urban settlement. For
urban settlements, Shape ID = 1 indicates an
approximately rectangular urban settlement, and
Shape ID = 2 indicates an approximately circular
urban settlement. Location is indicated by X, Y pixel
co-ordinates of centroid of pattern/object. For river,
its length is the most significant attribute for
calculation, whereas for all other patterns, area is the
most significant attribute for calculation.
The user may choose, at this stage, to interact
with the system and suggest some possible
summaries. The system can evaluate the fitness of
the user-summaries and inform the user if they are
most suitable to describe the image patterns in the
table. After the user chooses triangular fuzzy sets in
the knowledge base, the system displays triangular
fuzzy set definitions in order to guide the user to
select the appropriate fuzzy set for area or for length
of different patterns such as land, island, water body,
river etc. With the aid of these fuzzy set definitions,
the user then constructs some possible pattern
summaries as shown in Window 1. The fitness value
(1.0) of these possible summaries is calculated and
displayed in Window 1. Thereafter, the user may
verify the correctness of these summaries and their
suitability with respect to the image patterns by
running the GA Inference Engine.
Figure 3 shows a snapshot of the GA Inference
Engine as it runs (in the bottom left window) and
evolves the most suitable summaries with higher
fitness, over several generations. The summaries
generated by the engine are captured in a text file as
displayed in the top right window of Figure 4. The
user may also chose to bypass the summary
construction process, and directly invoke the
inference engine (by pressing the Run button in
Figure 2) to construct and generate the most suitable
summaries. This would resemble automatic
classification and description.
Figure 2: The image analysis tool of the system as it
extracts area of patterns in a SPOT MS image.
Approximate scale of image 1: 0.0003764.
The GA is run with following input parameter set.
These parameter values are set after several trial
runs.
Figure 3: Snapshot of the GA Inference Engine as it runs
and evolves the most suitable summaries that fit all the
patterns extracted from the image.
No: of bits in a chromosome string of the
population = 11
Generations per cycle = 27
Population size = 200 strings
ICEIS 2008 - International Conference on Enterprise Information Systems
8
Probability of cross-over = 0.545
Probability of mutation = 0.001
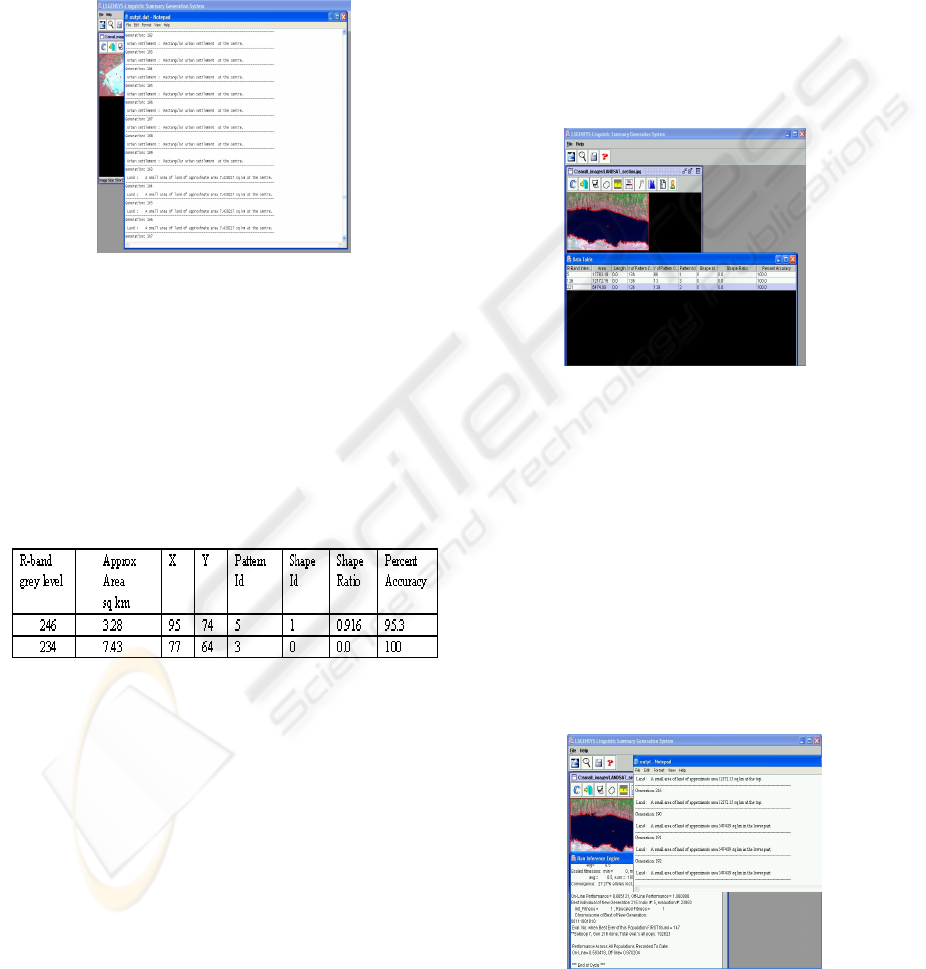
After 216 generations, the linguistic summaries
generated for the data in Table 1 are:
• Rectangular urban settlement at the centre
• A small area of land of approximate area
7.428217 sq km at the centre
Figure 4: Snapshot of some of the final summaries
generated by the GA Inference Engine.
Table 1 also shows the percentage accuracy of
the classification of the patterns, as per the rules of
classification in Section 2.
Thus, the possible summaries formulated by the
user compare well with the summaries generated by
the inference engine.
Table 1: Data calculated from image in Figure 2.
Figure 5 and Figure 6 show the same procedure as
applied to a LANDSAT image. Table 2 shows the
data calculated from the image patterns. From the
image in Figure 5, the system evaluates the fitness of
the summaries formulated by the user. In this case,
the fitness value calculated is 0.8736. The user-
formulated summaries are:
• A moderately large expanse of water at
the centre
• A small area of land at the top
• A small area of land in the lower part
The GA Inference Engine is invoked by the user to
verify and validate the suitability of the possible set
of summaries. The resulting summaries from the
inference engine are enumerated below. The GA is
run with the same input parameter set as before, with
the exception that cross-over probability is set to
0.548.
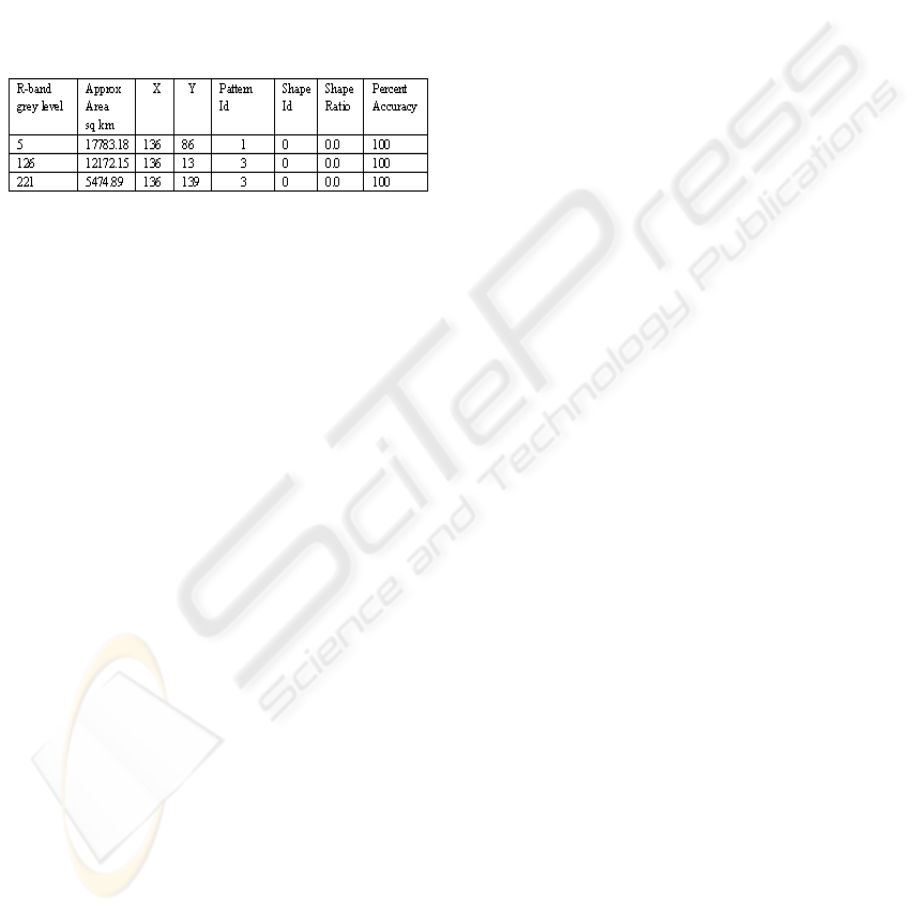
After 216 generations, the linguistic summaries
generated for the data in Table 2 are:
• A small area of land of approximate area
12172.15 sq km at the top
• A small area of land of approximate area
5474.89 sq km in the lower part
• A moderately large expanse of water of
approximate area 17783.18 sq km at the
centre.
These summaries match the user-formulated
summaries.
Figure 5: A LANDSAT image is analysed by the system.
Approximate scale of image is 1: 0.952 sq km.
5 CONCLUSIONS AND FUTURE
WORK
This paper has presented an enhanced system
developed in Java for image analysis and pattern
recognition in multi-band satellite images. The
system architecture and design have been described.
The system has been tested successfully with a
SPOT MS image and a LANDSAT image and the
results have been presented and discussed.
Figure 6: For the image in Figure 5, the GA is run and
summaries generated are displayed in top right window.
AN ENHANCED SYSTEM FOR PATTERN RECOGNITION AND SUMMARISATION OF MULTI-BAND
SATELLITE IMAGES
9
Some directions of future work include:
• Adding a scripting feature that allows the
user to program a sequence of image
analysis instructions in a user-friendly
language
• Adding the provision to upload ground
data in order to help classify more patterns
such as vegetation in satellite images using
supervised classification techniques
• Adding enhancements to image analysis
functions.
Table 2: Data calculated from image in Figure 5.
REFERENCES
Barnard, K., Duygulu, P., Forsyth, D., De Freitas, N., Blei,
D.M., Jordan, M.I., 2003a. Matching words and
pictures. Journal of Machine Learning Research, Vol
3, pp. 1107-1135.
Barnard, K., Duygulu, P., Forsyth, D., 2003b. Recognition
as translating images into text. Internet Imaging IX,
Electronic Imaging.
Definiens Industrial Profile, 2001. Definiens Imaging
GmbH: Object Oriented Classification and Feature
Detection. In IEEE Geoscience and Remote Sensing
Society Newsletter.
Definiens, 2006. Definiens Professional Product Sheet:
http://www.definiens.com .
Filho, J.L.R., Treleaven, P.C., and Alipi, C., 1994. Genetic
Algorithm programming environments. In IEEE
Computer, pp. 28-43
Goodman E.D., 1996. An Introduction to Galopps-the
Genetic ALgorithm Optimized for Portability and
Parallelism System(Release 3.2). Technical Report
No. 96-07-01, Genetic Algorithms Research and
Applications Group, Michigan State University.
Kacprzyk, J., Ziolkowski, A., 1986. Database queries with
fuzzy linguistic quantifers. IEEE Transactions on
Systems, Man and Cybernetics, pp. 474-479.
Nair, H., 2004. A system for interpretation and description
of some patterns in images. International Journal of
Computational Intelligence, 1(4), pp. 368-373.
Nair, H., 2006. Development of summaries of certain
patterns in multi-band satellite images. In
Proceedings of 8
th
International Conference on
Enterprise Information Systems, pp. 278-284.
Nair, H., 2007. LSGENSYS- An integrated system for
pattern recognition and summarisation of multi-band
satellite images. In Proceedings of 9
th
International
Conference on Enterprise Information Systems, pp.
478-482.
Smith, R.E., Goldberg, D.E., Earickson, J.A., 1994. SGA-
C:A C-language implementation of a Simple Genetic
Algorithm. TCGA Report No.91002.
Younes, A.A., Truck, I., Akdag, H., Remion, Y., 2004.
Image classification according to the dominant colour.
In Proceedings of 6
th
International Conference on
Enterprise Information Systems, pp.505-510.
Zaine, O.R., Han, J., Ze-Nian, L., Chee, S.H., Chiang,
J.Y., 1998. MultimediaMiner : A System Prototype
for Multimedia Data Mining. In Proceedings of ACM-
SIGMOD International Conference on Management of
Data (SIGMOD ’98).
ICEIS 2008 - International Conference on Enterprise Information Systems
10
