
AN EXTREME PROGRAMMING RELEASE PLAN THAT
MAXIMIZES BUSINESS PERFORMANCE
Marcelo C. Fernandes, Antonio Juarez Alencar
Institute of Mathematics, Federal University of Rio de Janeiro, P.O. 68530, Rio de Janeiro, Brazil
Eber Assis Schmitz
Electronic Computer Center, Federal University of Rio de Janeiro, Rio de Janeiro, Brazil
Keywords:
XP, release planning, project management and business performance.
Abstract:
This paper proposes a multi-criteria method to evaluate the value of XP release plans to business. The method,
which is based upon information economics and stochastic modeling, helps XP practitioners to select the
release plan that maximizes business performance, with considerable consequences for the use of information
technology as a competitive advantage tool.
1 INTRODUCTION
eXtreme Programming (XP) is the most well-known
and the most used of the many agile methodologies
available (Noble et al., 2004). It best fits circum-
stances where neither the software customers nor the
development team are sure about how the software
should be built. In these circumstances, as presented
in the Agile Manifesto (Beck et al., 2001), XP en-
courages the continuous alignment of development
goals with the needs and expectations of software
customers. Note that this approach differs substan-
tially from the initial fixed plan suggested by tra-
ditional methodologies (Jayaswal and Patton, 2006).
For XP practitioners (developers and software cus-
tomers) software development plans are just well-
intended estimates of what should be done in the im-
mediate future. Therefore, they should be revised fre-
quently (Beck and Fowler, 2000).
Building a release plan is one of the first and
most important tasks of the XP software development
process. To organize the activities that should take
place prior to the next software release the develop-
ment team does the following: estimates how long
it will take to build each story, assesses the release
velocity
1
, warns software customers about technical
risks and provides them with an overall budget. Also,
1
How many manhours are available to be spent in each
release.
software customers help to specify and prioritize sto-
ries and define their business value (Beck et al., 2001;
Beck and Fowler, 2000). It is a joint effort between
software customers and the development team requir-
ing the involved parties to be collaborative, repre-
sentative, committed, knowledgeable and have the
necessary decision powers to reach a consensus by
negotiation (Boehm and Turner, 2004). These re-
quirements create a pluralist and complex decision-
making environment due to the diverse backgrounds,
attitudes, goals, and cognitive dispositions of soft-
ware customers and software development profes-
sionals(Cavaleri and Obloj, 1993).
This environment is particularly difficult to soft-
ware developers accustomed to solitary computer-
related activities, where the ideas of shared learning,
reflection workshops, collaborative decision making,
business opportunities, value, risk and strategy may
be overwhelming. Not to mention the difficulties fre-
quently faced by laymen customers in determining
what can and cannot be technically achieved. All
of this makes the selection of a release plan a chal-
lenging task, especially with the vague requirements
and uncertain environment that are frequently associ-
ated with the development of complex systems (Nerur
et al., 2005).
This paper presents a more realistic decision mak-
ing me-thod to be used in the eXtreme Programming
Release Planning phase. The method helps XP prac-
titioners to select the release plan that maximizes the
12
C. Fernandes M., Juarez Alencar A. and Assis Schmitz E. (2008).
AN EXTREME PROGRAMMING RELEASE PLAN THAT MAXIMIZES BUSINESS PERFORMANCE.
In Proceedings of the Tenth International Conference on Enterprise Information Systems - ISAS, pages 12-22
DOI: 10.5220/0001670100120022
Copyright
c
SciTePress

business performance from a multi-criterion point of
view. The paper starts by considering multiple fea-
sible release plans as proposed by Li et al. in (Li
et al., 2006). Then it extends Li’s model to allow it to
deal properly with uncertainty. Subsequently, in the
same fashion, information economics, as described
by Parker et al. in (Parker et al., 1988), is extended to
link business performance to software development in
an uncertain environment.
The remainder of this paper is organized as fol-
lows. Section 2 presents a review of both information
economics and the release plan strategy presented by
Li et al. Section 3 introduces the method proposed in
this paper with the help of a case study. Section 4 for-
malizes the proposed method. Section 5 discusses the
implications of the method for different dimensions
of XP management. Finally, Section 6 presents the
conclusions of this paper.
2 LITERATURE REVIEW
2.1 Information Economics
Information Economics (IE) is a multi-criterion ap-
proach to the evaluation of IT investments conceived
in the IBM Research Center at Los Angeles and
Washington State University by Parker et al. (Parker
et al., 1988) in the 1980’s and later perfected by
Parker (Parker, 1995). In the information economics
paradigm the evaluation of an IT investment takes into
account two different dimensions: the first concerns
the impact of the project on the business itself and
the second on IT. In formal terms, given an IT related
project P and the weights w
1
, w
2
, ··· , w
10
:
Value(P) = BB
P
+ ITB
P
− BR
P
− ITR
P
(1)
where
• BB
P
, the business benefits, reflects the benefits to
a business directly yielded by investing in P;
• ITB
P
, the information technology benefits, ex-
presses the benefits to information technology
yielded by the investment;
• BR
P
, the business risk, represents the risk incurred
by a business as a result of making the investment;
and
• ITR
P
, the information technology risk, is a mea-
surement of the risk concerning the IT aspects of
P.
The business benefits yielded by investing in
project P, BB
P
, is the weighted sum of five different
value factors, i.e.
BB
P
= w
1
× ROI
P
+ w
2
× SM
P
+ w
3
× CA
P
+
w
4
× MI
P
+ w
5
× CR
P
where
• ROI
P
, the return on investment, is the ratio of
money gained or lost by investing in P in the
course of time;
• SM
P
, the strategic match, is the valueyielded from
directly supporting the implementation of existing
business strategies;
• CA
P
, the competitive advantage, is the value that
stems from creating a new business strategy, a
new service or product, or a new approach to over-
coming a competitive barrier;
• MI
P
, the management of information, is the value
derived from information support to one or more
critical success factors of an enterprise or line of
business; and
• CR
P
, the competitive response, reflects IT
projects intended to catch up with competition.
In turn, ITB
P
is the result of w
6
× SA
P
, where
SA
P
, the strategic architecture, indicates the degree of
alignment of the investment with the overall IT strat-
egy (the IT blueprint).
The business risk BR
P
is the result of w
7
× OR
P
,
where OR
P
is the organizational risk, i.e. the degree
to which the organization is capable of implement-
ing the changes required by the project. Components
of the capacity of implementing such changes should
include: management support, maturity in the use of
computers and a realistic assessment of the business
functions, and processes that have to be modified to
complete the project successfully.
Finally, the IT risk ITR
P
is the weighted sum of
three risk factors:
ITR
P
= w
8
× DU
P
+ w
9
× TU
P
+ w
10
× IR
P
where
• DU
P
, the definitional uncertainty, is a measure of
the degree to which requirements have been prop-
erly elici-ted and specified. It also assesses the
probability of nonroutine changes;
• TU
P
, the technical uncertainty, indicates the readi-
ness of the technology domain to undertake the
project. For example, are the technical skills re-
quired by the project readily available or can they
be easily obtained? Are the hardware dependen-
cies easily overcome? Are there difficult software
interconnectivity problems to be resolved? Etc.;
• IR
P
, the infrastructure risk, assess the nonproject
investment necessary to accommodate the project
itself, such as: faster and more reliable forms of
communication, improved methods of data access
AN EXTREME PROGRAMMING RELEASE PLAN THAT MAXIMIZES BUSINESS PERFORMANCE
13
and new data dictionary facilities required by the
project.
Factors ROI
P
, SM
P
, CA
P
, MI
P
, CR
P
and SA
P
take
value in the set { 0, 1, ··· , 5}, where zero indicates that
a given factor does not contribute to the value cre-
ated by the project and five that its contribution is
paramount. Intermediate values indicate intermediate
contributions. The risk factors OR
P
, DU
P
, TU
P
and
IR
P
also take value in the set {0, 1, ··· , 5}. However,
in this case, zero indicates that no meaningful risk is
associated with a factor and five that the associated
risk is considerable. Intermediate values indicate in-
termediate risk intensity. In (Parker et al., 1988) one
finds a complete descriprion of possible meanings to
both benefits and risk factor scores. Tables 1 and 2
are examples of such meanings.
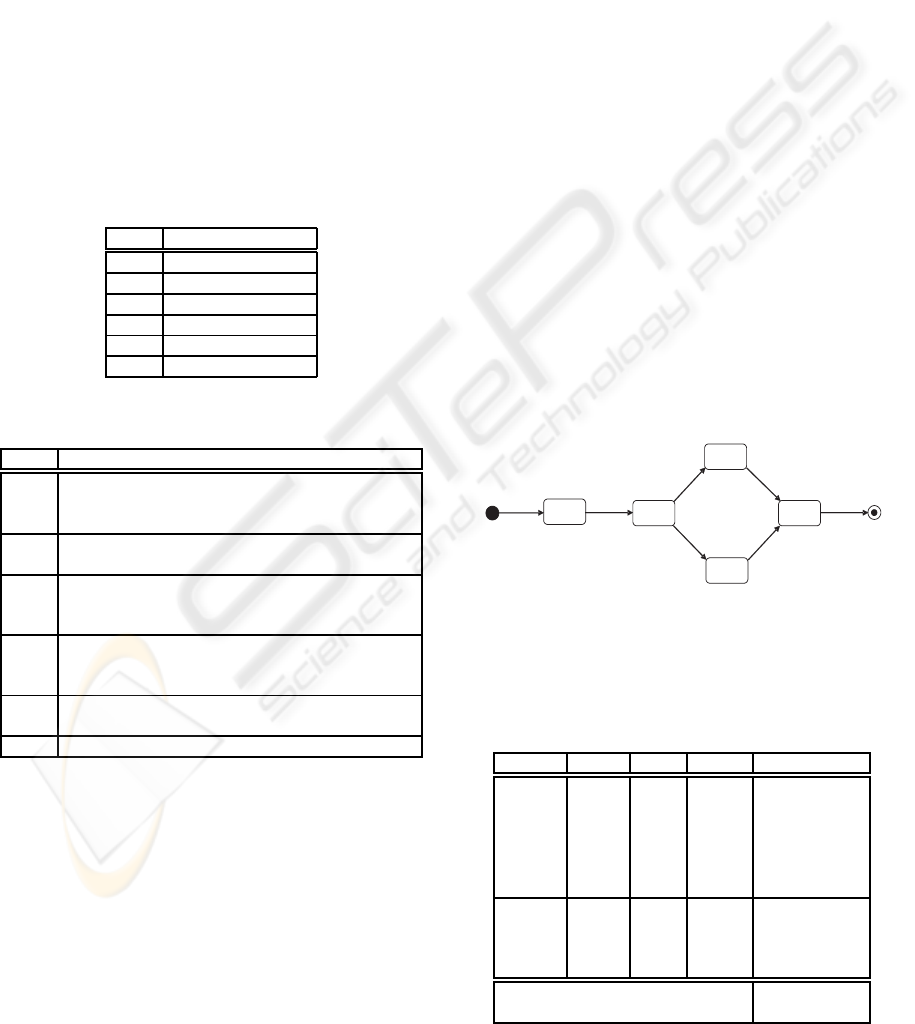
Table 1: Return on investment worksheet.
Score Return on Investment
0 zero or less
1 1% to 299%
2 300% to 499%
3 500% to 699%
4 700% to 899%
5 900% and over
Table 2: Strategic match worksheet.
Score Meaning
0 The project has no direct or indirect relationship to the
achievement of stated corporate (or departmental) strategic
goals.
1 The project has no direct or indirect relationship to such
goals, but it will improve operational efficiency.
2 The project has no direct relationship to such goals, but the
project is a prerequisite system (precursor) to another system
that achieves a portion of a corporate strategic goal.
3 The project has no direct relationship to such goals, but the
project is a prerequisite system (precursor) to another system
that achieves a corporate strategic goal.
4 The project directly achieves a portion of a stated corporate
strategic goal.
5 The project directly achievesa stated corporate strategic goal.
The weights w
1
, w
2
, ··· , w
10
are used to indicate
the relative importance of value and risk factors. It
should be noted that the value of each weight may
vary from business to business and that they should
be chosen in accordance with business mission and
goals. Saaty’s analytic hierarchical process (AHP)
may be used to choose the values of these weights ac-
cordingly (Saaty, 2001). Table 3 presents a summary
of the evaluation of a XP release plan using Informa-
tion Economics.
2.2 The XP Risk-Driven Method
The Risk-Driven Method for eXtreme Programming
release planning conceived by Li et al. (Li et al.,
2006) is a technique that allows XP practitioners to
make better decisions about selecting the functional-
ities that are going to be implemented in the next re-
lease. The method advocates the creation of many
feasible release plans whose value to business, risk
and required effort are presented to a decision maker.
For example, based on data collected from pre-
vious projects the development team has defined a
time frame of six weeks for each release size, 200
manhour as the release velocity and that there is a
set S = {S
1
, S
2
, S
3
, S
4
, S
5
} of five stories to be im-
plemented in the first release. After some consider-
ation the development team and software customers
have described in some detail what the software is
supposed to do in each one of these five stories. As
a result, a dependency relation has been established
among the stories, together with their relative busi-
ness value and development effort. Figure 1 presents
the dependenciesamong the stories and Table 4 shows
the relative business value of each story, as defined by
the software customers using AHP (Saaty, 2001), and
the development effort, as estimated by the develop-
ment team, using the “Yesterday’s Weather” concept
(Ganis et al., 2005).
S
1 S
2
S
3
S
4
S
5
Figure 1: Stories dependency network.
The next step in the method is to rank all feasible
release plans by business value, where each feasible
Table 3: Information economics summary worksheet.
Domain Factor Score Weight Weighted Score
ROI 2 5 10
SM 4 5 20
Business CA 0 1 0
MI 4 2 8
CR 0 1 0
OR 2 5 10
SA 4 2 8
DU 2 2 8
IT TU 1 2 2
IR 3 2 6
Value 48
Risk 24
ICEIS 2008 - International Conference on Enterprise Information Systems
14
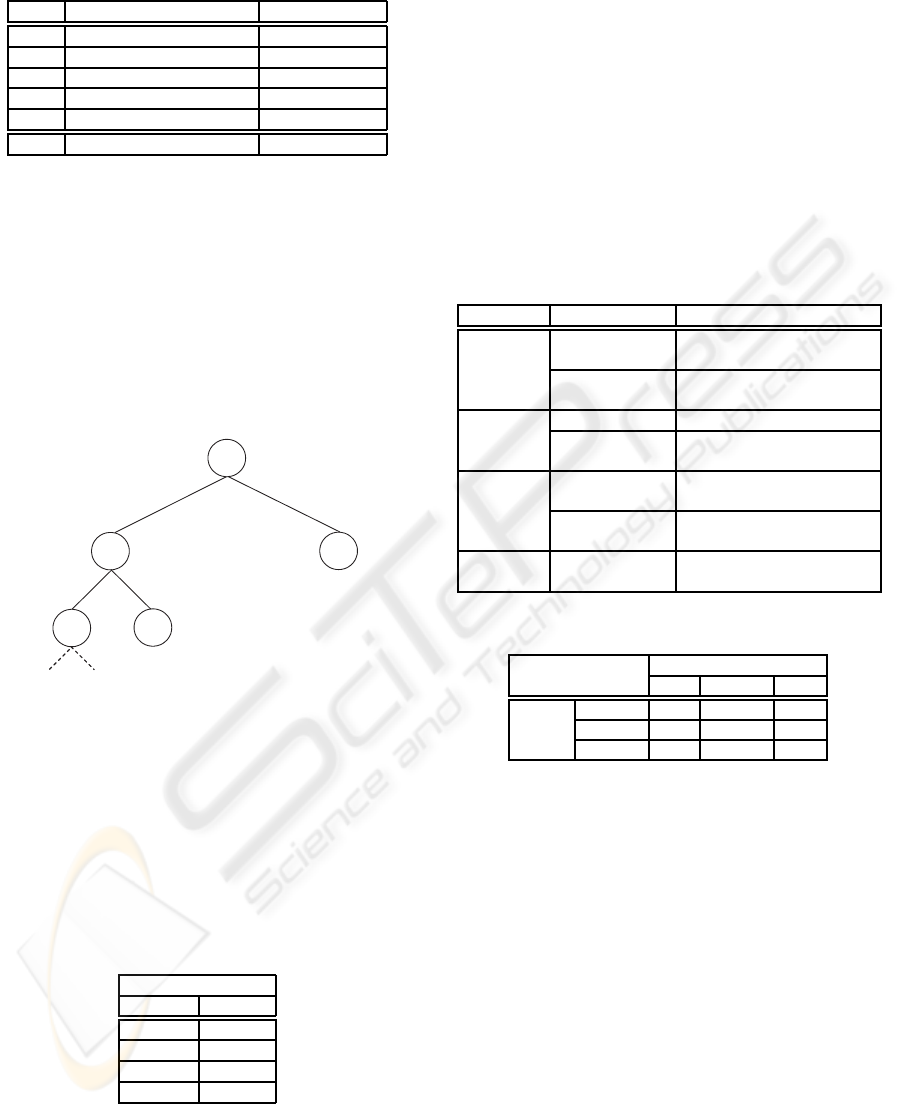
Table 4: Stories’ business values and development effort.
Story Relative Business Value (%) Effort (manhour)
S
1
40 70
S
2
35 80
S
3
15 40
S
4
5 50
S
5
5 25
Total 100 270
release plan is a set of stories that complies with the
release velocity and the stories’ dependencyrelations.
The ranking algorithm starts by building a binary tree
where the tree root S
0
is a dummy story, which re-
quires no effort to be implemented, and each other
node represents a real story. Moreover, arcs connect-
ing a child node to its father are decorated with the
expressions “Implement” and “Do not implement” in-
dicating whether that story is part of a release plan.
Figure 2 shows part of this tree.
Implement Don’t implement
S
0
S
1
S
2
S
2
S
1
Implement Don’timplement
Figure 2: A partial representation of a solution space tree.
Note that in such a tree each path from the root
to a leaf represents a possible release plan and that
all possible release plans are represented in the tree.
However, only those release plans that comply with
the release velocity and the stories’ dependency rela-
tions are the feasible release plans. For the given set
S of stories Table 5 shows the corresponding feasible
release plans.
Table 5: The feasible release plans and their stories.
Feasible Release Plans
Identifier Stories
FRP
1
S
1
, S
2
, S
3
FRP
2
S
1
, S
2
, S
4
FRP
3
S
1
, S
2
FRP
4
S
1
The next step in the method consists in the iden-
tification and evaluation of the risks concerning each
story, using requirement, estimation, technology and
personnel uncertainties as main criteria. Table 6
presents these criteria together with the corresponding
risk factors. The risk of each story is then evaluated
against the seven risk factors. Table 7 shows the risk
exposure mechanism used for each evaluation and Ta-
ble 8 the meaning of the risk scores.
For example, being exposure = probability ×
impact, if the story size estimation of S
1
has a high
probability of being wrong and this leads to a medium
impact on the project finances, then the risk exposure
is assessed as “Unacceptable” and 4 points are added
to the story risk exposure. Table 9 shows the risk ex-
posure of each story.
Table 6: Risk Taxonomy.
Risk Type Risk Factors Risk Description
Requirement Unstable Story Story is volatile because of the
volatile environment
Vague Story Story is unclear in businessgoals
or for system design
Estimation Story Size Wrong estimations of story size
Team
Productivity
Wrong estimations of team pro-
ductivity
Technology Architecture Con-
flict
How to combine new stories into
existent architecture
Difficult
Implementation
How to implement stories
Personnel Customers Customers are not domain ex-
perts in business
Table 7: A qualitative mechanism for risk assessment.
Risk Exposure Probability
Low Medium High
Low 1 2 3
Impact Medium 2 3 4
High 3 4 4
Finally, Table 10 shows all information provided
to software customers for decision making about the
feasible release plan to be implemented. Note that the
total risk scored by a feasible release plan is the sum
of the risks scored by each of its composing stories.
Both the total business value and the total effort re-
quired to build the release plan are calculated in the
same manner.
3 AN EXAMPLE
According to Seneca (4 BC - 65 AD ), the Roman
philosopher: “rules make the learners path long, while
examples make it short and successful”. As a result,
the method proposed in this paper is introduced step-
by-step with the help of a real-world inspired exam-
ple. In Section 4 the method is formalized.
AN EXTREME PROGRAMMING RELEASE PLAN THAT MAXIMIZES BUSINESS PERFORMANCE
15
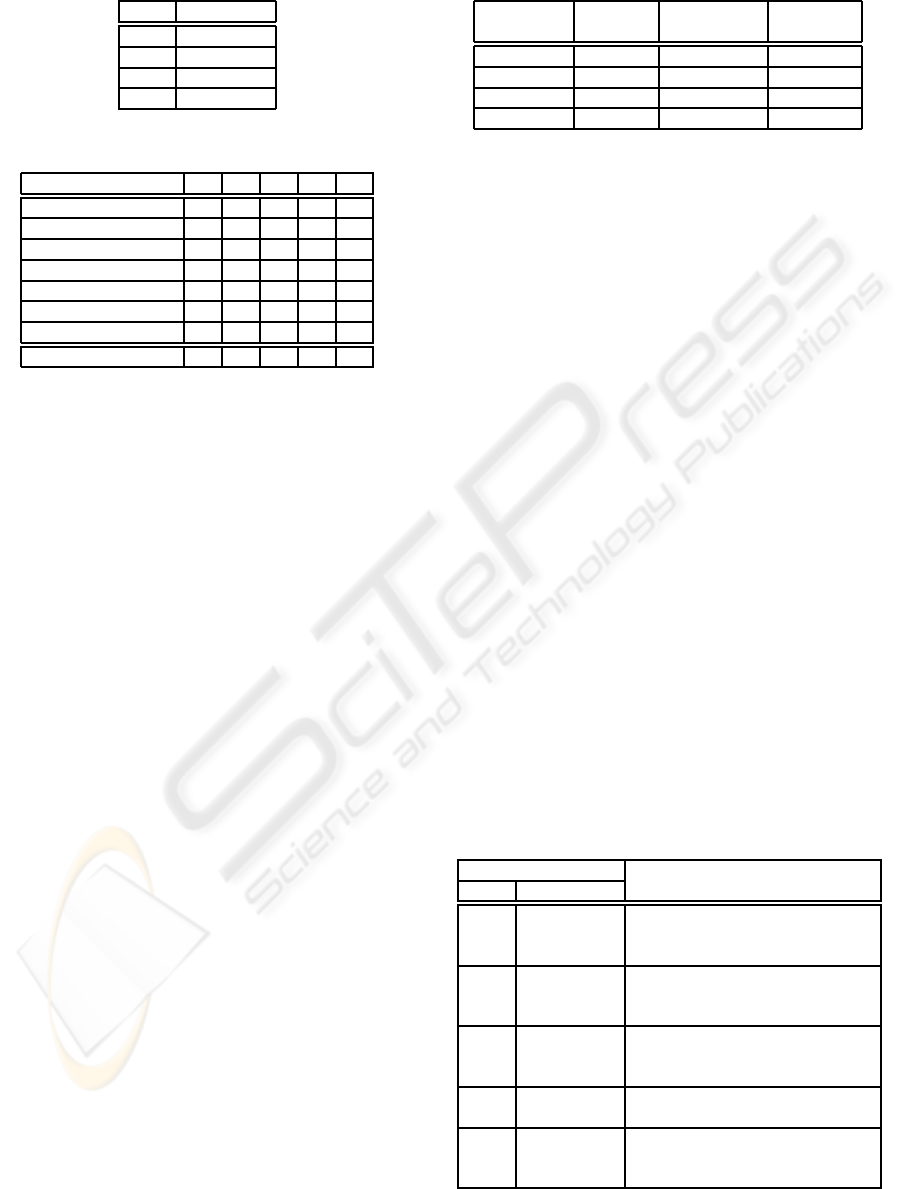
Table 8: Scores for risk exposure.
Score Meaning
4 Unacceptable
3 Critical
2 Significant
1 Minor
Table 9: Stories’ ranked risk.
Risk Factor S
1
S
2
S
3
S
4
S
5
Unstable Story 3 2 2 1 1
Vague Story 2 3 2 2 1
Story Size 3 3 2 2 1
Team Productivity 2 2 2 1 1
Architecture Conflict 2 1 1 1 1
Difficult Implementation 3 3 2 2 1
Customers 1 1 1 1 1
Total 16 15 12 10 7
3.1 Context Information
Performance management (also known as perfor-
mance appraisal, performance evaluation or perfor-
mance review) is the process of creating a work en-
vironment where people are able to perform to the
best of their abilities. The process begins when a job
position is recognized as needed in an organization.
A job description is then written, describing the du-
ties, responsibilities, qualifications, hierarchical po-
sition and reporting structure of its occupant. This
is done through job analysis, an activity concerned
with the understandingof the competencies, skills and
goals required to accomplish the needs of an organi-
zation.
The next step in performance management is to
develop a performance measurement model that indi-
cates how well each employee is performing his job
and whether his individual goals are aligned with cor-
porate objectives. The 360 degree or multi-rater is the
most widely used measurement model. It provides
employees with performance feedback from super-
visors, co-workers, peers, customers, suppliers and
reporting staff. Finally, the organization is able to
design a performance development plan, a key step
to effective performance management, where the fol-
lowing actions take place:
• Providing effective orientation, education and
training;
• Designing effective compensation and recogni-
tion models that reward people for their contribu-
tions to business performance;
• Selecting appropriateworkers with a due selection
process;
Table 10: Risks, business values and efforts for each FRP.
Feasible Total Risk Total Business Total Effort
Release Plan Score Value (%) (manhour)
FRP
1
23 90 190
FRP
2
23 80 200
FRP
3
17 75 150
FRP
4
9 40 70
• Providing on-going coaching and feedback;
• Conducting performance development discus-
sions;
• Providing career development opportunities; and
• Assisting with exit interviews to understand why
valued employees leave the organization.
Obviously, all of this is of paramount importance
when building lasting high-performance organiza-
tions (Armstrong, 2006).
3.2 Step 1: The Release Plan Size and
Velocity
Initially, based on statistical data of previous projects
software customers together with the development
team have established a time frame of six weeks for
each system release and 200 manhour as the release
velocity.
3.3 Step 2: Defining the Set of Stories
Also, they have defined that the first release should,
at most, contemplate the stories listed in Table 11 and
that these stories are constrained by the dependency
relations shown in Figure 1.
Table 11: Candidate stories to the first system release.
Story Description
Label Name
S
1
Employee
Data
Import the necessary employee data from
the payroll system into the performance
management database.
S
2
Competency
Dictionary
Develop user interfaces for viewing,
searching, and changing information
about competencies.
S
3
Job
Description
Implement interfaces that make it possi-
ble to establish competency-employee re-
lationship.
S
4
Appraisal
Matrix
Create user interfaces to build the ap-
praisal matrix by appraiser.
S
5
Performance
Development
Plan
Develop user interfaces to fill out the em-
ployee performance development form.
ICEIS 2008 - International Conference on Enterprise Information Systems
16
3.4 Step 3: Determining All Feasible
Release Plans
The next step in the method is to estimate the value of
the development effort for each story. Because these
activities have not been executed yet, their duration
can only be estimated.
Unfortunately, in most projects in the real-world
one does not know for certain the value of each dura-
tion. Those have to be estimated by experts, who use
past project information, their own opinion or a com-
bination of both to express the uncertainty related to
duration in the form of Probability Density Functions
(PDFs) (Vose, 2000). See (Hubbard, 2007) for a dis-
cussion on how these estimates may be obtained in
real-world projects.
With the support of past projects information (XP
Yesterday’s Weather concept), three point estimates
have been provided for each story, indicating their
minimum, most likely and maximum expected devel-
opment effort. Table 12 presents these figures.
Table 12: Total effort for performance appraisal stories.
Effort (manhour)
Story Minimum Most Likely Maximum
S
1
62 70 80
S
2
72 80 85
S
3
35 40 48
S
4
45 50 66
S
5
22 25 30
Following the footsteps of (Li et al., 2006) a tree
similar to the one described in Figure 2 is built. In
such a tree each node is further decorated with a tri-
angular probability density function (TPDF), indicat-
ing the estimated effort required to develop the story
in the node. The TPDF is one of the most widely
used functions to describe activity development effort
(Chung, 2003). Figure 3 partially presents such a tree.
Implement Don’t implement
S
0
S
1
S
2
S
2
S
1
Implement Don’timplement
S1
0.00
0.02
0.04
0.06
0.08
0.10
0.12
62 68 74 80
Effort
Probability
S1
0.00
0.02
0.04
0.06
0.08
0.10
0.12
62 68 74 80
Effort
Probability
S2
0.00
0.02
0.04
0.06
0.08
0.10
0.12
0.14
0.16
72 74 76 78 80 82 84 86
Effort
Probability
S2
0.00
0.02
0.04
0.06
0.08
0.10
0.12
0.14
0.16
72 74 76 78 80 82 84 86
Effort
Probability
Figure 3: The partial representation of a decorated solution-
space tree.
Note that, in a similar fashion, each path from the
root to a leaf represents a possible release plan con-
taining the stories in the path. Also, it should be noted
that all possible release plans are represented in the
tree. Table 13 connects stories to their respective pos-
sible release plans.
Table 13: Possible release plans.
Possible Release Plans
Identifier Stories
PRP
1
S
1
, S
2
, S
3
, S
4
, S
5
PRP
2
S
1
, S
2
, S
3
, S
4
PRP
3
S
1
, S
2
, S
4
, S
5
PRP
4
S
1
, S
2
, S
3
, S
5
PRP
5
S
1
, S
2
, S
4
PRP
6
S
1
, S
2
, S
3
PRP
7
S
1
, S
2
PRP
8
S
1
In order to determine which possible release
plans are feasible, considering the 200 manhour
release velocity, a Monte Carlo stochastic simu-
lation model has been built, with the support of
the software @Risk, from Palisade Corporation
(www.palisade.com). Each scenario in the simulation
process is composed of a random number indicating
the effort necessary to implement each story. The to-
tal effort required to develop each release plan is the
sum of the efforts necessary to develop the stories in
the release. Table 14 presents the figures collected
during simulation.
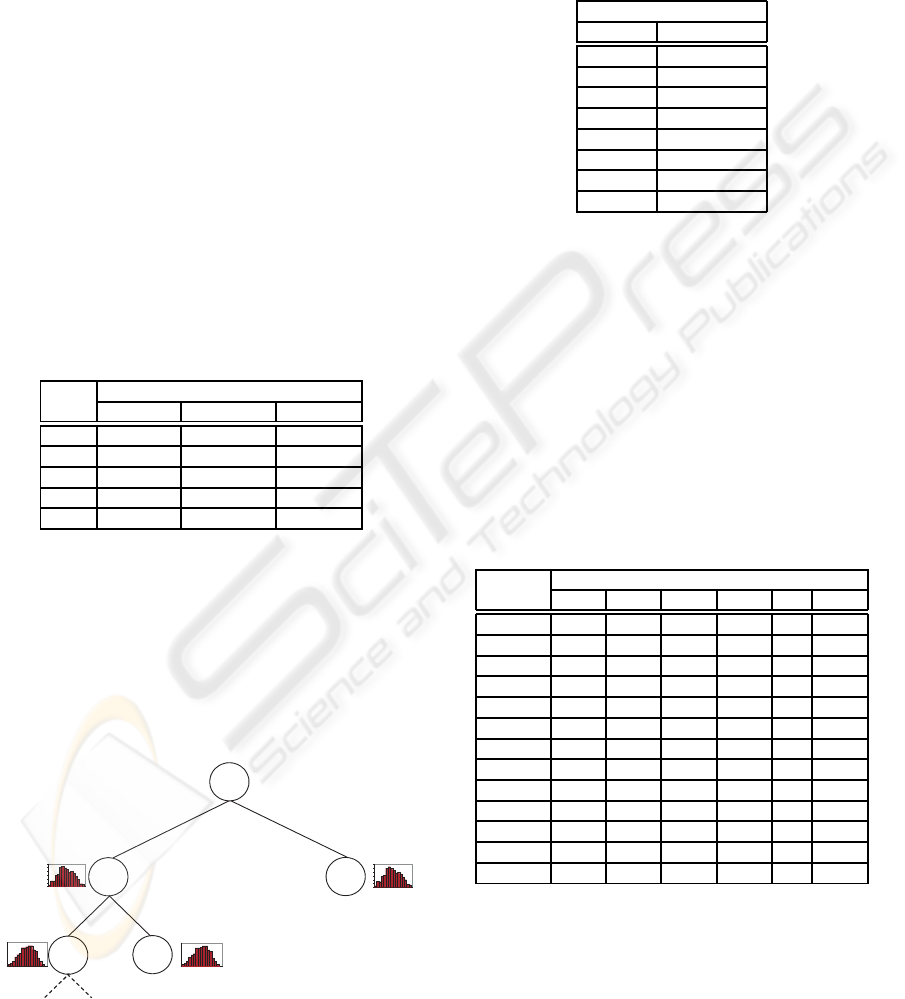
Table 14: Simulation results.
Variable Scenario
1 2 3 4 . . . n
S
1
76.0 65.5 70.7 77.7 .. . 68.7
S
2
75.9 74.4 78.4 77.7 .. . 82.7
S
3
38.1 42.0 43.6 36.8 .. . 43.5
S
4
48.2 58.4 52.5 46.5 .. . 63.3
S
5
24.4 23.8 28.3 25.5 .. . 22.9
PRP
1
224.6 222.1 230.1 227.3 . . . 237.6
PRP
2
200.2 198.3 201.7 201.8 . . . 214.7
PRP
3
224.6 222.1 230.1 227.3 . . . 237.6
PRP
4
214.5 205.7 221.1 217.7 . . . 217.8
PRP
5
200.1 198.3 201.6 201.9 . . . 214.7
PRP
6
190.0 181.9 192.7 192.2 . . . 194.8
PRP
7
152.0 139.9 149.2 155.3 . . . 151.4
PRP
8
76.0 65.5 70.7 77.7 .. . 68.7
Due to the random nature of the Monte Carlo
method the data concerning the effort required to de-
velop a release plan, collected during simulation, pro-
vide an estimate for the cumulative density function
that describes the actual release effort (Chung, 2003).
System users together with the development team
have determined that only the release plans comply
with the stories’ dependency constraints and that have
AN EXTREME PROGRAMMING RELEASE PLAN THAT MAXIMIZES BUSINESS PERFORMANCE
17

at least an estimated 80% chance of complying with
the release velocity are considered to be feasible.
For example, Figure 4 shows the cumulative den-
sity function of possible release plan 6 (PRP
6
), built
using the data presented in Table 14. Note that in 80%
of all simulated scenarios the release requires 195.14
manhour to be developed, indicating that the chance
of this release complying with the release velocity
threshold of 200 manhour is actually higher than 80%.
There are only two other possible release plans that
satisfy this requirement: PRP
7
, that requires 153.62
manhour to be completed in 80% of all simulated sce-
narios, and PRP
8
, that requires 73.99 manhour.
X <=195.14
80%
0
0.2
0.4
0.6
0.8
1
175 182 189 196 203 210
Effort
Probability
Figure 4: The Cumulative Density Function of PRP
6
effort.
3.5 Step 4: Evaluating the Business
Value of All Feasible Release Plans
Subsequently the feasible release plans are subjected
to evaluation using the multi-criterion approach of In-
formation Economics. For the purpose of the IE eval-
uation each release plan is considered to be a project
on its own. Because the three feasible release plans
PRP
6
, PRP
7
and PRP
8
have not been developed yet,
the score of each IE factor can only be estimated. As
a result, three point estimates have been provided for
each one of these factors. Table 15 presents these fig-
ures.
The weights w
1
, w
2
, ··· , w
10
indicate the relative
relevance of each factor and may vary from business
to business in accordance with strategy, mission and
goals. Table 16 presents the weights defined by high
management, using AHP (Saaty, 2001), considering
the reality of the health insurance business .
In order to determine the IE score of each feasi-
ble release plan a Monte Carlo stochastic simulation
model has been built, with the support of the soft-
ware @Risk. Each scenario in the simulation process
is composed of a random number indicating a valid
score for each IE factor, together with the total score
Table 15: Feasible Release Plan’s Scores.
Information Feasible Estimate
Economics Release Minimum Most Maximum
Factors Plan Likely
PRP
6
4 5 5
ROI PRP
7
2 3 4
PRP
8
1 1 2
PRP
6
4 5 5
SM PRP
7
2 3 5
PRP
8
0 0 1
.
.
.
.
.
.
.
.
.
.
.
.
.
.
.
PRP
6
1 2 3
IR PRP
7
0 1 3
PRP
8
0 0 1
Table 16: Relative weights of each factor.
Weight Factor Relative Weight
w
1
7%
w
2
15%
w
3
5%
w
4
15%
w
5
3%
w
6
15%
w
7
8%
w
8
15%
w
9
15%
w
10
2%
Total 100%
calculated as shown in Equation (1). Table 17 shows
the data collected during simulation of PRP
6
.
Table 17: IE simulation results for PRP
6
.
Variable Scenario
1 2 3 4 . . . n
ROI 5 4 5 4 . . . 5
SM 4 5 5 4 . . . 4
CA 4 5 4 4 . . . 4
MI 4 5 4 5 . . . 5
CR 3 5 5 4 . . . 5
SA 5 4 5 5 .. . 5
OR 0 1 3 0 . . . 0
DU 1 0 1 2 . . . 1
TU 3 4 4 3 . . . 3
IR 1 3 2 1 . . . 2
BB 2,06 2,20 2,13 2,14 ... 2,05
BR 0 0 0 0 . . . 0
ITB 0.75 0.75 0.75 0.75 . . . 0.75
ITR 0.65 0.65 0.65 0.63 . . . 0.65
Value(PRP
6
) 2,16 2,30 2,23 2,26 . . . 2,15
The data concerning the value of each feasible
release plan, collected during simulation, provide
an estimate for the cumulative density function that
ICEIS 2008 - International Conference on Enterprise Information Systems
18

describes the actual feasible release plan IE value
(Chung, 2003). Figure 5 shows the cumulative den-
sity function for the feasible release plans PRP
6
,
PRP
7
and PRP
8
.
PRP
6
PRP
7
PRP
8
0
0.2
0.4
0.6
0.8
1
0.4 0.9 1.4 1.9 2.4
IE Value
Probability
Figure 5: The Cumulative Density Function for the IE value
of PRP
6
, PRP
7
and PRP
8
.
In this case, the choice of the release plan that
maximizes business performance is straightforward
as the PRP
6
commutative density function dominates
the others, i.e., always yields higher values. For more
complex decisions under uncertainty one may find it
useful to consult (Wang, 2002; Baird, 2004).
4 THE METHOD
To successfully maximize business performance
through the selection of XP release plans, one should
take the following steps:
1. With the help of software customers and the de-
velopment team, establish the size of the release
plan and its velocity;
2. Define the set of stories that should, at most, be
contemplated in the release, together with its de-
pendency relations;
3. Determine all feasible release plans using the
stochastic risk-driven method, i.e.
(a) Provide three point estimates for the devel-
opment effort of each story, indicating their
minimum, most likely and maximum expected
value;
(b) Build the solution-space tree. Note that each
path from the root to a leaf represents a differ-
ent but possible release plan;
(c) Decorate each tree node with a triangular prob-
ability density function that indicates the devel-
opment effort of the story represented by the
node;
(d) Build a Monte Carlo simulation model that
properly represents the solution-space tree;
(e) Run the simulation process;
(f) For each scenario of the simulation process
record the release plan total effort, i.e. the sum
of the duration of all stories that are part of that
release plan;
(g) Build the cumulative density function that de-
scribes the effort required by each possible re-
lease plan; and
(h) Discard those release plans that do not com-
ply with the stories’ constraints and that are un-
likely to comply with the release velocity. The
remaining release plans are the feasible ones.
4. Evaluate the business value of each feasible
release plan using an Information Economics
stochastic model, i.e.
(a) For each feasible release plan, provide three
point estimates for each IE factor;
(b) Use AHP to define relative relevance of each IE
factor;
(c) Build a Monte Carlo simulation model that
properly represents the business value of each
feasible release plan;
(d) Run the simulation process;
(e) Build the cumulative density function that de-
scribes the business value of by each possible
release plan;
(f) Choose the feasible release plan that maximizes
business performance.
5 DISCUSSION
At the outset of this paper we undertook to present
a more realistic decision making method to be used
in the eXtreme Programming release planning phase.
Below we answer some key questions about this
method and discuss the implications of their existence
for different dimensions of XP project management.
5.1 Why have the Risk-Driven Method
and the IE Evaluation Model been
Extended?
Since IE was presented in the 1980’s and perfected in
the 1990’s (Parker, 1995; Parker et al., 1988), IE and
its many variants have been used to evaluate IT in-
vestment worldwide in a variety of different circum-
stances (Cumps et al., 2006; Serafeimidis and Smith-
son, 2003; Stewart and Mohamed., 2002). Not sur-
AN EXTREME PROGRAMMING RELEASE PLAN THAT MAXIMIZES BUSINESS PERFORMANCE
19

prisingly, IE is one of the most frequently referred IT
investment evaluation method in the literature
2
.
It is important to mention that Li et al.’s is not the
only XP release planing proposal available in the lit-
erature (Beyer et al., 2004; Boehm and Turner, 2003).
However, as they point out in (Li et al., 2006), the
premises of all these other proposals is that the busi-
ness value of a release plan is not a relevant issue in
the XP paradigm and that detailed requirements and
architectural design are available before implementa-
tion. However, in XP practice, it is rare to come by
a case where these premises hold (Beck and Fowler,
2000). All of this makes both IE and Li et al.’s meth-
ods worth extending.
In the increasingly complex world we live in soft-
ware projects are known to face many different kinds
of uncertainties, whether they are managerial, techni-
cal, political, economical, social, educational or eth-
nical, among others. In such a complex environment
it is neither easy to obtain accurate estimates for the
effort required by a release plan, composed of mul-
tiple stories, nor for the business values of the plans
that are feasible.
To overcome these difficulties project managers
need methods and tools that are able to deal properly
with the uncertainties that naturally arises in each esti-
mate upon which they have to rely. By allowing three
point estimates, together with Monte Carlo simula-
tion, to be used in both Li et al.’s Risk-Driven method
and Information Economics we provide a stochastic
model that better reflects the reality in which these es-
timates are made. The results yielded by the extended
models are cumulative density functions that, when
properly analyzed, provide a better and more reliable
basis for decision making (Wang, 2002; Baird, 2004).
5.2 How do XP Practitioners Benefit
from Selecting a XP Release Plan
that Maximizes Business
Performance?
XP is an interactive incremental software develop-
ment paradigm based upon the delivery of small in-
crements of functionality, high customer involvement
and commitment to the software project, constant
code improvement and egoless computer program-
ming. As a result, in many circumstances, XP is able
to deliver value to business relatively faster than more
classic methodologies, specially in uncertain environ-
ments.
2
A consult to Google Scholar (www.scholar.google
.com) easily supports this claim.
However, Denne and Cleland-Huang (Denne and
Cleland-Huang, 2004) have shown that the order in
which software functionalities are delivered may not
only increase its value to business, but may also re-
duce the development cost, allowing expensive and
complex systems to be developed from a proportion-
ately small investment. According to Denne and
Cleland-Huang the selection of the right delivery
planning of software functionalities may allow for:
• Competitive differentiation - when the functional-
ities anticipates the creation of service or product
features that are valued by customers and that are
different from anything else being offered in the
market;
• Revenue generation - although the software func-
tionalities do not provide any unique valuable fea-
tures to customers, they do provide extra revenue
by allowing the organization to offer the same
quality as other products on the market for a better
price;
• Cost savings - when the software functionalities
allow businesses to save money by making one or
more business processes cheaper to run;
• Brand projection - when the software functionali-
ties allow an organization to project itself as being
customer conscious or technologically advanced;
and
• Enhanced customer loyalty - the software fun-
cionalities influences customers to buy more,
more frequently or both.
Therefore, more value to business delivered ear-
lier tends to reduce costs, increase customer involve-
ment, high management commitment to software de-
velopment, provide a better alignment between the IT
efforts and business strategy, and contributeto the cre-
ation of competitive advantage elements. All of this
tends to increase the attractiveness of XP practices to
business and the market value of XP practitioners.
5.3 Why is the Method Proposed in this
Paper any Better than Li’s Method?
Table 18 compares the method proposed in this pa-
per against the Risk-Driven Method conceived by (Li
et al., 2006), with clear advantage to the former. Fur-
thermore, the proposed method can be easily autom-
atized with the help of macros and a Microsoft Excel
spreadsheet. Note that this has actually being done
with the help of @Risk, an add-in to Excel, to make
it easier to analyze the example introduced in Section
3.
ICEIS 2008 - International Conference on Enterprise Information Systems
20

Table 18: A comparison between the Risk-Driven Method
and the method proposed in this paper.
Criterion Risk-Driven Proposed
Method Method
Deals properly with uncertain estimates. χ
Evaluates the values of a release plan
from a multi-criterion point of view; in-
cluding benefits to business and IT.
χ
Provides a more accurate evaluation of
the business value of a release plan.
χ
Clearly indicates the criteria to be used
to evaluate a release plan.
χ
Technical and business risks are evalu-
ated by both the development team and
software customers.
χ
Favors more strongly softwarecustomers
evolvement with and high management
commitment to software development.
χ
5.4 Why should XP Practitioners
Embrace the Method Proposed in
this Article?
One of the main goals of the XP software develop-
ment process is to deliver valuable software to busi-
ness on a continuous basis. This is accomplished
by keeping development goals aligned with business
goals at all times, and, as frequently as possible, up-
dating the software being developed with features that
fulfill customer’s needs and expectations.
The method propose in this paper helps to estab-
lish a common language between software developers
and business stakeholders, by allowing each release
plan to provide the best possible value to business
from well established multi-criterion point of view.
Moreover, it is important to keep in mind that XP
is not the only agile method available and that its
competitors are continuously improving their devel-
opment strategies and tactics aiming at adding more
value to business. In this sense, the method proposed
in this paper helps to better position XP in the bat-
tle for the preference of software developers and cus-
tomers.
6 CONCLUSIONS
This paper demonstrates the viability of success-
fully extending and combining Li et al.’s Risk-Driven
Method for eXtreme Programming release planning
with Parker’s Information Economics to provide XP
practitioners with more effective means of select-
ing the release plan that maximizes business perfor-
mance.
The resulting method takes into considerations
multiple aspects of business to evaluate the value of
a release plan, deals more easily with the uncertain
estimates that are so common in software projects,
helps to better align the IT efforts with business strat-
egy and favors the establishment of better working re-
lations between system development teams and their
hiring organizations. Furthermore, the method is not
difficult to use and automatize, favoring customer in-
volvement with software development, better deci-
sion making and high management commitment to
the software development process within their orga-
nizations.
REFERENCES
Armstrong, M. (2006). Performance Management: Key
Strategies and Practical Guidelines. Kogan Page, 3
rd
edition.
Baird, B. F. (2004). Managerial Decisions Under Uncer-
tainty: An Introduction to the Analysis of Decision
Making.
Beck, K. and Fowler, M. (2000). Planning Extreme Pro-
gramming. Addison-Wesley, 1
st
edition.
Beyer, H., Holtzblatt, K., and Baker, L. (2004). An agile
customer-centered method: Rapid contextual design.
In 4
th
Conference on Extreme Programming and Agile
Methods, pages 50–59, Calgary, Canada.
Boehm, B. and Turner, R. (2003). Using risk to bal-
ance agile and plan-driven methods. IEEE Computer,
36(6):57– 66.
Boehm, B. and Turner, R. (2004). Balancing Agility and
Discipline: A Guide for the Perplexed. Addison-
Wesley.
Cavaleri, S. A. and Obloj, K. (1993). Management Sys-
tems: A Global Perspective. Wadsworth Publishing
Company.
Chung, C. A. (2003). Simulation Modeling Handbook: A
Practical Approach. CRC Press.
Cumps, B., Viaene, S., and Dedene, G. (2006). Manag-
ing for better business-it alignment. IT Professional,
8(5):17–24.
Denne, M. and Cleland-Huang, J. (2004). The incremental
funding method: Data driven software development.
IEEE Software, 21(3):39–47.
Ganis, M., Leip, D., Grossman, F., and Bergin, J. (2005).
Introducing agile development (XP) into a corporate
webmaster environment - an experience report. In
Proceddings of the Agile Conference, pages 145–152,
Denver, CO (USA).
Hubbard, D. W. (2007). How to Measure Anything: Finding
the Value of “Intangibles” in Business. John Wiley.
Jayaswal, B. K. and Patton, P. C. (2006). Design for Trust-
worthy Software: Tools, Techniques, and Methodol-
ogy of Developing Robust Software. Prentice Hall.
AN EXTREME PROGRAMMING RELEASE PLAN THAT MAXIMIZES BUSINESS PERFORMANCE
21

Li, M., Huang, M., Shu, F., and Li, J. (2006). A risk-
driven method for extreme programming release plan-
ning. Proceeding of the 28th international conference
on Software engineering.
Beck et al., K. (2001). Manifesto for agile software devel-
opment. Available at www.agilemanifesto.org. Last
visited on January 19
th
, 2007.
Nerur, S., Mahapatra, R., and Mangalaraj, G. (2005). Chal-
lenges of migrating to agile methodologies. Commu-
nications of the ACM, 48(5).
Noble, J., Marshall, S., Marshall, S., and Biddle, R.
(2004). Less extreme programming. Proceedings of
the sixth conference on Australasian computing edu-
cation, pages 217–226.
Parker, M. M. (1995). Strategic Transformation and Infor-
mation Technology. Prentice-Hall, 1
st
edition.
Parker, M. M., Benson, R. J., and Trainor, E. (1988). Infor-
mation Economics. Linking Business Performance to
Information Technology. Prentice-Hall.
Saaty, T. L. (2001). Decision Making for Leaders. RWS
Publications, 3
rd
edition.
Serafeimidis, V. and Smithson, S. (2003). Information sys-
tems evaluation as an organizational institution: expe-
rience from a case study. Information Systems Jour-
nal, 13:251–274.
Stewart, R. and Mohamed., S. (2002). IT/IS projects selec-
tion using multi-criteria utility theory. Logistics Infor-
mation Management, 15(4):254–270.
Vose, D. (2000). Risk Analysis: A Quantitative Guide. John
Wiley, 2
nd
edition.
Wang, J. X. (2002). What Every Engineer Should Know
About Decision Making Under Uncertainty. CRC.
ICEIS 2008 - International Conference on Enterprise Information Systems
22
