
BUILDING A DECISION SUPPORT SYSTEM FOR STUDENTS
BY USING CONCEPT MAPS
Dumitru Dan Burdescu, Marian Cristian Mihaescu
Software Engineering Department, University of Craiova,Craiova, Romania
Bogdan Logofatu
CREDIS, University of Bucharest, Bucharest, Romania
Keywords: Concept mapping, e-learning, decision support system.
Abstract: Concept maps are an effective way of representing organized knowledge (concepts) in hierarchical fashion
regarding a person’s understanding of a domain of knowledge. Within our custom developed e-Learning
platform it was created a concept map for a chapter of a discipline. The obtained concept map has been used
for creation the test and exam questions such that knowledge regarding each concept is tested by a certain
number of quizzes. We present the architecture of a decision support system that assesses the accumulated
knowledge of students. The architecture’s business logic is based on a concept map of a chapter of a
discipline. A custom algorithm has been designed and implemented to measure the coverage of the
curriculum. The system may be generalized for entire discipline as long as for each chapter is set up a
concept map and all other necessary settings.
1 INTRODUCTION
Every e-Learning platform has implemented a
mechanism for assessing the quantity of
accumulated knowledge for a certain discipline. A
problem that frequently arises is that the system in
place may not be fair regarding the ordering of
learners according with accumulated knowledge.
Usually, there are situations when the distributions
of grades is not normal, such that many learners are
clustered although there are differences regarding
their accumulated knowledge.
The evaluation environment is represented by the
setup put in place within an e-Learning platform for
assessment of learners. The setup consists of course
materials and test quizzes that are set up by course
managers. Learner’s activities are obtained by
specific methods embedded in our e-Learning
platform, called Tesys (Burdescu et. al., 2006). The
main goal of the application is to give students the
possibility to download course materials, take tests
or sustain final examinations and communicate with
all involved parties. To accomplish this, four
different roles were defined for the platform:
sysadmin, secretary, professor and student.
Concept maps are a result of Novak and Gowin’s
(1984) research into human learning and knowledge
construction. Novak (1977) proposed that the
primary elements of knowledge are concepts and
relationships between concepts are propositions.
Novak (1998) defined concepts as “perceived
regularities in events or objects, or records of events
or objects, designated by a label”. Propositions
consist of two or more concept labels connected by a
linking relationship that forms a semantic unit.
Concept maps are a graphical two-dimensional
display of concepts (usually represented within
boxes or circles), connected by directed arcs
encoding brief relationships (linking phrases)
between pairs of concepts forming propositions. The
simplest concept map consists of two nodes
connected by an arc representing a simple sentence
such as ‘flower is red,’ but they can also become
quite intricate.
One of the powerful uses of concept maps is not
only as a learning tool but also as an evaluation tool,
thus encouraging students to use meaningful-mode
learning patterns (Mintzes et al., 2000; Novak, 1990;
Novak & Gowin, 1984). Concept maps are also
effective in identifying both valid and invalid ideas
130
Dan Burdescu D., Cristian Mihaescu M. and Logofatu B. (2008).
BUILDING A DECISION SUPPORT SYSTEM FOR STUDENTS BY USING CONCEPT MAPS.
In Proceedings of the Tenth International Conference on Enterprise Information Systems - AIDSS, pages 130-135
DOI: 10.5220/0001673301300135
Copyright
c
SciTePress

held by students, and this will be discussed further in
another section. They can be as effective as more
time-consuming clinical interviews for identifying
the relevant knowledge a learner possesses before or
after instruction (Edwards & Fraser, 1983).
Ausubel made the very important distinction
between rote learning and meaningful learning.
Meaningful learning requires three conditions: 1.
The material to be learned must be conceptually
clear and presented with language and examples
relatable to the learner’s prior knowledge. Concept
maps can be helpful to meet this condition, both by
identifying large general concepts held by the leaner
prior to instruction of more specific concepts, and by
assisting in the sequencing of learning tasks though
progressively more explicit knowledge that can be
anchored into developing conceptual frameworks; 2.
The learner must possess relevant prior knowledge.
This condition can be met after age 3 for virtually
any domain of subject matter, but it is necessary to
be careful and explicit in building concept
frameworks if one hopes to present detailed specific
knowledge in any field in subsequent lessons. We
see, therefore, that conditions (1) and (2) are
interrelated and both are important; 3. The learner
must choose to learn meaningfully. The one
condition over which the teacher or mentor has only
indirect control is the motivation of students to
choose to learn by attempting to incorporate new
meanings into their prior knowledge, rather than
simply memorizing concept definitions or
propositional statements or computational
procedures. The indirect control over this choice is
primarily in instructional strategies used and the
evaluation strategies used. Instructional strategies
that emphasize relating new knowledge to the
learner’s existing knowledge foster meaningful
learning. Evaluation strategies that encourage
learners to relate ideas they possess with new ideas
also encourage meaningful learning. Typical
objective tests seldom require more than rote
learning (Holden, 1992).
Knowledge modeling methods and languages
may be thought of as representation schemes that
augment traditional data modeling by adding
semantic content to the modeling language (Mineau
et al. 2000). Knowledge modeling approaches lie on
a continuum from informal (and potentially, easily
understood by humans) to formal (and therefore,
capable of being evaluated by machine). Chan and
Johnston (1996) describe two categories of
approaches to knowledge modeling: one group
based upon problem solving methods and another
based upon domain ontologies. These two
approaches have significant overlap in the sense
that, although problem solving methods are process
oriented and ontological accounts start with
characterizations of objects, at some point during
knowledge model construction, process models must
be created.
This paper presents a procedure for measuring
learner’s accumulated knowledge using concept
mapping. The most important thing is to construct a
good concept map. It is important to begin with a
domain of knowledge that is very familiar to the
person constructing the map. After concepts have
been enumerated the concept map is build. For each
concept there is created a pool of questions
regarding that concept. At any point in time the
concept map may be seen as a graph, such that a
coverage function may be used to compute the
learner’s accumulated knowledge.
2 METHODS AND MATERIALS
2.1 Tesys e-Learning Platform
The main goal of the platform is to give students the
possibility to download course materials, take tests
or sustain final examinations and communicate with
all involved parties. To accomplish this, four
different roles were defined for the platform:
sysadmin, secretary, professor and student.
The main task of sysadmin users is to manage
secretaries. A sysadmin user may add or delete
secretaries, or change their password. He may also
view the actions performed by all other users of the
platform. All actions performed by users are logged.
In this way the sysadmin may check the activity that
takes place on the application. The logging facility
has some benefits. An audit may be performed for
the application with the logs as witness. Security
breaches may also be discovered.
Secretary users manage sections, professors,
disciplines and students. On any of these a secretary
may perform actions like add, delete or update.
These actions will finally set up the application
such that professors and students may use it. As
conclusion, the secretary manages a list of sections,
a list of professors and a list of students. Each
discipline is assigned to a section and has as
attributes a name, a short name, the year of study
and semester when it is studied and the list of
professors that teach the discipline which may be
maximum three. A student may be enrolled to one or
more sections.
BUILDING A DECISION SUPPORT SYSTEM FOR STUDENTS BY USING CONCEPT MAPS
131
Tesys application offers students the possibility
to download course materials, take tests and exams
and communicate with other involved parties like
professors and secretaries.
Students may download only course materials for
the disciplines that belong to sections where they are
enrolled. They can take tests and exams with
constraints that were set up by the secretary through
the year structure facility.
2.2 Sample Concept Maps
Concept mapping may be used as a tool for
understanding, collaborating, validating, and
integrating curriculum content that is designed to
develop specific competencies. Concept mapping, a
tool originally developed to facilitate student
learning by organizing key and supporting concepts
into visual frameworks, can also facilitate
communication among faculty and administrators
about curricular structures, complex cognitive
frameworks, and competency-based learning
outcomes. To validate the relationships among the
competencies articulated by specialized accrediting
agencies, certification boards, and professional
associations, faculty may find the concept mapping
tool beneficial in illustrating relationships among,
approaches to, and compliance with competencies
(McDaniel et. al.).
According to this approach, the responsibility for
failure at school was to be attributed exclusively to
the innate (and, therefore, unalterable) intellectual
capacities of the pupil. The learning/ teaching
process was, then, looked upon in a simplistic, linear
way: the teacher transmits (and is the repository of)
knowledge, while the learner is required to comply
with the teacher and store the ideas being imparted.
(Vecchia, L, et. al.)
2.3 Knowledge Evaluation
Methodology
Knowledge evaluation is closely related with
cognitive processes performed by an individual.
After an initial step of goal setting a student has at
first to identify task-relevant knowledge and to
evaluate it with respect to his own knowledge
regarding that goal. Self-evaluation of individual
knowledge is a step that should be performed before
any learning process. For example, if the task is to
acquire expert knowledge, the structure of an
individuals' knowledge as represented in an
individual knowledge map may be compared with
the knowledge structure of an expert as represented
in an expert map. The potential of knowledge maps
as means for diagnosing individual structures of
knowledge has been shown in a variety of empirical
studies (a.o. Jonassen et al., 1997). In self-regulated
learning scenarios the particular contribution of
computer-based concept maps is that they may
support self-assessment (Shavelson, Lang, & Lewin,
1994; Kommers & Lanzing, 1997).
A concept map may be seen as an oriented graph
where vertexes are represented by concepts and
edges are represented by verbs. Within e-Learning
platform for each proposition from the concept map
may will be represented by an weighted edge and
will have associated a number of quiz questions.
Under these circumstances we have created an
algorithms for building the associated graph of a
concept map. The parameters of edges are
continuously updated as the student answers quizzes.
In the experimental part of the paper there will be
presented the obtained graph. Each edge in the graph
will have four parameters: the weight, the total
number of questions, the correctly answered
questions and the wrong answered questions.
Knowledge evaluation procedure takes into
account the parameters of edges from the associated
graph of concept map. The weight of an edge is set
by the domain knowledge expert from a scale from 1
to 10 where 1 means very simple proposition and 10
means very hard proposition. All other parameters
take different values according with learner’s
experience. In the experimental part there will be
presented the formulas that synthesize the
knowledge level of the learner.
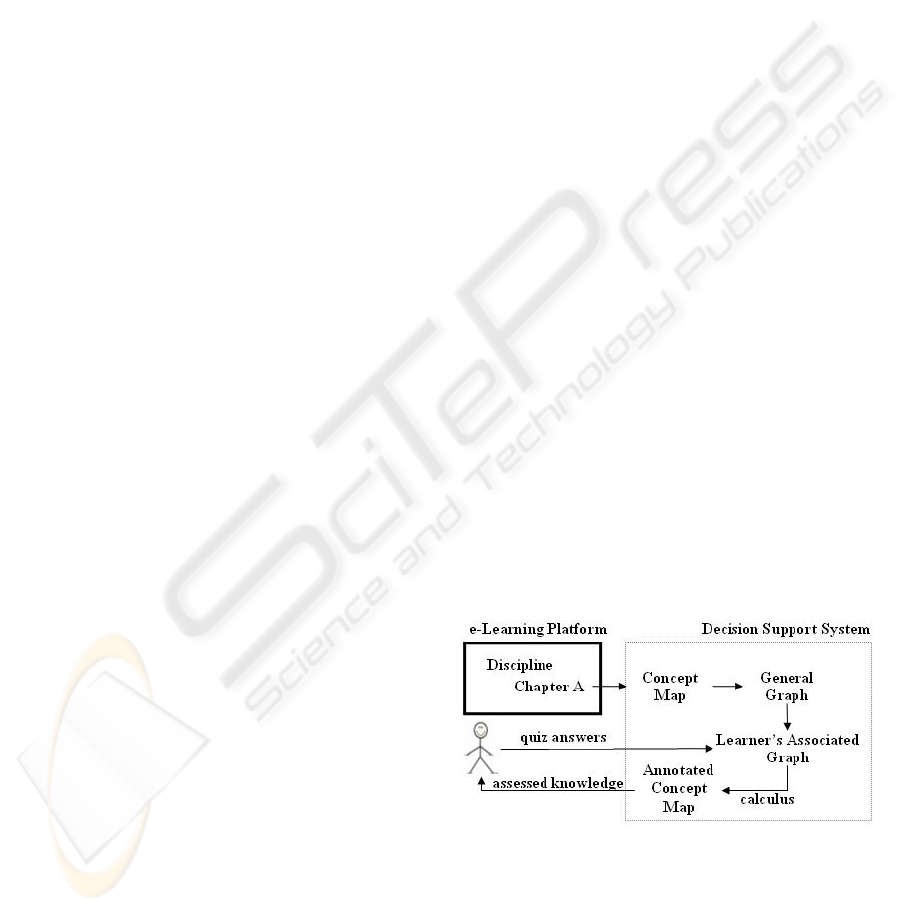
The analysis of concept’s map associated graph
represents the core part of decision support system
that runs along the e-Learning platform. The
architecture of the decision support system is
presented in figure 1.
Figure 1: Functionality of Decision Support System.
Chapter A has associated a concept map build by
a domain expert. From the concept map a
transformation procedure creates the general graph
of the chapter. In this graph, each sentence becomes
an edge, weighted by the domain expert. Besides the
associated weight, each proposition has associated a
ICEIS 2008 - International Conference on Enterprise Information Systems
132
set of quiz questions that are to be answered by
learners.
When the learner starts answering questions, the
Decision Support System starts building learner’s
associated graph. This graph represents the input
data for the calculus procedure that assesses the
knowledge of the students regarding chapter A.
Whenever a student logs in the Decision Support
System builds the learner’s associated graph such
that at request the knowledge status will be delivered
in the form of an annotated concept map.
3 EXPERIMENTAL RESULTS
The experimental results were obtained on Tesys e-
Learning platform (Burdescu and Mihaescu, 2006).
On this platform there was set an Algorithms and
Data Structures discipline. The tests were performed
for the chapter named Binary Search Trees.
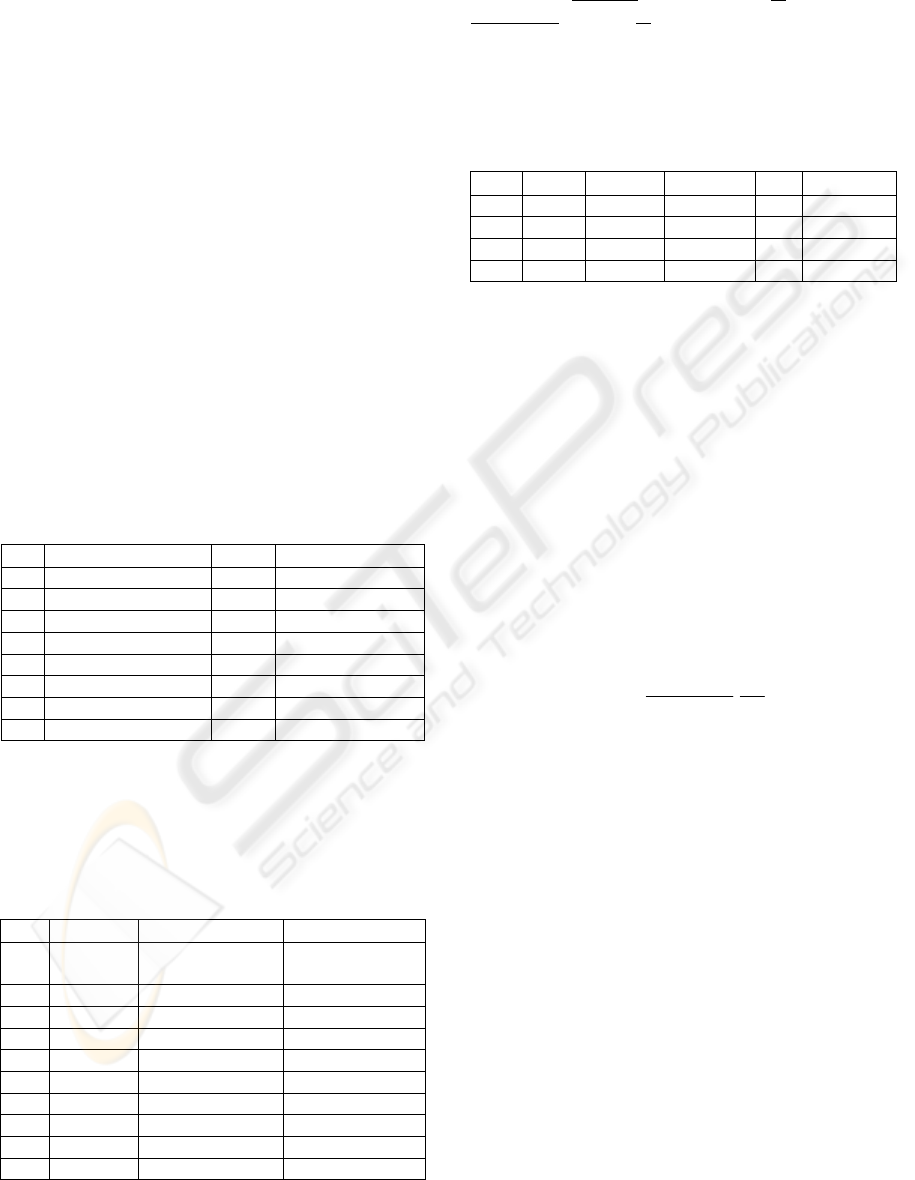
The concept map for Binary Search Trees is
presented in figure 2. It contains 16 concepts, 11
linking phrases and 16 propositions.
The concepts are presented in table 1.
Table 1: List of Concepts.
Id Concept Id Concept
C1 BST C9 Right child
C2 Dynamic Structure C10 No child
C3 Node(s) C11 Root
C4 Traversed C12 Leaf
C5 Key C13 Preorder
C6 Parent C14 Inorder
C7 Child C15 Postorder
C8 Left child C16 Ascending order
The list of propositions with two concepts and
one linking phrase is presented in table 2. The list of
propositions with three concepts and two linking
phrases is presented in table 3.
Table 2: List of propositions with two concepts and one
linking phrase.
Id Concept Linking phrase Concept
P1 BST is Dynamic
Structure
P2 BST is made of Node(s)
P3 Node has key
P4 Node is Parent
P5 Node is Child
P6 Parent is greater than Left child
P7 Parent is smaller than Right child
P8 Node may have Left child
P9 Node may have Right child
P10 Node may have No child
There is one proposition with five concepts and
four linking phrases:
“BST” may be
“Traversed” in “Preorder”
determines
“Key” in “Ascending Order”. The
concepts are bolded and put between quotation
marks, while linking phrases are italic and
underlined.
Table 3: List of propositions with three concepts and two
linking phrase.
Id C LP C LP C
P11 Node without parent is root
P12 BST may be traversed in Preorder
P13 BST may be traversed in Inorder
P14 BST may be traversed in Postorder
Once the concept map has been built the general
graph of the chapter may be created. In this graph,
each proposition will become an edge that links the
first concept and the last concept. The domain
knowledge expert will assign a weight for each edge.
While the students answers questions the number of
correct and wrong answers will determine the
knowledge weight of that edge.
If:
W- is the weight of the edge
CA – is the number of correct answers
WA – is the number of wrong answers
N – the number of questions
Than
KW – is the knowledge weight of the edge
and
100
1
∗
−
=
W
N
WACA
KW
Under these circumstances the knowledge
weight may also be negative. At any time there may
be estimated the overall knowledge level of the
learner as the ratio between overall knowledge
weight and overall weight.
Figure 2 presents the general graph associated
with the concept map.
The algorithm transforming the Concept Map
into General Graph is strait forward. Each
proposition becomes an edge with an weight
assigned by domain knowledge expert. In this way it
was obtained the Binary Search Tree General Graph.
Once the General Graph has been set up the
professor has to set up the quiz questions for the
chapter. For each edge in the graph it will
correspond a certain number of quiz questions.
There is no specification regarding the number of
quiz questions but a minimum (e.g. five) number is
still required. Once the quiz questions have been set
up, for each student there may be constructed
BUILDING A DECISION SUPPORT SYSTEM FOR STUDENTS BY USING CONCEPT MAPS
133
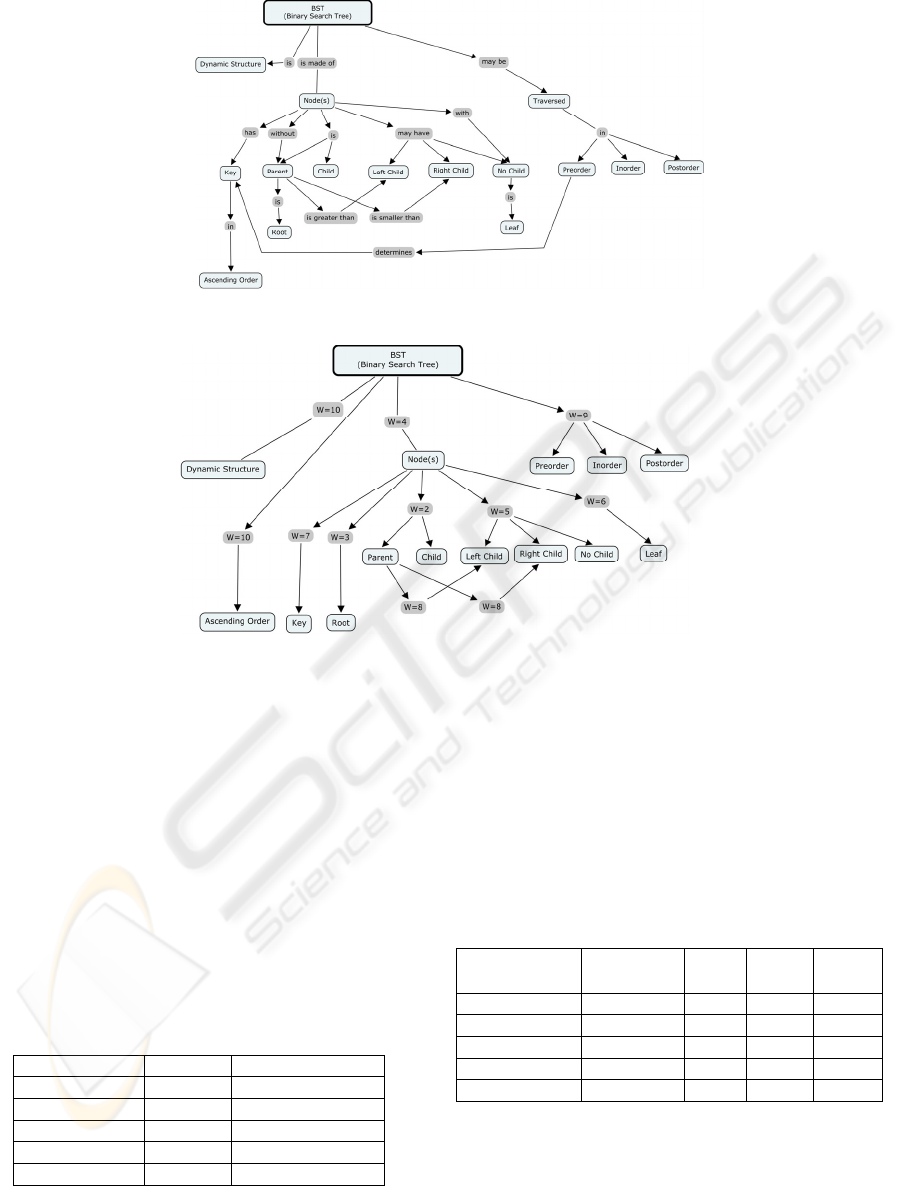
Figure 2: Binary Search Tree Concept Map.
Figure 3: Binary Search Tree General Graph.
the learner’s associated graph. This graph will have
associated with the edges the history of correct and
wrong answered questions. The Calculus engine will
reconstruct an Annotated Concept Map which will
present to the learner the current status of his
knowledge level at Concept level. In this way, the
learner will have an exact overview of his
knowledge level regarding that chapter.
The Annotated Concept Map may represent the
important information for learner in having a
decision regarding which part of the chapter needs
more study.
Table 4 presents a sample of the setup of the
Binary Search Trees chapter.
Table 4: Sample setup of BST chapter.
Proposition Weight No. of questions
P1 10 8
P2 4 7
P3 7 6
P4 3 5
P5 2 7
Table 5 presents a sample of the of the values of
the Learner’s Associated Graph corresponding to
BST chapter.
The values from table five are marked in an
Annotated Concept Map that is finally presented to
the learner. The Annotated Concept Map is the final
outcome of the Decision Support System and is
supposed to guide the learner regarding the
necessary future efforts.
Table 5: Sample values for Learner’s Associated Graph.
Proposition
(Weight)
No. of
questions
CA WA KW
(%)
P1 (10) 8 3 2 1.25
P2 (4) 7 4 2 7.14
P3 (7) 6 1 3 -4.76
P4 (3) 5 3 1 13.3
P5 (2) 7 2 4 -14.2
ICEIS 2008 - International Conference on Enterprise Information Systems
134

4 CONCLUSIONS AND FUTURE
WORK
The paper presents the structure and functionality of
a Decision Support System that runs along Tesys e-
Learning platform.
Tesys e-Learning platform has been designed
such that on-line testing activities may me
performed as they were set up by course managers.
It has been created a Concept Map for a Binary
Search Trees chapter within Algorithms and Data
Structures course. The Concept map has been the
staring point in creating a set of quiz questions. Each
quiz question refers to a certain proposition from the
concept map.
For the designed Concept Map it has been
derived a general graph in which edges are
represented by the propositions from the Concept
Map. For each edge the domain knowledge expert
(i.e. course manager) assigned a specific weight.
After the setup has been put in place, the learners
started using the platform. At request, from the
general graph there was derived the learner’s
associated graph and on this one there may be
performed calculus such that the level of knowledge
regarding the chapter may be estimated at
proposition level. These calculus represent the
annotations in the original concept. The annotated
concept map represents what the learner finally
receives upon his request.
The calculus logic computes the knowledge of
the student regarding the chapter as a knowledge
weight. This weight is computed as a function of
proposition’s weight, number of questions assigned
to that proposition, the number of correct answered
questions and number of wrong answered questions.
This whole mechanism represents the
functionality of a decision support system that runs
along the Tesys e-Learning platform.
REFERENCES
Ausubel, D. P., Novak, J. D., & Hanesian, H., 1978.
Educational psychology: A cognitive view (2nd ed.).
New York: Holt, Rinehart and Winston.
Burdescu, D.D., Mihăescu, M.C., 2006. Tesys: e-Learning
Application Built on a Web Platform. In Proceedings
of International Joint Conference on e-Business and
Telecommunications, pp. 315-318, Setubal, Portugal.
INSTICC Press.
Edwards, J., & Fraser, K. (1983). Concept maps as
reflections of conceptual understanding. Research in
Science Education, 13, 19-26.
Holden, C. ,1992. Study flunks science and math tests.
Science Education, 26, 541.
Jonassen, D.H., Reeves, T.C., Hong, N. Harvey, D., &
Peters, K. (1997). Concept mapping as cognitive
learning and assessment tools. Journal of Interactive
Learning Research, 8 (3/4), 289-308.
Kommers, P., & Lanzing, J. (1997). Student´s concept
mapping for hypermedia design. Navigation through
the world wide web (WWW) space and self-
assessment. Journal of Interactive Learning Research
8(3/4), 421- 455.
McDaniel,E., Roth, B., and Miller, M. “Concept Mapping
as a Tool for Curriculum Design”, Issues in Informing
Science and Information Technology
Mineau, G.W., Missaoui, R., & Godinx, R. (2000).
Conceptual modeling for data and knowledge
management. Data and Knowledge Engineering, 33,
137-168.
Mintzes, J. J., Wandersee, J. H., & Novak, J. D. (2000).
Assessing science understanding: A human
constructivist view. San Diego: Academic Press.
Novak, J. D. (1977). A Theory of Education. Ithaca, NY:
Cornell University Press.
Novak, J. D. (1990). Concept maps and vee diagrams:
Two metacognitive tools for science and mathematics
education. Instructional Science, 19, 29-52.
Novak, J. D. (1998). Learning, Creating, and Using
Knowledge: Concept Maps as Facilitative Tools in
Schools and Corporations. Mahwah, NJ: Lawrence
Erlbaum Associates.
Novak, J. D., & Gowin, D. B. (1984). Learning How to
Learn. New York: Cambridge University Press.
Shavelson, R.J., Lang, H., & Lewin, B. (1994). On
concept maps as potential “authentic” assessments in
science. (Technical Report 388). Los Angeles: UCLA,
Center for the Study of Evaluation (CSE/CRESST).
Vecchia, L., Pedroni, M. (2007). Concept Maps as a
Learning Assessment Tool. Issues in Informing
Science and Information Technology, Volume 4.
BUILDING A DECISION SUPPORT SYSTEM FOR STUDENTS BY USING CONCEPT MAPS
135
