
GENETIC FEATURE SELECTION AND STATISTICAL
CLASSIFICATION OF VOIDS IN CONCRETE STRUCTURE
G. Acciani, G. Fornarelli, D. Magarielli and D. Maiullari
Departement of Electrical and Electronical Engineering, Politecnico di Bari, Via E. Orabona 4, 70125 Bari, Italy
Keywords: Ultrasonic waveforms, Non-Destructive Techniques, Concrete Structure, Genetic algorithms, k-NN.
Abstract: In this work simulated ultrasonic waveforms in a concrete specimen obtained by a software based on finite
element method were used to develop an automatic inspection method. A piezoelectric transducer is used to
generate stress waves that are reflected by voids. Then the waves are received by another transducer set at a
fixed distance from the first one on the same specimen surface. Time and frequency features has been
extracted from the waveforms, the most significant features have been chosen by a genetic feature selection
and the classification performances were estimated referring to a k-NN classifier.
1 INTRODUCTION
Concrete structures like bridges, tunnels, walls or
infrastructures require periodic inspections and
quality control to assess their structural integrity. In
order to track and evaluate the symptoms of
deterioration or damage that may compromise
service quality or safety, many advanced Non-
Destructive- Techniques (NDT) have been
developed and applied (Berriman, 2006).
During the last years, the methods based on the
propagation of ultrasonic waveform have attracted
researcher’s interests due to their effectiveness in the
localization of structural components and internal
defects like cracks or voids, particularly the pulse-
echo method is a common, simple and suitable
approach for field operation test. By driving a
dynamic force via a piezo-electric element, elastic
waves are generated and propagated in concrete
where the stress waves are scattered, reflected,
attenuated and resonated. A receiver is used to detect
the arrival of reflected waves (echoes), so that the
time of flight (round–trip travel period) of these
waves can be calculated. Wave reflections are
produced by internal defects, interfaces between
materials with different densities and elastic
properties and boundaries of the solid. This method
is used to determine the location of defects or
interfaces by knowing the velocity of stress waves
and measuring their time of flight (Fan
, 2006). Many
methods was developed in which the evaluation of
the travel time of ultrasonic signal echoes is
focalized on defects of large extension (delamination
or cracks). In this paper an automatic inspection
method based on a genetic algorithm and a statistical
approach is proposed. In this method the travel time
estimation is avoided and the localization of defects
with small dimensions is carried out.
In the field of the automatic classification of
defects the greater problems to be solved are how to
extract significant flaw information and how to
interpret this kind of information. In this work, it has
been referred to 71 time and frequency features
characterising ultrasonic waveforms used for the
non-destructive defect detection in not accessible
pipes (Acciani, 2006). The significant flaw
information is then obtained by the feature selection
which is committed to a genetic approach, based on
the k-Nearest Neighbor (k-NN) classifier.
2 ULTRASONIC PROPAGATION
In this work the considered test is an homogeneous
isotropic concrete specimen whose geometric and
physical properties are summarized in Table 1.
On a free surface of the test specimen, a
transducer consisting of a piezoelectric thin layer
generates the stress waves which are detected from a
receiver situated on the same side of the emitter
(indirect transmission).
231
Acciani G., Fornarelli G., Magarielli D. and Maiullari D. (2008).
GENETIC FEATURE SELECTION AND STATISTICAL CLASSIFICATION OF VOIDS IN CONCRETE STRUCTURE.
In Proceedings of the Tenth International Conference on Enterprise Information Systems - AIDSS, pages 231-234
DOI: 10.5220/0001692802310234
Copyright
c
SciTePress

Table 1: Geometric and physical characteristics of
concrete specimen.
Quantity Value
Width (x
2
) 1.0 m
Depth (x
3
) 0.3 m
Height (x
1
) 1.0 m
Young's Modulus E=25×10
9
Pa
Density ρ=2300 kg/m
3
Poisson's ratio ν=0.33
First Lamé constant μ=9.398496×10
9
Pa
Second Lamé constant λ=1.824414×10
10
Pa
Velocity of longitudinal wave v
P
= 4013.08 m/s
Velocity of transversal wave v
S
= 2021.46 m/s
Velocity of surface wave v
R
= 1884.00 m/s
The piezoelectric layers are Piezo Zirconate
Titanate (PZT 27) commonly employed in ultrasonic
techniques whose diameter is D=0.05 m,
piezoelectric constant d=425×10
-12
m/V, strain-
voltage constant h=1,46×10
9
V/m. The excitation
voltage applied to the piezoelectric layer is an
Hamming windowed sinusoid, with a duration of
three periods, whose analytical expression is given
by the following equation:
() ()
eM
1f 3
Vt V 1 2π t2πft t [V]
23 f
⎡⎤
⎛⎞
⎛⎞ ⎛⎞
=⋅ − ⋅ ⋅≤
⎢⎥
⎜⎟
⎜⎟ ⎜⎟
⎝⎠ ⎝⎠
⎝⎠
⎣⎦
cos sin
(1)
where f is the central frequency excitation and V
M
is
the amplitude of the sinusoid. The ultrasonic waves
propagation has been analyzed on the plane
containing the transducer axis as shown in figure 1.
The propagation in the specimen under test in
absence of body forces can be written as follows
(Rose, 1999):
()()
2
2
2
ρλμ μ
t
∂
=+∇∇⋅+∇
∂
u
uu
(2)
where
T
123
[u u u ]=u
is the displacement field.
Moreover, appropriate boundary conditions must
be added to these equations. At free surfaces it is
requested that the traction vector vanish, thus
boundary conditions are:
⋅=σ n0
(3)
where σ is the stress tensor and
[]
T
123
nnn=n
is the outward unit normal to the boundary.
On each point of the contact surface between the
specimen and the emitter the displacement values
have been imposed by the equation:
Figure 1: Simulation.of Set-up.
()
3e
udVt=⋅
(4)
The displacements on the contact surface
between the specimen and the receiver are
proportional with the voltage across the piezoelectric
transducer through the strain-voltage constant h:
(
)()
r3
Vt hu t=⋅
(5)
The software used to simulate the considered
case is Comsol 3.3, a commercial code based on the
Finite Element Method (FEM). The considered
simulation have been carried out considering an
excitation frequency f=70 kHz, an analysis time
T=4×10
-4
s, a quad mapped mesh with dimension
sides m=0.6 cm. Such value of m corresponds to
1/10 of the central frequency wavelength, in order to
guarantee the numerical accuracy provided by the
solution algorithm.
In figure 2 a) the qualitative progress of the
wavefronts for the specimen previously considered
with two square voids (side dimensions 2 cm) are
depicted. Particularly, the radiation field at 78% is
pointed out by the oblique lines. It means that the
displacement amplitude of a point of fixed
wavefront reduces to the 78% compared with the
displacement amplitude of a point belonging to the
same wavefront and aligned with the transducer
axis. The two considered defects are placed on the
center of the radiation field and on the same
wavefront on the border of the radiation field.
Figures 2 b) and 2 c) represent u
3
displacement
waveforms evaluated on the same position of the
emitter for the central and not central defect,
respectively. It is possible to note that in the second
case the echo amplitude due to the defect could be
undetectable in the presence of noise.
Transducer axis
Receiver
Analysis plane
Concrete specimen
ICEIS 2008 - International Conference on Enterprise Information Systems
232

Figure 2: Comparison between u
3
displacements: a)
defects position; b)waveform for defect aligned with
transducer axis; c) waveform for defect aligned with the
radiation field border.
For these reason the defects considered in the
present work are placed all in the radiation field
previously defined.
3 DIAGNOSIS APPROACH
In this section the proposed approach to classify the
defects on concrete structures is discussed.
A set of 71 parameters characterising ultrasonic
waveforms have been extracted from the simulated
waveforms. The most significant features have been
chosen by a genetic feature selection (Muni, 2006).
GA are a class of robust problem-solving
techniques based on a population of possible
solutions, which evolve through successive
iterations by means of the application of three
genetic operators: selection, crossover and mutation.
A solution is represented by a finite sequence of
0’s and 1’s called chromosome. For the problem of
feature selection, a chromosome has length d that
corresponds to the total number of features. A ‘0’
represents a rejected feature, whereas a ‘1’ stands for
a selected feature.
To start the solution process, the GA has to be
provided with an initial population. The most
commonly used method is the random generation of
initial solution for the population. Then the
chromosomes are allowed to ‘crossover’: two
chromosomes, generally selected with a random
criterion, exchange their parts at a chosen point to
create two new chromosomes. Chromosomes are
also allowed to ‘mutate’: by flipping one or more
bits can be made to a chromosome.
The optimization process is carried out in
‘generations’, each time a population of new
chromosomes is generated, until some criterion is
met. The most commonly used terminating criterion
is the maximum number of generations.
Since the population size is finite, only the ‘best’
chromosomes are allowed to survive. The various
generations experience the processes of crossover
and mutation each of which happens with a certain
probability. The mechanism of crossover interests a
subset of the population that is identified by means
of a criterion of ‘selection’, chosen from these
available in literature. There is also a mechanism of
replication (or ‘elitism’) according to which no
change is made and a certain number of individuals
is simply copied from the current generation to the
next. The next generation is chosen from the new
individuals created and from the previous generation
according to a fitness function that allows to
calculate a fitness score for each of the
chromosomes. In the genetic feature selection, it is
critical to design an appropriate fitness function to
avoid local minima. Traditionally, in the GA-based
feature selection problems, the fitness function used
is simply a hit rate function. The fitness function
considered in this paper takes into account the
classification performance and the ratio between the
used features and the number of all defined features.
In particular, the classification performance has been
estimated referring to k-NN classifier and the
analytical expression of the considered fitness
function is:
()=−
i
i
X
fitness f X
D
α
(6)
where f(.) is the hit rate,
i
X
is the number of
selected features for the chromosome
i
X
, D is the
number of all the measured features, α is a de-
emphasis coefficient that has been fixed equal to
1/10. α coefficient sets the weight of the number of
the features compared with the classification rate.
Some preliminary experiments were carried out
to try out an optimal set of operators and parameters
of the GA useful for the investigation considered in
this work. With the experience gained from these
explorations, the parameters have been set as shown
in the Table 2.
a)
Time 8,5×10
-5
s - u
3
displacement
RADIATION FIELD TO 78% - f = 70 kHz -
D = 5 c
m
b)
u
3
Displacement [m]
Time [ms]
Time [ms]
u
3
Displacement [m]
defect echo
defect echo
c)
GENETIC FEATURE SELECTION AND STATISTICAL CLASSIFICATION OF VOIDS IN CONCRETE
STRUCTURE
233
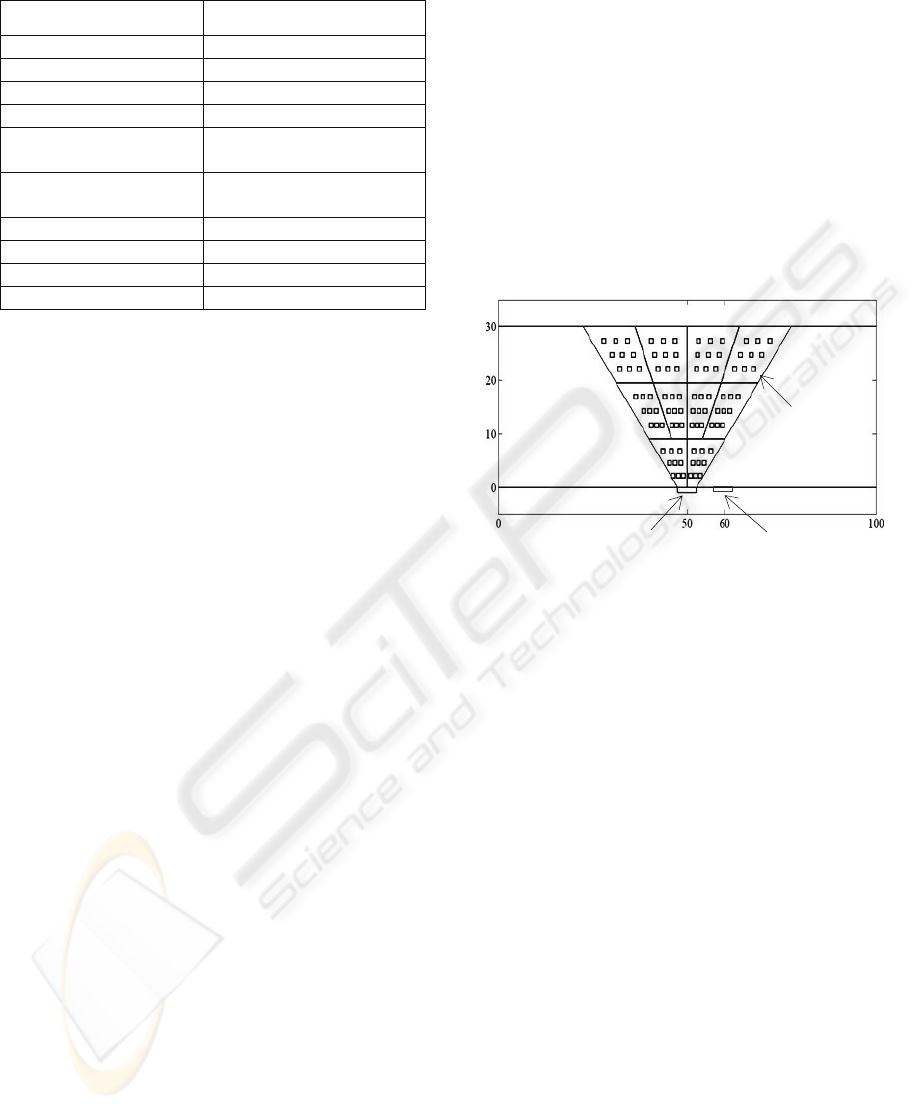
Table 2: Description of genetic algorithm parameters.
GA parameters settings Value or type
Initial population choice Random
Population size 100
Number of generations 100
Selection criterion Roulette wheel
Elitism (nr. of unchanged
individuals)
10
Crossover (nr. of selected
individuals)
50
Crossover rule Single point crossover
Crossover probability 1
Mutation probability 0.02
Termination criterion Maximum nr of generations
4 EXPERIMENTAL RESULTS
AND DISCUSSION
In order to test the proposed localization method, a
database of 90 simulated ultrasonic waveforms has
been obtained adopting the specimen and the
configuration analysis described in Section 2. In this
test case, 10 classes of defects with different
positions, inside the transducer radiation field, and 9
square voids (side 2 cm) for each class have been
considered, as shown in figure 3. Finally, the
collected signal set has been contaminated and
augmented by additive white Gaussian noise
considering four noisy waveforms for each signal of
the database. The extended data set of 90×4=360
waveforms, has been randomly divided into training
subset (90%) and test subset (10%) with the aim to
examine the robustness of the automatic
interpretation scheme. By according the above
described method, the 71 time and frequency
domain parameters for each waveform of the
database have been evaluated. Then the genetic
feature selection based on k-NN algorithm has been
used to select the optimal feature set for voids
position classification. The performances of k-NN
have been evaluated in terms of Mean Classification
Error (MCE), that is calculated as the mean of the
errors in the classification of the test set waveforms.
The better results have been obtained with the
number of neighbours k = 3 for the k-NN. In this
case, the MCE starts from a value of 38.89% in
correspondence of the whole set of 71 features, but
the GA-based feature reduction allows it to increase
up to the value of 97.22% with a selection of only 7
significant features listed below: Difference between
50% level and 25% level (spectrum CD); Difference
between 75% level and 25% level (spectrum CD);
Difference between 90% level and 25% level
(spectrum CD); Global rise frequency between 25%
level and peak of spectrum; Global rise frequency
between 50% level and peak of spectrum; Global
fall frequency between peak of spectrum and 50%
level; Global rise variance between 25% level and
peak of spectrum (CD = cumulative distribution).
The results show that the adopted method
provides a low error rate for the identification of
position of voids. Therefore, it would be a contribute
to develop an automatic method to localize defects
by means of ultrasonic analysis in concrete
structures. Future works will be devoted to a more
accurate identification of the position of voids.
Figure 3: 10 classes of defect in the radiation field.
REFERENCES
Berriman, J. R., Hutchins, D. A., Neild, A., Gan, T. H.,
Purnell, P., 2006. “The application of time-frequency
analysis to the air-coupled ultrasonic testing of
concrete”, IEEE Transactions on Ultrasonics,
Ferroelectrics and Frequency Control, Vol. 53, pp.
768 – 776.
Fan, X., Zuo, M.J., Wang, X., 2006. “Application of
stationary wavelet transforms to ultrasonic crack
detection”, Canadian Conference on Electrical and
Computer Engineering, pp. 1432 – 1436.
Acciani, G., Brunetti, G., Chiarantoni, E., Fornarelli, G.,
2006, “Automatic Evaluation of Flaws in Pipes by
means of Ultrasonic Waveforms and Neural
Networks”, International Joint Conference on Neural
Networks Sheraton Vancouver Wall Centre Hotel,
Vancouver, BC, Canada, pp. 892 - 898.
Rose, J. L., 1999, Ultrasonic Waves in Solid Media,
Cambridge University Press.
Muni, D.P., Pal, N.R., Das, J., 2006, “Genetic
programming for simultaneous feature selection and
classifier design”, IEEE Transactions on Systems,
Man and Cybernetics, Part B, Vol. 36, pp. 106 – 117.
Square void
Emitter
Receiver
ICEIS 2008 - International Conference on Enterprise Information Systems
234
