
EXPLORATIVE ASSOCIATION MINING
Cross-sector Knowledge for the European Home Textile Industry
Jessica Huster, Michael Spenke and Gerrit Bury
Fraunhofer-Institute for Applied Information Technology FIT, Schloss Birlinghoven, 53754 Sankt Augustin,Germany
Keywords: Data mining, association analysis, ontology-based knowledge flow system.
Abstract: The European home-textile industry lacks cross-sector knowledge and knowledge about its end consumers.
Click and ordering data reflect the consuming behaviour as well as the preferences and their changes. They
are therefore an important trend indicator, which is not harnessed up to now by this industry sector. In this
paper, we report on the solution of the Trend Analyser association mining component that helps designers
and product developers to better understand their end consumers. Our component uses explorative data
mining to perform a market basket analysis and identify interesting associations. Such associations can help
decision makers to understand and study the consuming behaviour and identify early changes in their
preferences in order to perform a better production planning.
1 INTRODUCTION
For trend-related industries like the European home-
textile industry flexibly adjusting to continually and
very quickly changing preferences and consuming
behaviour is a big challenge (Lakin, 2004). If the
producers misinterpret or even overlook trends, their
production planning is untargetetd and consequently
non-marketable products will stick to the stocks
while on the other hand existing market potentials
cannot be leveraged. It is therefore facing a severe
economic risk. In addition this sector suffers from
limited communication between producers.
Communication is only performed with direct
customers and and a common knowledge base of
product and ordering data, or even consumer
preferences does not exist.
In this paper we present the Trend Analyser
explorative data minng component and its
evaluation, in the context of the European project
AsIsKnown (Henning, 2007). This expert module
analyses ordered products and consumer behaviour
to enable quick reaction to new trends.
Classical, pure automatic association mining
approches need a cleaned and transformed data set,
which may lead to a major effort in big data
warehouses containing a lot of noise. An explorative
approach with a higher degree of interaction is
expected by the experts of the textile industry to
establish trust in the mining results. In addition,
explorative tools promote a better and deeper
understanding of the data analysed. New ideas are
generated and can be verified again in the search
process (Keim, 2002).
The contribution of this work is an explorative
association mining analysis tool especially for
knowledge workers in creative application domains.
The tool visualises data in a qualified and highly
condensed way for a goal oriented determination of
rules. Extensive evaluation with product designers
and marketing specialists proved the efficiency of
our approach in the home textile industry.
Section 2 shortly present the context of
AsIsKnown. Section 3 presents our association
miner prototype and section 4 reports on the
comparative evaluation and its results with
producers from the home textile sector.
2 AsIsKnown SYSTEM
AsIsKnown (Henning, 2007) aims to establish an
ontology based knowledge flow system which stores
manufacturer and retailer spanning product data and
observes buying and click behaviour of consumers
and interior designers. The AsIsKnown system is
hosted by a trusted third party, (e.g. the European
Textile umbrella association Euratex.), that performs
the cross sector market basket analysis while
ensuring that no critical information (e.g. turnover or
500
Huster J., Spenke M. and Bury G. (2008).
EXPLORATIVE ASSOCIATION MINING - Cross-sector Knowledge for the European Home Textile Industry.
In Proceedings of the Tenth International Conference on Enterprise Information Systems - AIDSS, pages 500-503
DOI: 10.5220/0001701105000503
Copyright
c
SciTePress

selling prices) is revealed. In addition anonymisation
algorithms (data modification and privacy
preserving) are used.
The virtual interior designer (VID) is
AsIsKnown’s customer consulting and ordering
system. Products are displayed according to
characteristics and preferences of the customer as
different style worlds in showrooms, where the user
can try out different product combinations.
Consumer behaviour is logged and stored in a data
warehouse which also stores (aggregated) ordering
data from producers. The association miner accesses
the data warehouse and enables market basket
analysis on these data, to analyse frequent
combinations of products and features. The analysis
is performed by expert users of the trusted third
party. The trends are formulated as association rules
into the rule editor based on a commonsense
ontology. The Smart Profiler (SP) identifies
preference changes of customer groups in these
rules, e.g. which age-group prefers which design
style or which colour is favored by which group of
customers and generates new style worlds, to
advance customer related product proposals in the
VID. Trend rules are also provided to producers as
trend reports. See (Becks, 2007) for the overall
design of AsIsKnown’s Trend Analyser.
2.1 Detecting Association Rules
For association mining, we use the flexible
explorative visual data mining tool InfoZoom
(Spenke, 2001), developed at Fraunhofer FIT. It uses
special information visualisation and interaction
techniques to support the user in analysing and
gaining a deep understanding of the data. The
interaction possibilities offered are based on the
Information Seeking Mantra (overview, zoom and
filter, details on demand) (Shneiderman, 1996).
InfoZoom displays data with attributes as rows
and their values as columns. In the AsIsKnown data
warehouse each entry represents a transaction of a
customer visit in the VID. Selection of values
restricts the table to this value (zoom in). Clicking
on the arrow outline right of an attribute sorts the
table by that attribute. The user can see all values of
the attributes at a glance by using the so called
“compressed mode” (Figure 1). This view causes
that adjacent cells, having identical values, namely
the attribute values presented in columns, are
merged. The width of each cell indicates the number
of objects with this specific value. Cells with
numeric values, too small to be labelled with the
related value, are represented through a horizontal
line. The level of that line reflects the height of the
value.
Interesting dependencies between different
attributes can be identified by performing
consecutive sorts in the “compressed mode”.
Suppose we would like to verify if the attribute
age=20+ and the attribute style preferences do have
an interesting correlation. Figure 1 (top) shows the
customer attributes and their values for all
transactions of all customers. The attributes have
been sorted by style preference and age. Each style
preference is preferred by some customers of every
age. However, customers of age older than 20 seem
to prefer mainly the style pop. Zoom in (double
click) this customer group, as it is shown in Figure 1
(bottom) confirms this observation. Measurements
such as support, confidence, lift, etc., typically
calculated in association mining, are done based on
performing counts of different item groups. These
counts are calculated by defining new, “derived”
attributes in InfoZoom. These attributes store
functions to perform calculations on already existing
attributes.
The following steps are performed to determine the
measurements for the rule: Count of basic
population. Zoom in the body, i.e. double click at the
cell age = 20+. Count of the items for which holds
age = 20+. Zoom in style preference = pop, the
zoom of the body is still fixed, meaning that we can
now count the number of items age= 20+
∪
style
preference = pop, now. Zoom out the body, hence
double click on age= 20+. Count of items for which
the head (style preference = pop) holds.
3 EVALUATION
In this section we report on the evaluation of the
Association Miner. The evaluations were based on
questionnaires and “thinking aloud” protocol. The
aim was to evaluate the procedure of rule detection
and measures and to evaluate the quality of the
results and their usefulness for the producers. The
evaluation was performed in two steps.
According to the relevant questions of the producers
(Which type of customer buys what? Which kind of
products are bought in conjunction?), we developed
a questionnaire with different scenarios. In a second
evaluation step the calculated rules were evaluated
through producers, concerning their usefulness. This
step was performed in comparison to the fully
automatic association mining tool WEKA (Witten,
2005).
EXPLORATIVE ASSOCIATION MINING - Cross-sector Knowledge for the European Home Textile Industry
501
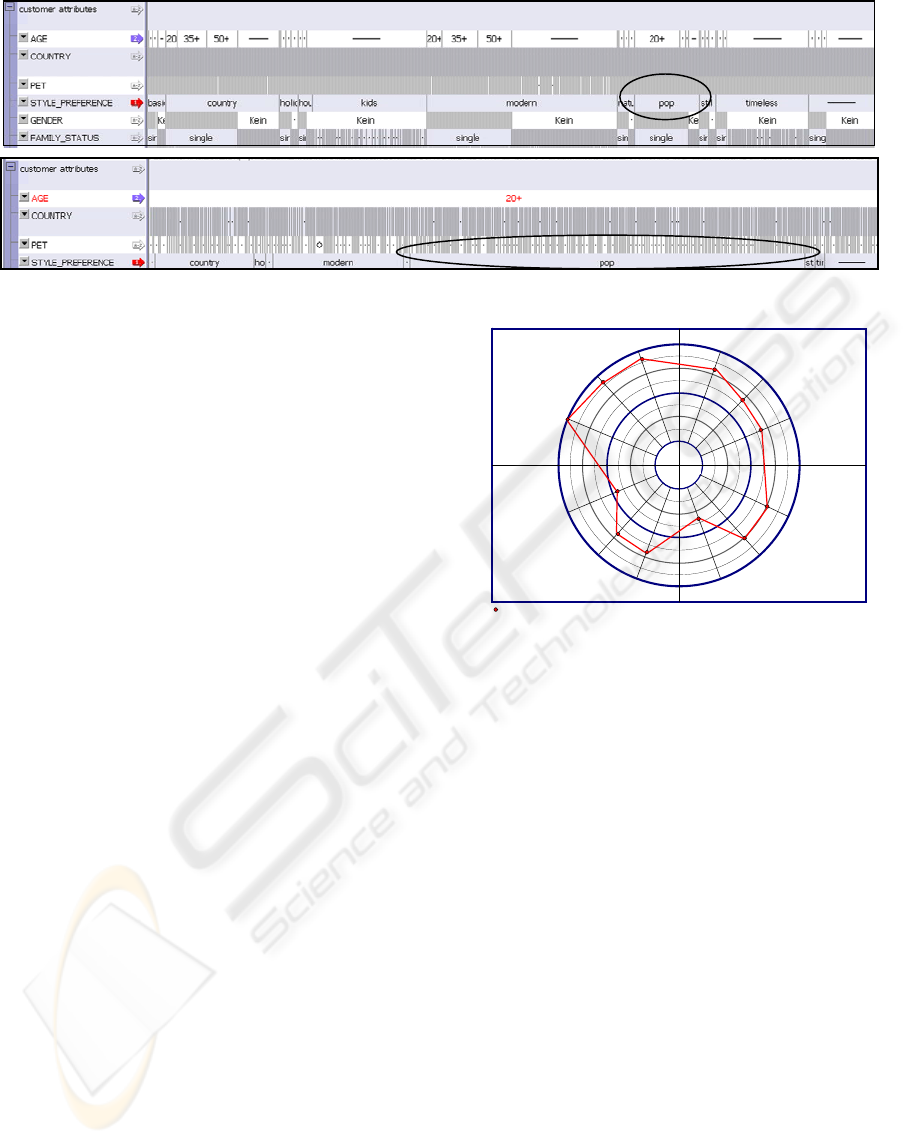
Figure 1: Frequency based distribution of style preferences of all customers (top) and of customers older than 20 (bottom).
3.1 Procedure of Rule Detection
The evaluation was performed with different data
analysis experts. All the experts have a quite good
experience in using data analysing tools, and have
some experience in using association mining tools.
They do not have any experience in the home textile
sector. Before the evaluation the users were trained
(about 60 min) in using the tool for detection of
association rules and calculation of measures. All in
all the users had to find rules for four different tasks:
in task A the users had to find answers to some
questions. In task B the users had to find rules
related to the question: “Which type of customers
buys what?”. Task C asked for rules related to
product combinations only “Which combinations are
bought by customers older than 50 years?”. Task D
finally relates to customer attributes; “Which kind of
correlations exist for the customers?”. Figure 2
presents the results of that part of the evaluation.
The users were easily able to solve task A and
evaluated the search effort as low. The search effort
for task D was the heaviest, though the users were
satisfied with their results. Task B in comparison to
task D requires the comparison of product and
customer attributes, what lowers the trust in the
results. In task C the satisfaction with the results is
the worst because of the usage of “list attributes”,
which represents the products bought in conjunction
through a list of values. These attributes are more
complicated to handle during calculation of
measurements. Altogether, the users evaluated the
procedure of rule calculation as good and
practicable. All candidates would use InfoZoom
again for similar tasks. They indicated to have a
good overview and insight in the data after the
evaluation. This result confirms the effectiveness of
explorative approaches (Keim, 2002).
Task A Task B
Task DTask C
+1 +20-1
-2 = (very bad /low) … +2 = (very good / high)
Evaluation of InfoZoom
-2
(average of all 5 candicates
)
Satisfaction concerning
expenditure of time
satisfaction
concerning found
results
-2
-1
0
+1
+2
How straightforward / intuitive
was the search
Satisfaction concerning
found results
Satisfaction concerning
expenditure of time
How
straightforward /
intuitive was the search
satisfaction concerning
found results
Satisfaction concerning
expenditure of time
How straightforward /
intuitive was the
search
satisfaction
concerning found
results
Satisfaction concerning
expenditure of time
How straightforward /
intuitive was the search
Figure 2: Average results for the usage of the association
miner in the different scenarios.
3.2 Quality of Results
To evaluate how useful the rules are to improve the
cross-sector knowledge, the users evaluated the rules
in comparison to rules generated fully automatically
with WEKA (Waikato Environment for Knowledge
Analysis) (Witten, 2005). WEKA uses the apriori
algorithm to calculate association rules. A
disadvantage of this algorithm is that it only works
on nominal attributes. Numerical attributes ( e.g,
price, age) have to be discretised, leading to
categories (price category low with values from one
thousand till ten thousand). InfoZoom however
works on all kind of attributes. WEKA identifies
and lists all interesting rules (and its measures)
within specified parameters minsupport and
maxconfidence. Attributes, not needed for the
analysis, have to be deleted from the database before
the analysis with WEKA. Using InfoZoom data
selection and transformation (removing of noise) can
be performed directly in this tool. All in all the
workload necessary for adapting the data pool for
analysis according to different query contexts is
bigger for WEKA than for InfoZoom.
ICEIS 2008 - International Conference on Enterprise Information Systems
502
Task A Task B
Task DTask C
Level of detail
of rules
degree of
knowledge coverage
+1 +20-1
-2 = (very bad / low) … +2 = (very good / high)
WekaInfoZoom
-2
(Average of all 6 candidates)
Expressiveness
of result A1
Expressivness
of result A2
Level of detail of rules
degree of knowledge
coverage
Level of detail of
rules
degree of
knowledge coverage
-2
-1
0
+1
+2
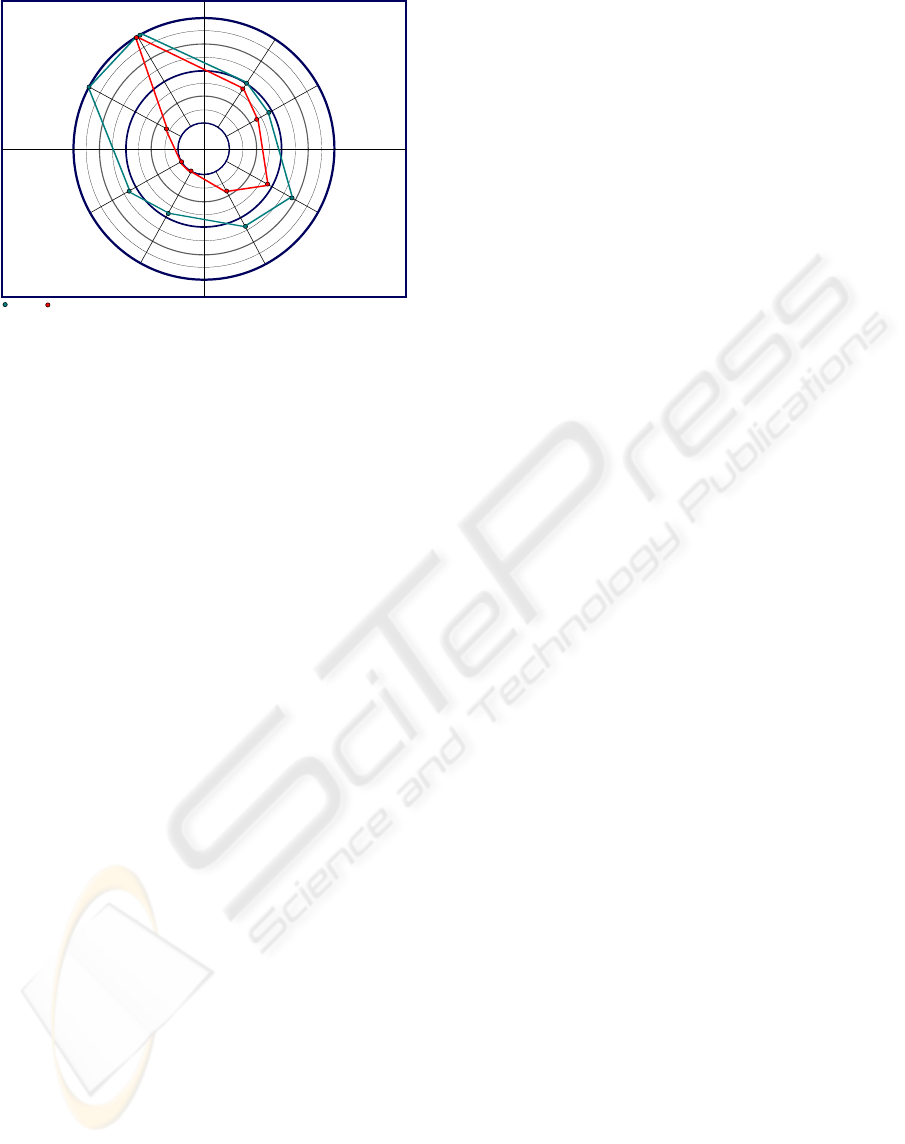
Figure 3: Evaluation of analysis results of InfoZoom in
comparison to WEKA.
Figure 3 represents the evaluation results
concerning the questions if the rules are detailed
enough or if the producers prefer rules with more
specified attributes and in how far the presented rule
list satisfy the producer’s knowledge need. The net
graph shows that InfoZoom outperforms WEKA.
The producers clearly favour the more targeted rule
list containing a manageable amount of rules,
identified using InfoZoom. WEKA delivers more
results which mean better knowledge coverage in
principal. But a lot of trivial rules are listed and
additional work is needed, to identify the really
interesting and useful rules. The ratio of the whole
number of detected rules to the number of useful
rules is higher in InfoZoom than in WEKA.
4 CONCLUSIONS
The home textile industry misses a cross-sector
analysis, to detect current and future trends. We
presented our solution and its evaluation in the
context of the AsIsKnown project.
The explorative approach has clear advantages
and provides goal oriented detection of rules and a
better flexibility concerning data selection and
different questions of the producers. The user can
verify his hypothesis, gets a good insight into the
data and is able to draw conclusions (Holten, 1997).
Working with noisy data, which is a common
problem with business data, is easier in InfoZoom
than in WEKA. Also, configuring analysis
parameter in WEKA is quite complicated and cannot
be controlled in the same detail as in InfoZoom.
Many of the rules generated with pure automatic
association miners represent common knowledge
and trivial coherences to the producers. In many
cases the measurements used attest this rules a high
degree of interest and are therefore misleading.
Furthermore, automatic systems would not be
accepted by this particular user group which is used
to a rather creative and weakly structured way of
working. In WEKA different database exports have
to be performed to adapt the data set to different
analysis questions.
Via scripting the computation of measures in
InfoZoom could be performed automatically and
more effective.
ACKNOWLEDGEMENTS
AslsKnown (http://www.asisknown.org) is funded
within the Information Society Technologies (IST)
Priority of the Sixth Framework Programme (FP6)
of the European Commission.
REFERENCES
Becks, A., Huster J., (2007). Trend Analysis Based On
Explorative Data and Text Mining – A DSS for the
European Home Textile Industry. Proc. of 9th Int.
Conf on Ent. IS (ICEIS), Funchal, Madeira.
Lakin, W.H. (2004) Euratex: European Technology
Platform for the Future of textiles and clothing. A
Vision for 2020. Euratex
Henning, K., Backhaus, W., Rick, U. (2007) AsIsKnown –
Selling through the customers eyes! Amsterdam: IOS
Press, 113-120.
Holten, R. (1997) Die drei Dimensionen des Inhalts-
aspektes von Führungsinformationssystemen,
Arbeitsberichte d. Inst. für WI, Universität Münster.
Keim D. A. (2002), Information visualization and visual
data mining,.IEEE Trans. Visualization and Computer
Graphics, 8(1)
Shneiderman, B. (1996) The Eyes Have It: A Task by
Data Type Taxonomy for Information Visualizations.
Proc. of the IEEE Symposium on Visual Languages,
Washington. IEEE Computer Society Press
Spenke,M. (2001). Visualisation and Interactive Analysis
of Blood Parameters with InfoZoom. Artificial
Intelligence in Medicine, volume 22, No.2, S.159-172
Witten, I., Elbe, F. (2005),Data Mining. Practical
Machine Learning Tools and Techniques. Morgan
Kaufmann Publishers, San Francisco, second edition
EXPLORATIVE ASSOCIATION MINING - Cross-sector Knowledge for the European Home Textile Industry
503
