
A DECISION SUPPORT SYSTEM FOR INTEGRATED
ASSEMBLY AND DISASSEMBLY PLANNING USING A GA
APPROACH
Yuan-Jye Tseng, Hsiao-Ting Kao and Feng-Yi Huang
Department of Industrial Engineering and Management, Yuan Ze University
135 Yuan-Tung Road, Chung-Li, Taoyuan 320, Taiwan
Keywords: Decision support system, Product life cycle management, Assembly planning; Disassembly planning.
Abstract: In a decision support system for a complete product life cycle management, both assembly planning and
disassembly planning need to be considered for producing an assembled product. To produce an assembled
product, an assembly planning scheme is required to generate a proper assembly sequence with which the
components can be grouped and fixed to construct a final product. At the end of the product life cycle, a
disassembly planning scheme is performed to generate a disassembly sequence to disassemble and recycle
the product. In this research, a new decision support system for a complete product life cycle management
by integrating assembly and disassembly planning is presented. First, the spatial relationships of the
components and the precedence of the assembly and disassembly operations are analyzed. Second, a
genetic algorithm approach is applied to evaluate the integrated assembly and disassembly costs to find the
good assembly sequences and disassembly sequences. A cost function by integrating the assembly costs
and disassembly costs is formulated and used as an objective function. An example product is demonstrated
and discussed. The test result shows that the decision support system is feasible and effective for
integrating assembly and disassembly planning with a complete product life cycle management.
1 INTRODUCTION
In a complete product life cycle management system
of an assembled product, both an assembly sequence
and a disassembly sequence are required. An
assembly sequence is required to produce a new
product by applying a series of assembly operations
on a group of components at the start of the life
cycle. A disassembly sequence is needed to
decompose the product into disposable or recyclable
parts or components by applying a series of
disassembly operations at the end of the life cycle.
The main purpose of assembly planning (assembly
sequence planning) is to arrange a proper assembly
sequence with which the components can be
grouped and fixed together to build a final product.
The assembly sequence can be defined as an ordered
sequence of assembly operations required to produce
a product. On the other hand, the purpose of
disassembly planning (disassembly sequence
planning) is to arrange a disassembly sequence with
an ordered disassembly operations for disassemble a
product. Therefore, in a decision support system for
a complete product life cycle management, both the
assembly planning and disassembly planning need to
be considered and integrated.
In the traditional way, the assembly planning
models and the disassembly planning models are
performed as two independent tasks. As a result, the
two planning models are executed separated without
interaction. Therefore, a good assembly sequence
may sometimes contradict the considerations in the
disassembly planning model. In addition, a good
disassembly sequence may not support the
requirements in the corresponding assembly
planning model. Given a set of components, a good
assembly sequence can be planned by considering
the contact and spatial relationships between the
components. A series of assembly operations need
to be determined by analyzing the contact and
spatial relationships between components. Once the
assembly operations are determined, the assembly
operations need to be ordered in sequence by
evaluating the required cost objective in the
assembly planning model. In the traditional
planning scheme, the cost objective considers only
348
Tseng Y., Kao H. and Huang F. (2008).
A DECISION SUPPORT SYSTEM FOR INTEGRATED ASSEMBLY AND DISASSEMBLY PLANNING USING A GA APPROACH.
In Proceedings of the Tenth International Conference on Enterprise Information Systems - AIDSS, pages 348-355
DOI: 10.5220/0001717203480355
Copyright
c
SciTePress

the assembly costs occurred in the assembly
planning scheme.
Traditionally, the assembly sequence is
determined by evaluating the assembly cost
objective. In this case, although a low assembly cost
can be achieved, it may cost more to disassemble the
product at the end of the product life cycle. The key
issue is that an assembly operation with a low cost
may not correspond to a disassembly operation with
the same low cost. In some cases, if a relatively low
cost is used for fixing the two specific components,
it may require a higher cost to perform the
corresponding disassembly operation for separating
the two components. As a result, an assembly
sequence with a low cost may result in a
disassembly sequence with a high cost for the same
product at the end of the product life cycle.
Therefore, a complete decision support system
must include both assembly planning and
disassembly planning. To deal with the special
characteristics of a complete product life cycle,
organizing and sequencing of assembly and
disassembly operations must be considered
concurrently in order to generate an integrated
sequence.
In the related research for assembly planning, it
can be summarized that assembly planning can be
performed in three stages: (1) assembly modelling
and representation, (2) assembly sequence
generation, and (3) assembly evaluation and
optimization. A recent review can be found in
Abdullah et al. (2003). The previous research in
assembly planning can be classified into three
categories. The first category uses rules or
knowledge bases to perform generation of different
assembly sequences such as developed in DeFazio
and Whitney (1987), Heemskerk and Van Luttervelt
(1989), Ye and Urzi (1996), and Swaminathan and
Barber (1996). The second category presents
automatic generation of feasible assembly
sequences using graph representation forms
including the research presented in de Mello and
Sanderson (1991), Santochi and Dini (1992), Lin
and Chang (1993), and Choi et al (1998). The third
category focuses on assembly analysis and
evaluation for searching the better or the optimal
assembly sequence. The research in this class
includes de Mello and Sanderson (1991), Ben-
Arieh, and Kramer (1994), Laperriere and
ElMaraghy (1996), Gottipolu and Ghosh (1997),
Tseng and Liou (2000), and Chen et al. (2004).
With a given set of components, sequencing a
given set of components may become a
combinatorial problem with an explosive number of
potential sequences. From a mathematical point of
view, this is an NP-hard problem with the number of
assembly and disassembly sequences proportional to
the factorial of number of components. From the
solution aspect, genetic algorithms (GAs) have been
proven to be effective and efficient in solving NP-
hard problems such as TSP (traveling salesman
problem). In the research by De Lit et al. (2001),
Chen et al. (2002), Marian et al. (2003), Li et al.
(2003), and Smith (2004), GA method has been
applied to find solutions in assembly planning
models.
In this research, a decision support system for a
complete life cycle management by integrating
assembly and disassembly planning is presented.
First, two graph-based models called assembly
precedence diagram and disassembly precedence
diagram are presented to represent the spatial
relationships of the components and the associated
precedence relationships of assembly and
disassembly operations. Next, two precedence
matrices called assembly precedence matrix and
disassembly precedence matrix are built for
checking the feasible sequences. Finally, several
operation cost functions are developed to evaluate
the costs of the integrated assembly and disassembly
sequences. A method using the genetic algorithm
(GA) approach is developed for finding the solutions
with an objective of minimizing the costs.
In this paper, section 2 presents the graph-based
representation models for integrating assembly and
disassembly planning. Section 3 discusses the cost
functions for evaluating the sequences. Section 4
presents a GA method for finding the solutions.
Section 5 discusses the test results with an example.
Finally, section 6 concludes this study.
2 REPRESENTATION MODELS
The input of the decision support system includes
the definitions of the components, the spatial
relationships of the components, the available
assembly and disassembly operations, and the
associated assembly and disassembly costs. Two
graph-based models are presented to represent the
integrated assembly and disassembly sequences.
The graph-based models can be summarized as
follows.
(1) Assembly precedence diagram (APD),
(2) Disassembly precedence diagram (DPD).
An assembly precedence diagram (APD) is a
directed graph showing the precedence of the
components and the associated assembly operations
(Lin and Chang, 1993). In this research, the concept
of APD is applied to represent the spatial
connectivity relationship and precedence between
A DECISION SUPPORT SYSTEM FOR INTEGRATED ASSEMBLY AND DISASSEMBLY PLANNING USING A GA
APPROACH
349
two components. To assemble a group of
components with collision-free assembly operations,
a proper precedence is specified in the APD. In this
research, the concept is expanded for use in
disassembly planning by defining the disassembly
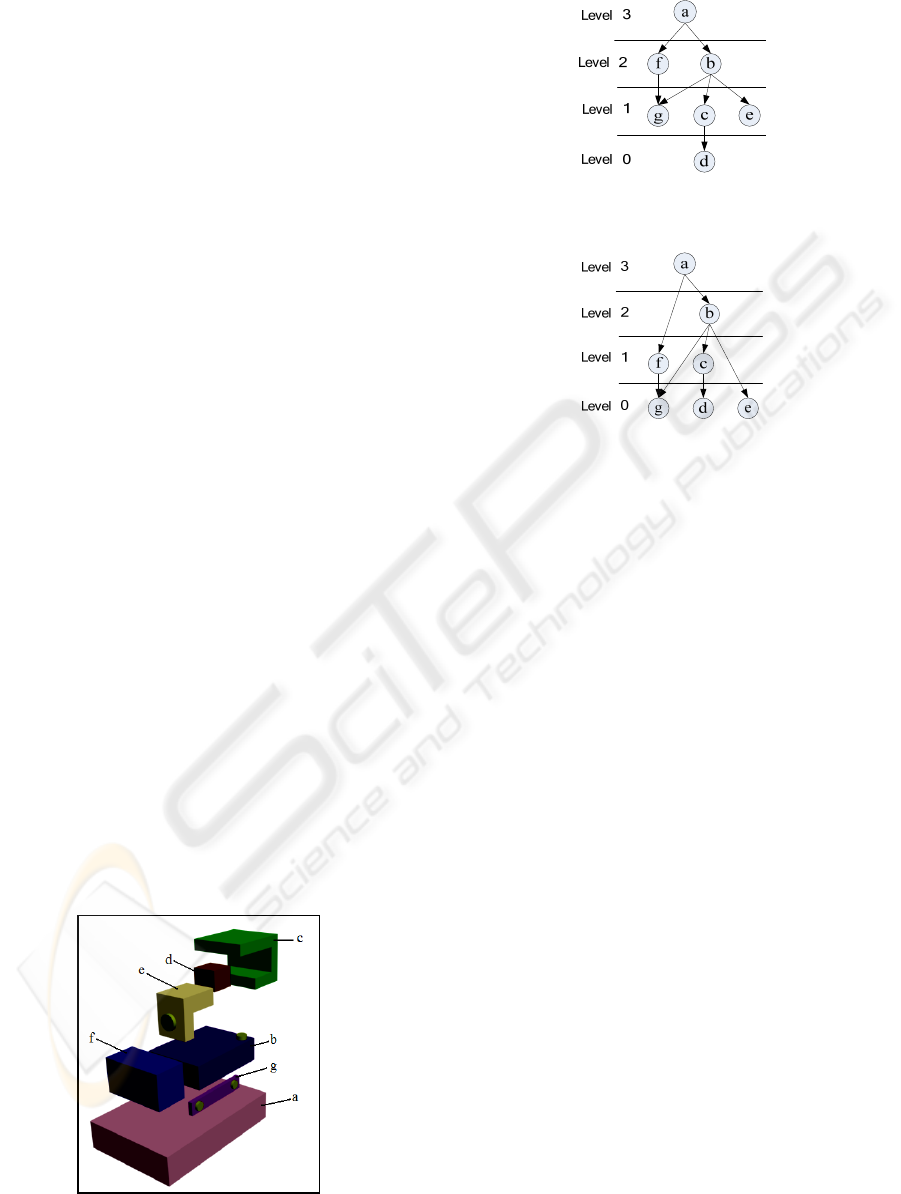
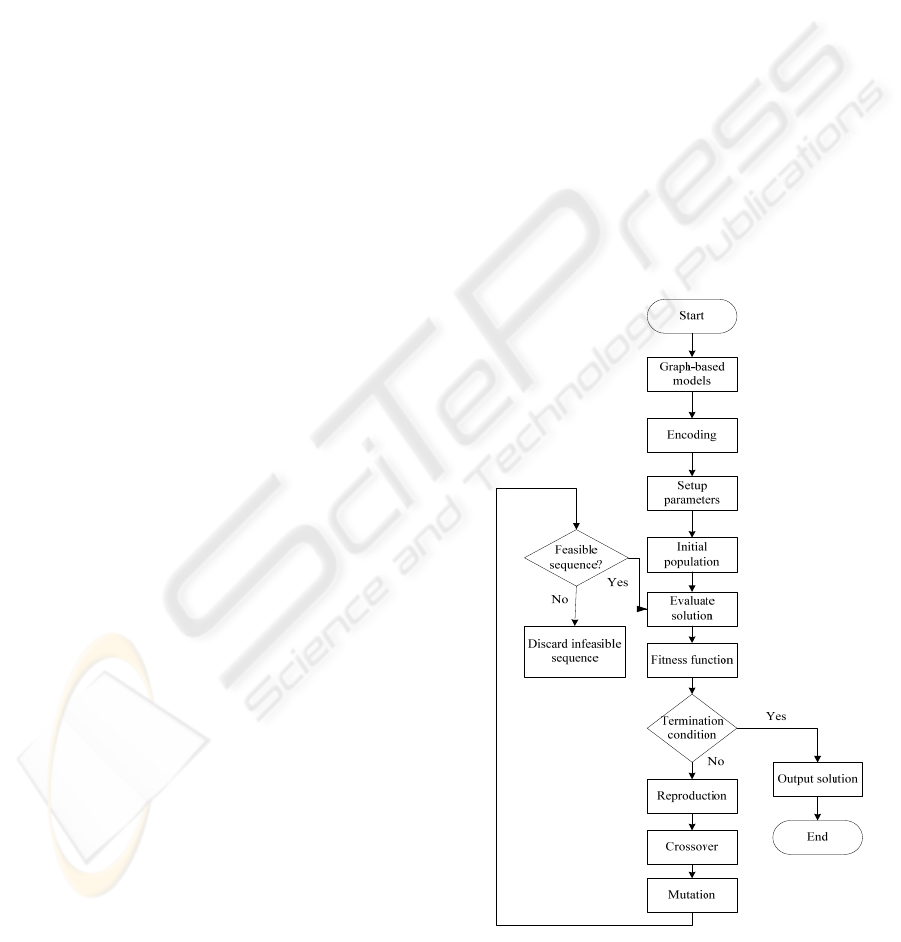
precedence diagram (DPD). An example product A
is shown in Figure 1. The APD and DPD of the
product A are shown in Figure 2 and Figure 3.
In order to analyze and evaluate the feasible
sequences, the two graph-based models of APD and
DPD are transformed into two matrix forms. The
concept of matrix form has been introduced by
Santochi and Dini (1992) for representing the
precedence relationship between a pair of
components. In this research, the two new matrices
forms, assembly precedence matrix (APM) and
disassembly precedence matrix (DPM), are
developed for integrated assembly planning and
disassembly planning. The two matrix models for
the example product A is shown as follows.
APM =
⎥
⎥
⎥
⎥
⎦
⎤
⎢
⎢
⎢
⎢
⎣
⎡
=
=
=
nnnn
ij
n
ni
i
i
j-nj-j-
ppp
p
pp
ppp
p
p
p
ppp
L
MMM
L
L
M
L
21
2221
12111
2
1
21
DPM =
⎥
⎥
⎥
⎥
⎦
⎤
⎢
⎢
⎢
⎢
⎣
⎡
=
=
=
nnnn
ij
n
ni
i
i
j-nj-j-
ppp
p
pp
ppp
p
p
p
ppp
L
MMM
L
L
M
L
21
2221
12111
2
1
21
where p
i
and p
j
are components,
a value of p
ij
= 0 represents that there is no
precedence between two components p
i
and p
j
,
a value of p
ij
= 1 represents that there is
precedence between two components p
i
and p
j
.
Figure 1: Graphical illustration of the example product A.
Figure 2: The assembly precedence diagram APD of the
example product A.
Figure 3: The disassembly precedence diagram DPD of
the example product A.
3 COST FUNCTIONS
In the presented decision support system, the related
assembly and disassembly costs are identified and
modelled. The operation cost functions (OCFs)
define the operation costs required in an integrated
assembly and disassembly sequence. The operation
cost functions include two types of costs, assembly
costs and disassembly costs. A cost function by
integrating the assembly costs and disassembly costs
is formulated and used as an objective function. The
assembly costs include assembly operation cost,
assembly instability cost, assembly accessibility
cost, assembly tool setup cost, and assembly weight
effect cost. The disassembly costs include
disassembly operation cost, disassembly instability
cost, disassembly accessibility cost, disassembly tool
setup cost, and disassembly weight effect cost.
The cost items are described as follows.
(1) Assembly operation cost (ACC): To complete
the assembly operations, proper operation cost
is required. The assembly operation cost is the
basic operational cost for performing an
assembly operation.
(2) Disassembly operation cost (DCC): To
complete the disassembly operations, proper
operation cost is required. The disassembly
operation cost is the basic operational cost for
performing a disassembly operation.
(3) Assembly instability cost (SC): The instability
cost is used to describe the cost for maintaining
ICEIS 2008 - International Conference on Enterprise Information Systems
350
the stability of the components and the
assembled product in the assembly operations.
(4) Disassembly instability cost (USC): instability
cost is used to describe the cost for maintaining
the stability of the product and the
disassembled components in the disassembly
operations.
(5) Assembly and disassembly accessibility cost
(ADC and DDC): The accessibility cost is used
to describe the degree of difficulty in accessing
the parts to complete the assembly operations
(ADC) or disassembly operations (DDC).
(6) Assembly and disassembly tool setup cost
(ATC and DTC): To perform the assembly
operations, proper tools and tool setups are
required (ATC). To perform the disassembly
operations, proper tools and tool setups are
required (DTC).
(7) Assembly and disassembly weight effect cost
(WAI and WDI): To complete the assembly
operations and the disassembly operations, the
components and subassemblies need to be
moved to different orientations or different
positions. Therefore, proper weight effect cost
for moving and handling needs to be defined
for assembly operations (WAI) and disassembly
operations (WDI).
The value of each of the cost functions is
measured on a consistent scale with proper
weighting factors. Given a feasible sequence and the
associated assembly and disassembly information,
the required cost values can be calculated and
evaluated with a consistent unit in dollars. In
practice, the data of each cost function can be
evaluated and recorded according to the information
and the formulations set by the manufacturing plant.
The numerical data of each cost item can be
recorded in a knowledge base and can be checked
using a table format in the process for evaluating a
feasible sequence. The summation of the cost items
is performed using a consistent cost scale. The total
cost function (TC) is the sum of all the operation
cost functions and can be described using the
following equation:
TC = (ACC+SC+ADC+ATC+WAI) +
(DCC+USC+DDC+DTC+WDI ) (1)
4 SOLUTION USING GENETIC
ALGORITHM
4.1 Overall Flow
In the decision support system, the GA approach is
applied to evaluate costs of the integrated sequences
and find the good solutions. The input includes the
definitions of the product and components and the
APD, DPD, APM, and DPM information. The
overall flow of the GA method is illustrated in
Figure 4. First, a new encoding scheme is
developed for representing the integrated assembly
and disassembly sequence. The ordered list of
components is encoded as a chromosome. The
fitness function is defined using the total cost (TC)
of the operation cost functions (OCF). To run the
GA method, an initial population is given first. The
operators of genetic algorithms are performed to
find the solutions. The output sequence is
represented using the ordered components and
operations. The final output of the decision support
system represents the integrated assembly and
disassembly sequence for producing the product.
The GA starts with an initial population and the
population evolves at each generation. An
evaluation is performed to find the chromosome
with a high fitness value to replace the chromosome
with a low fitness value.
Figure 4: The overall flowchart of the GA method.
A DECISION SUPPORT SYSTEM FOR INTEGRATED ASSEMBLY AND DISASSEMBLY PLANNING USING A GA
APPROACH
351
4.2 Encoding
In the GA method, a sequence represented by an
ordered list of components and operations and is
used in the chromosome encoding format. In the
genetic algorithm approach, the populations are
represented by the codes of chromosomes. The
format of the encoded chromosome is shown in
Table 1.
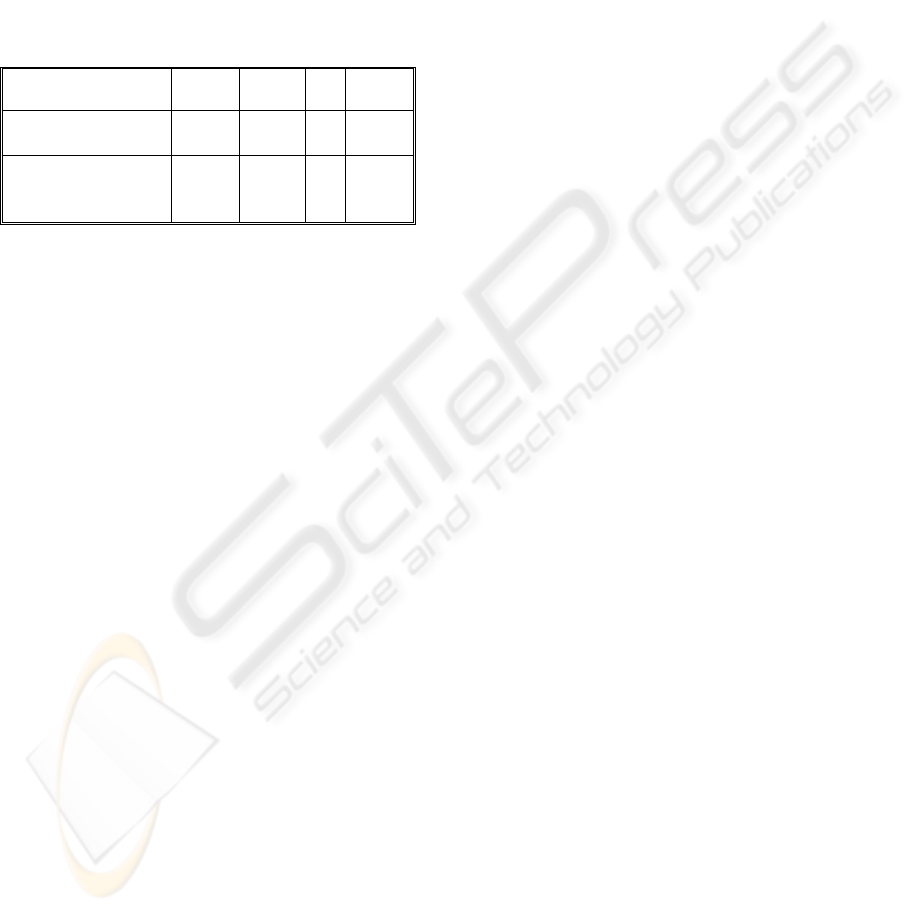
Table 1: The encoding format of a chromosome
representation of an integrated assembly and disassembly
sequence.
Component Name
1 2
…
N
Operation Number
(OP)
OP(1) OP(2)
…
OP(n)
Operation Type:
Assembly (A)
Disassembly (D)
A A
…
Component name denotes the name of a
component. The operation number is an indexed
number of the operation performed on the
component. The operation type includes assembly
operation (A) and disassembly operation (D). The
encoded chromosome represents a list of sequenced
components. The validity of a chromosome for
representing a feasible sequence can be checked
from the APD and APM for assembly sequences,
and DPD and DPM for disassembly sequences.
4.3 Setup Parameters and Fitness
Functions
The parameters used in the genetic algorithms are
defined as follows.
(1) P
Size
: the population size defining the number of
chromosomes in the populations, with a setup
value of 10,
(2) C
Method
: the crossover method, partially mapped
crossover, cycle crossover, and order
crossover can be applied,
(3) C
Rate
: the crossover rate, with an initial value of
0.7,
(4) M
Rate
: the mutation rate, with an initial value of
0.3,
(5) G
Number
: the generation number representing the
condition that the computation stops, with a
setup value of 100.
The fitness function is used to evaluate the
chromosomes and to make choices leading to a good
solution. The decision making of a good solution is
made according to the fitness function. The fitness
function of the integrated assembly and machining
sequences can be derived from the OCF. The fitness
function fit(i) can be defined as follows. The
objective is to find a good sequence by minimizing
the OCF. In the GA method, a chromosome with a
lowest fitness value is chosen to the next generation.
fit(i) = OCF(i), (2)
fit(i): the fitness function value of chromosome i,
OCF(i): the operation cost of chromosome i.
4.4 Solution with GA Method
The step-by-step GA method for finding solutions is
described as follows.
Step 1. Initialization.
(1) Define the chromosome representation
format.
(2) Encode the chromosome.
(3) Determine the population size, the
probability for crossover, the
probability for mutation.
Step 2. Initial population.
(1) Initialize the chromosome index
number i = 1.
(2) Generate a feasible sequence from the
APD.
(3) Encode the ordered entities to model a
chromosome i.
(4) i = i + 1, until i > P
Size
.
Step 3. Evaluation of fitness function value.
The objective of fitness function can be
represented as shown in formulation (2).
The fitness function value is calculated for
each feasible sequence.
Step 4. Reproduction.
In reproduction operator, the fitness value of
a chromosome is used for making decision
for copying to the next generation. The
fitness value of each chromosome and the
total fitness of the population are calculated.
The reproduction probability for each
chromosome and the cumulative
reproduction probability for each
chromosome are calculated. The best
chromosome with the lowest fitness value is
chosen to the next generation.
Step 5. Crossover.
Crossover combines the elements from two
parent solutions to create new solutions. The
crossover operator is performed by splitting,
exchanging, and recombining the elements
from two parent chromosomes to create new
solutions in the next generation. Based on
different splitting, exchanging, and
ICEIS 2008 - International Conference on Enterprise Information Systems
352

recombining methods, different types of
crossover methods can be used.
Step 6. Mutation.
Mutation operator is used to increase the
population variety by randomly selecting
and replacing elements between two
chromosomes. In the exchanging method,
two elements in the two selected
chromosomes are chosen randomly and
exchanged. In the inserting method, an
element is chosen randomly and shifted a
random number of ordered positions to the
right or to the left. In this step, the
reciprocal exchange mutation is used. The
mutation number can be calculated as
(M
Number
) = (M
Rate
) × (P
Size
).
Step 7. Evaluation of the solution.
By checking the APM and the DPM, if a
solution is not feasible, then it will be
discarded. If a sequence is not feasible, the
ordered operations of components will be
changed to a feasible sequence without
violating the precedence. The feasible
solutions and the fitness values are collected
and recorded.
Step 8. Termination condition.
Repeat step 3 to step 7 and C
Time
=C
Time
+1,
If (C
Time
>G
Number
), the computation stops.
Step 9. Output solution with the best fitness value.
The evolution stops when the generation
number
G
Number
is reached. Finally, the
method outputs the solution with the best
fitness value.
5 IMPLEMENTATION AND TEST
RESULTS
In the presented decision support system, the models
were implemented and tested by developing
software on a personal computer. The input data
includes the product definition, the component
definition, the assembly operations and disassembly
operations information, and the cost information.
With the given product and component
definition, the geometric data is processed to
generate spatial and contact information between the
components. With the spatial and contact
information between components, the corresponding
APD and DPD and can be build. The matrix forms
APM and DPM can be calculated from the APD and
DPD.
Using the constructed graph-based models and
matrix forms, the feasibility of the integrated
assembly and disassembly sequences can be
examined. Next, the GA method is applied to find
the solutions. The example product A is illustrated
and discussed in this section. The example product
A is shown in Figure 1. There are 7 components, a,
b, c, d, e, f, and g. The APD and DPD is shown in
Figure 2 and Figure 3. The APM and DPM for the
example product A is shown in the following forms.
A
PM =
⎥
⎥
⎥
⎥
⎥
⎥
⎥
⎥
⎥
⎦
⎤
⎢
⎢
⎢
⎢
⎢
⎢
⎢
⎢
⎢
⎣
⎡
0100001
0000001
0000011
0000111
0000011
0000001
0000000
g
f
e
d
c
b
a
gfedcba
,
DPM
=
⎥
⎥
⎥
⎥
⎥
⎥
⎥
⎥
⎥
⎦
⎤
⎢
⎢
⎢
⎢
⎢
⎢
⎢
⎢
⎢
⎣
⎡
0000000
1000000
0000000
0000000
0001000
1011100
1111110
g
f
e
d
c
b
a
gfedcba
.
Finally, the GA algorithm is applied for finding
solutions. The test result of the GA method is
shown in Figure 5. Figure 5 shows that the
computation converges after 15 generations with the
near optimized low cost of $369.701. The solution
of the integrated assembly and disassembly
sequence is shown in Figure 6. Figure 6 describes
that the 7 components can be assembled and
disassembled with the described integrated assembly
and disassembly sequences with a near optimized
low cost. The For example, in the integrated
sequence 1, a→b→f→c→d→g→e represents the
assembly sequence, and g→e→d→c→f→b→a
represents the disassembly sequence.
It is observed that the combinatorial number of
sequences increases as the component number
grows. A larger number of components of the
product may lead to a longer computational time. It
can be concluded in general, if the component
number grows, the advantage of the GA method may
be highlighted with a comparatively shorter
computational time. Although the presented
methods can be useful for generating and evaluating
feasible sequences with good solutions, much
remains to be done to manage complicated products
with a large number of components.
A DECISION SUPPORT SYSTEM FOR INTEGRATED ASSEMBLY AND DISASSEMBLY PLANNING USING A GA
APPROACH
353
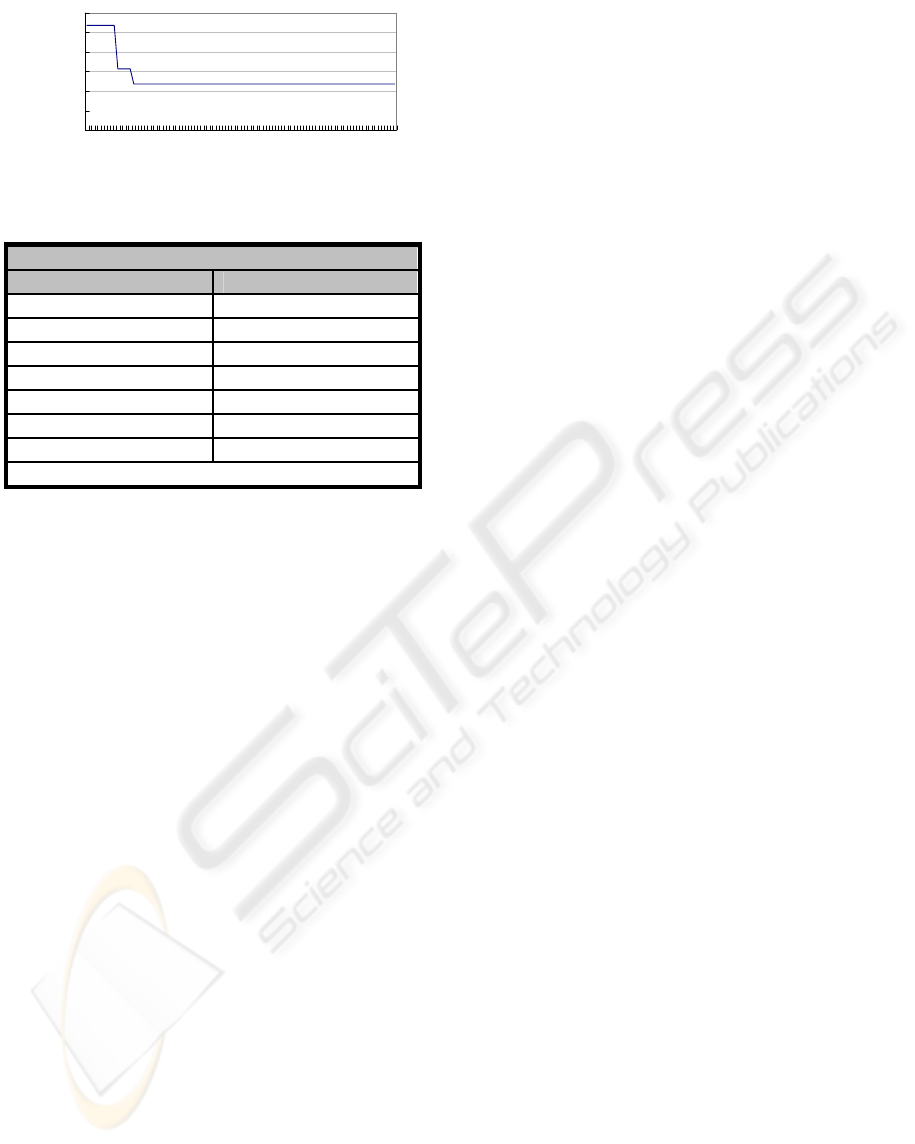
392
394
396
398
400
402
404
1 9 17 25 33 41 49 57 65 73 81 89 97
世代數
Figure 5: The test result of the GA method.
Integrated sequences
Assembly sequence Disassembly sequence
a→b→f→c→d→g→e g→e→d→c→f→b→a
a→b→e→f→c→d→g g→e→d→c→b→f→a
a→b→e→f→c→d→g g→d→c→e→f→b→a
a→b→e→f→c→d→g g→d→c→f→e→b→a
a→b→e→c→f→d→g g→e→d→c→f→b→a
a→b→e→f→c→d→g g→d→e→c→f→b→a
Cost = 194.64 Cost = 202.061
Integrated cost = 369.701
Figure 6: The test results of the integrated assembly and
disassembly sequences with the GA method.
6 CONCLUSIONS
In a complete decision support system for product
life cycle management of assembled products, both
the assembly and disassembly sequences need to be
planned. In a complete product life cycle of a
product, an assembly sequence is required to
produce a new product at the start and a disassembly
sequence is needed at the end to decompose and
recycle the product. In this research, the assembly
planning model and the disassembly planning model
are integrated to generated integrated assembly and
disassembly sequences. First, an assembly
precedence diagram (APD) and a disassembly
precedence diagram (DPD) are built by analyzing
the spatial relationships of the components and the
operations. The precedence relationships are
represented as assembly precedence matrix (APM)
and disassembly precedence matrix (DPM) for
checking feasibility of the generated sequences.
Second, a solution method using a GA approach is
applied to search for the good assembly sequence
and disassembly sequence. A cost function by
integrating the assembly costs and disassembly costs
is formulated. Example products are modeled and
tested. The final output of the decision support
system presents solutions of assembly sequences
and disassembly sequences. The test results show
that the GA method converges within a small
number of generations with a near optimized low
cost. It can be generally concluded that the
developed model in the decision support system is
feasible and effective for integrating assembly
planning and disassembly planning. The decision
support system is capable of finding complete
assembly and disassembly sequences with a near
optimized low cost. Further research should be
concerned with different genetic operators.
Moreover, more detailed assembly and disassembly
decision support factors and other related cost
functions can be further explored.
REFERENCES
Abdullah, T. A., Popplewell, K., and Page, C. J. (2003). A
review of the support tools for the process of assembly
method selection and assembly planning, International
Journal of Production Research, 41(11), pp. 2391–
2410.
Ben-Arieh, D., and Kramer, B. (1994). Computer-aided
process planning for assembly: generation of assembly
operations sequence, International Journal of
Production Research, 32(3), pp. 643-656.
Chen, R. S., Lu, K.-Y. , and Tai, P. H. (2004). Optimizing
assembly planning through a three-stage integrated
approach, International Journal of Production
Economics, 88, pp. 243-256.
Chen, S.-F., Liu, Y. (2001). The application of multi-level
genetic algorithms in assembly planning, Journal of
Industrial Technology, 17(4), pp. 1–9.
Chen, R.-S., Lu, K.-Y., and Yu, S.-C. (2002). A hybrid
genetic algorithm approach on multi-objective of
assembly planning problem, Engineering Applications
of Artificial Intelligence, 15, pp. 447–457.
Choi, C. K., Zha, X. F., NG, T. L. and Lau, W. S. (1998).
On the automatic generation of product assembly
sequences, International Journal of Production
Research, 36, pp. 617-633.
De Fazio, T. L., and Whitney, D. E. (1987). Simplified
generation of all mechanical assembly Sequences,
IEEE Journal of Robotics and Automation, Vol. RA-3,
No. 6, pp. 640-658.
De Lit, P., Latinne, P., Rekiek, B., and Delchambre, A.
(2001). Assembly planning with an ordering generic
algorithm, International Journal of Production
Research, 39(16), pp. 3623-3640.
Goldberg, D. E. (1989). Genetic algorithms in search,
optimization, and machine learning, Addison-Wesley,
Reading, MA.
Gottipolu, R. B., and Ghosh, K. (1997). Representation
and selection of assembly sequences in computer-
aided assembly process planning, International
Journal of Production Research, 35(12), pp. 3447-
3465.
Generation number
Cost
ICEIS 2008 - International Conference on Enterprise Information Systems
354

Heemskerk, D. J. M., and Van Luttervelt, C. A. (1989).
The use of heuristics in assembly sequence planning,
Annals of the CIRP, 38(1), pp. 37-40.
Homem de Mello, L. S., and Sanderson, A. C. (1991).
Two criteria for the selection of assembly plans:
maximizing the flexibility of sequencing the assembly
tasks and minimizing the assembly time through
parallel execution of assembly tasks, IEEE
Transactions on Robotics and Automation, 7(5), pp.
626-633.
Laperriere, L., and ElMaraghy, H. A. (1996). GAPP: A
Generative Assembly Process Planner, Journal of
Manufacturing Systems, 15(4), pp. 282-293.
Lazzerini, B., Marcelloni, F. (2000). A genetic algorithm
for generating optimal assembly plans, Artificial
Intelligence in Engineering, 14, pp. 319–329.
Li, J. R., Khoo, L. P., and Tor, S. B. (2003). A Tabu-
enhanced genetic algorithm approach for assembly
process planning, Journal of Intelligent
Manufacturing, 14(2), pp. 197-208.
Lin, A. C., and Chang, T. C. (1993). An integrated
approach to automated assembly planning for three-
dimensional mechanical products, International
Journal of Production Research, 31(5), pp. 1201-
1227.
Marian R. M. , Luong, L. H. S., and Abhary, K. (2003).
Assembly sequence planning and optimization using
genetic algorithms, Applied Soft Computing, 2/3F, pp.
223–253.
Santochi, M., and Dini, G. (1992). Computer-aided
planning of assembly operations: the selection of
assembly sequences, Robotics and Computer-
Integrated Manufacturing, 9(6), pp. 439-446.
Smith, S. S.-F. (2004). Using multiple genetic operators to
reduce premature convergence in genetic assembly
planning, Computers in Industry, 54, pp. 35–49.
Swaminathan, A., and Barber, K. S. (1996). An
Experience-based Assembly Sequence Planner for
Mechanical Assemblies, IEEE Transaction on
Robotics and Automation, 12(2), pp. 252-267.
Tseng, Y.-J., and Liou, L.-C. (2000). Integrating assembly
and machining planning using graph-based
representation models, International Journal of
Production Research, Vol. 38(12), pp. 2619-2641.
Tseng, Y-J, Lin, C-H, and Lin, Y-H. (2006). Integrated
assembly and machining planning for electronic
products using a genetic algorithm approach,
International Journal of Advanced Manufacturing
Technology, DOI 10.1007/s00170-006-0815-9,
Published online 17 November 2006.
Ye, N., and Urzi, D. A. (1996). Heuristic rules and
strategies of assembly planning: experiment and
implications in the design of assembly decision
support system, International Journal of Production
Research, 34(8), pp. 2211-2228.
A DECISION SUPPORT SYSTEM FOR INTEGRATED ASSEMBLY AND DISASSEMBLY PLANNING USING A GA
APPROACH
355
