
A TOOL OF DECISION SUPPORT FOR THE NATURAL RISK
MANAGEMENT
Nadia Abdat and Zaia Alimazighi
Laboratoire LSI - Département Informatique, Faculté Génie Electronique et Informatique
University of Sciences and Technology Houari Boumediene (USTHB), Algiers, Algeria
Keywords: Geographic Information Systems, decision support systems, natural risk management, seismic risk, balanced
scorecard, spatial indicators, seismic measurements, seismology.
Abstract: In this paper, we propose a space balanced scorecard for the seismic risk management. Indeed, to install an
effective policy of prevention against the natural risk, the phenomenon should be controlled. This can be
carried out only after a good knowledge of this last. From where, the need for having a large volume of
information coming from various sources. The Geographical information systems (GIS) are largely used for
the decision support. However, they give a rather static vision whereas the management of an environmental
process in general and natural risk in particular requires tools based on dynamic models. In addition, the
scorecards are often used to build decision support systems. In this paper, we propose a balanced scorecard
for the management of a seismic risk which is established on the basis of spatial indicators.
1 INTRODUCTION
This paper propose a tool of decision support for the
natural risk management, in particular the seismic
risk.
Various fields are interested more and more in
the risks in particular in environment. In this
context, the objective is to control the natural
phenomena through, simulation, prevention and
decision support tools. The problem arises even
more when they are natural risks such as the seism.
Indeed, the disastrous effects of the seism as well on
the human lives as on their works (infrastructures,
houses...) reach sometimes important proportions. If
it is not possible to currently envisage with
exactitude a seism, it is possible to evaluate the
whole of the socio-economic consequences on the
areas where it can occur (Djeddi, 1994)
The purpose of the research undertaken in this
direction, is to evaluate and manage the effects of
this type of "dangerous" phenomenon in order to
limit its occurrence. The results of these works
generally integrate a strong geographical component
which results in the use of the Geographical
Information systems (GIS) (Chatelain and al,
1995)(Glassey and al, 1997).
Indeed, these tools offer means for the
identification of the concerned sectors and the
impacted stakes in order to do an evaluation of the
damage following a seismic catastrophe. So, the GIS
are largely used for the decision support. However,
they give a rather static vision whereas the
management of an environmental process in general
and natural risk in particular requires tools based on
dynamic models. (Koch, 2001).
In addition, decisional data processing in order to
increase the flexibility and the reactivity of the
organizations, introduced more and more new
information and communication technologies such
as the scorecards.
In this paper, we propose a balanced scorecard
for the management of a seismic risk. It is
established on the basis of spatial indicators
describing the variations.
It relates to the research works carried out by the
laboratory of the information processing systems
(LSI) of the data-processing department (USTHB) in
collaboration with the Research Center in
Astrophysical and Geophysical Astronomy
(CRAAG) concerning the impact of the use of the
GIS for the reduction of the seismic risk in Algeria.
In the first phase, we used an object approach to
simulate the scenario of an earthquake. The cross-
referencing data are carried out from various maps
(geological, topographic,...) as well as data relating
579
Abdat N. and Alimazighi Z. (2008).
A TOOL OF DECISION SUPPORT FOR THE NATURAL RISK MANAGEMENT.
In Proceedings of the Tenth International Conference on Enterprise Information Systems - AIDSS, pages 579-582
DOI: 10.5220/0001718105790582
Copyright
c
SciTePress
to the seismicity of the area of study(Abdat and al,
2005 a), (Abdat and alimazighi, 2005). Like
principal results of this phase, we can quote:
-a geographical data base (Geo-Relational
DataBase) is built covering the whole of the
concepts handled in seismic management (Abdat
and al, 2005 b)
-The study of the historical seismicity.
-The real time study of the seisms : the
instrumental seismic monitoring is done starting
from seismological stations distributed on the whole
of the territory. The data collected by the
seismometers are centralized and saved in the
GeoDataBase.
-graphical documents describing the area
seismicity are produced such as the chart the
magnitudes, the aftershocks on one or more areas
and the chart of the intensities following the results
of the macro seismic investigation or a simulation.
-The simulator of seism makes it possible to
estimate the intensities of areas touched by a seism.
The intensity is regarded here as a classification of
the gravity of an earthquake according to the effects
observed in a limited zone. Its calculation is a
function of the characteristics of seisms and the
areas where they occur : magnitude, depth, the
distance epicenter-area, the type of ground, the type
of construction and associated intensity according to
the European Macro scale seismic (EMS).
-A prototype is constructed using ARC GIS. It
was applied to the seismic risks of Algiers (Abdat
and al, 2005 b).
This first phase enabled us to show the
contribution of the GIS in the seismic risk
management. In the second phase, object of this
present paper, we present a space balanced scorecard
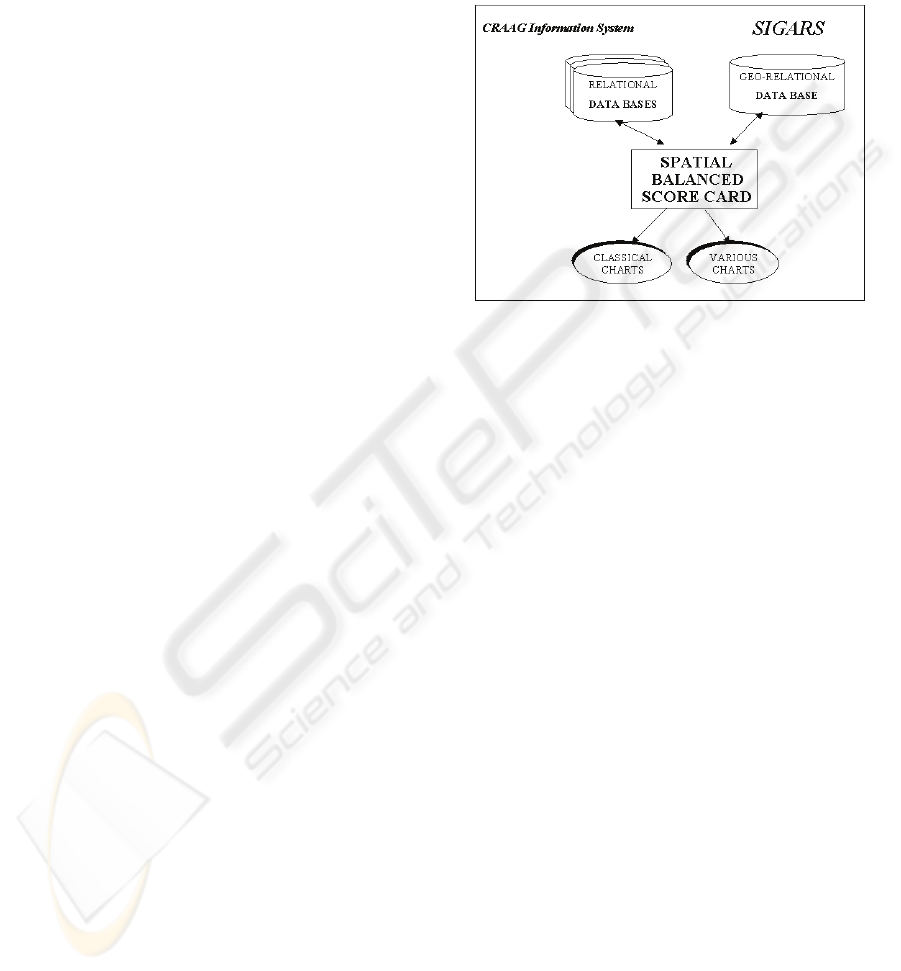
(SBSC) applied to the seismic risk. The indicators of
the SBSC are calculated starting from the
Geodatabase (figure 1) .
2 THE BALANCED
SCORECARDS (SBSC)
A scorecard or a dashboard is a means allowing to
represent a complex reality by using a simplified
model. It gives an incomplete and often vague of
reality but sufficient vision to make fast decisions.
The dashboards of decision such as the balanced
scorecard (Kaplan and Norton, 2001), concentrate
especially on the quality of information and not on
its quantity. They represent the indicators in a
comprehensible and suggestive way in order to
facilitate their visualization. They present an outline
representative of the situation, then making it
possible to reach the more detailed data. The
dashboard must be contextual, one can select his
own indicators, with the representation which he
prefers, in order to produce his personalized
dashboard.
Figure 1: Functional architecture of the system.
Many organizations use dashboards. For
example, administrations, banks. International
organizations such as the United Nations also use
social, economic, geopolitical or environmental
indicators. In the field of geomatic, there are some
work such as (Devillers and al, 2005) which
proposes a space dashboard for the management of
the quality of the geographical data. Certain works
were made to adapt tools of the Business
Intelligence in the field of geomatic, such as Spatial
Data Mining, the SOLAP (Spatial On-line
Analytical Processing) and the spatial data
warehouses (Miller and Han, 2001), (Rivest and al,
2001).
The GIS users handle the geographical data in
order to obtain information being able to be used in
a process of decision-making (e.g. to identify the
areas of risk, to identify the vulnerable buildings to a
seism with given magnitude or intensity). For that,
They perceive signals of the real world, interpret
them, and proceed to an abstraction in order to
generate a cognitive map being used for this
decision-making. The decisions are made in order to
achieve a goal, according to many criterias such as
the perceived situation, the experiment and the
reference of values of users and their motivations,
according to the measurement of the risks and the
available means (Devillers and al, 2004). (Klein,
1999) affirms that the mental intuition and
simulations are central in the decision-making, based
respectively on the experiment and imagination. He
ICEIS 2008 - International Conference on Enterprise Information Systems
580
stresses the importance of the relevant indices which
help to recognize a situation.
An indice or indicator is an information or a set
of information contributing to the general
appreciation of a situation (Fernandez, 2000). The
objective of an indicator is to measure a situation
and to initiate a reaction. The value of an indicator
can be based on a single data or result from a
calculation implying several data. These data must
be technically accessible. They can be already
available in a data base or come from other sources.
3 OUR SPACE BALANCED
SCORECARD (SBSC) APPLIED
TO THE SEISMIC RISK
We have applied the Balanced Scorecard approach
for the CRAAG. To develop a coherent dashboard, it
is inevitable to have a perfect knowledge of the
organization. The principal mission of the CRAAG
consists in studying the seismicity of the territory
and the seismic monitoring with like principal
objective "the reduction of the seismic risk in
Algeria”. To succeed in achieving this objective, the
CRAAG will have to plan intermediate objectives
such, the improvement of the seismic monitoring by
improving the performance of the seismic
monitoring networks and the participation in the
sensitizing of the citizens.
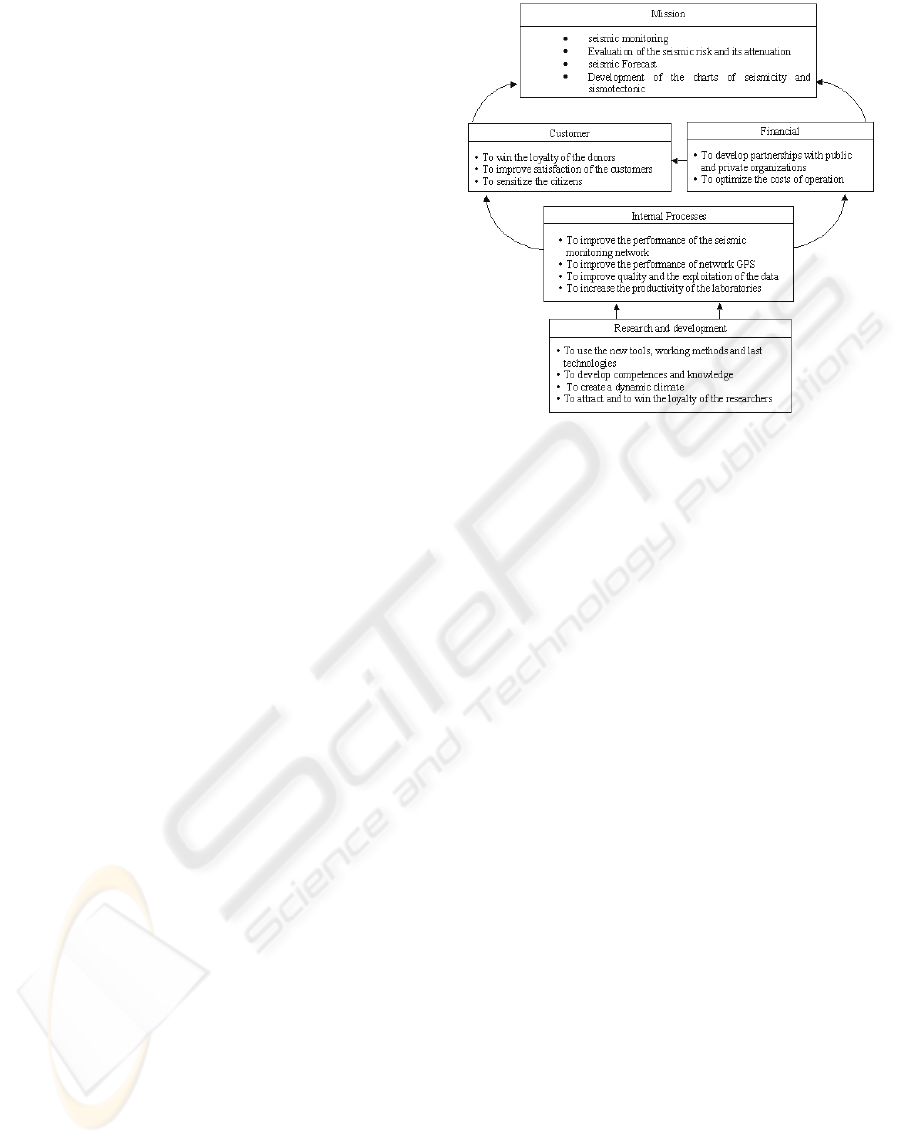
We worked out a strategic chart which is defined
according to the four axes of the Balanced
Scorecards (customer, financier, internal processes,
research and development) (figure 2).
Characteristics of our SBSC :
-to communicate information on a visual basis,
-to avoid an overload of information,
-to allow the users to adapt their dashboard to
their needs
- to provide indicators in real time
- to allow the users to select the relevant
indicators in their context or to define their own
indicators
- to allow the users to visualize the indicators at
various levels of details: the indicators are organized
in a hierarchical way (indicators and under-
indicators)
- to offer various representations of the
indicators which the users can select (ex.
histograms).
Figure 2: The strategic chart of the SBSC of the CRAAG.
The indicators can represent various types of
information, as well quantitative as qualitative:
- Indicators of status: A status indicator gives
information about monitoring network status, GPS
network status.
- Indicators of measure : A measure indicator
gives information on measures relating to recorded
seismic waves of soil movements.
Users have access to proposed indicators
description in different aspects such as:
definition/meaning of the indicator; method used to
calculate the indicator value; representation mod of
the indicator.
Various representations can be used to visualize
the value of an indicator, such as numbers, symbols,
icons, pictograms, tables, graphs, texts, images, etc.
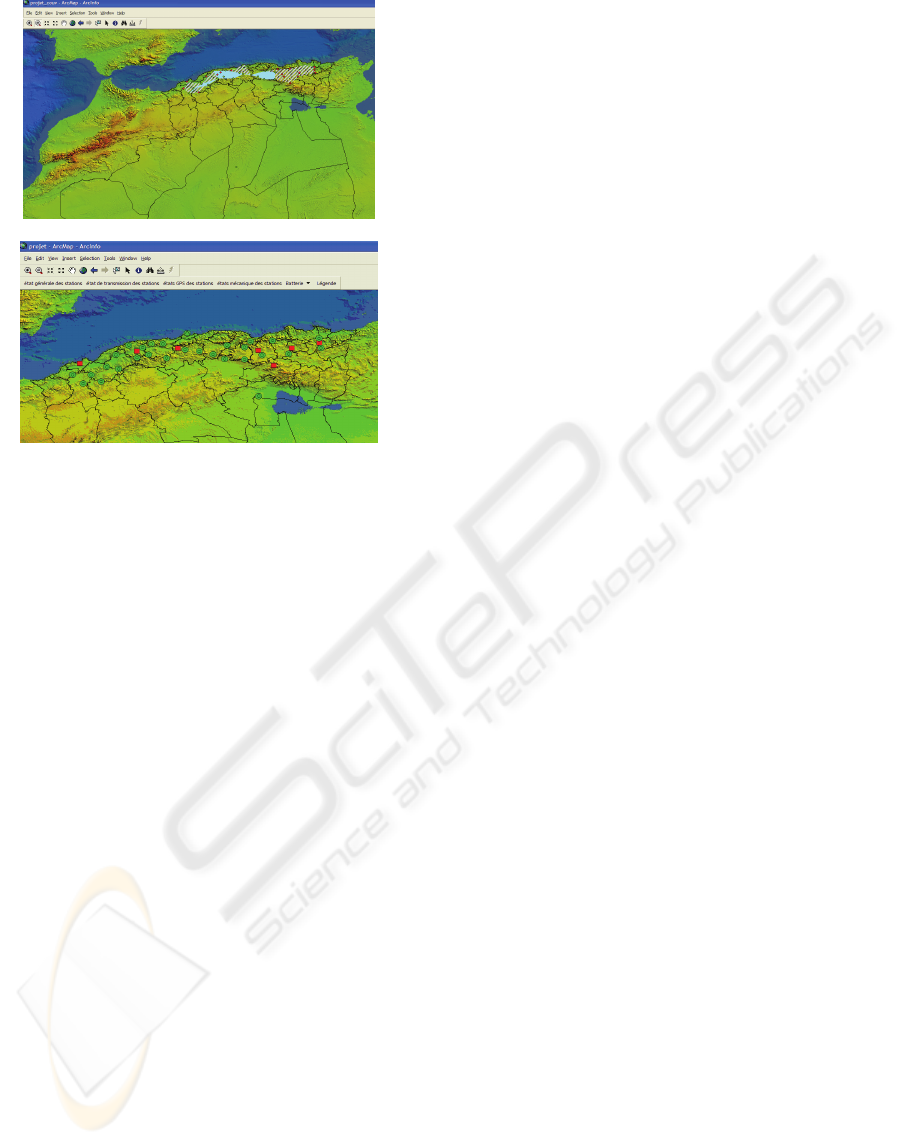
Moreover, to take into account the space
component, one offers a cartographic mode of
visualization of the indicators (figure 3).
A prototype is constructed using the Visual
Basic language. The cartographical functionalities of
the prototype are developed using ARC GIS (ARC
MAP). This prototype is integrated to SIGARS
(figure 1).
A TOOL OF DECISION SUPPORT FOR THE NATURAL RISK MANAGEMENT
581
(a)
(b)
Figure 3 : Cartographic mode of visualization of the
indicators:
(a) Capacity of cover of the telemetric network;
(b) Telemetric network of seismic monitoring.
4 CONCLUSIONS
In conclusion, this paper presents a new approach
allowing to communicate information relating to the
dynamic of geographical data in order to reduce
natural risks. In order to avoid an overload of
information and to support adequately the decision
process, this approach advocate the integration to a
GIS a spatial balanced scorecard. The information
relating to the dynamic is communicated to the user
in forms of indicators which he can select, modify in
need, then consult in different levels of details.
ACKNOWLEDGEMENTS
We thank T. Alili (CRAAG) and C. M. Mokrane ,
T.Boudjemaa (USTHB) for their contribution in the
realization of the application.
REFERENCES
Abdat, N, Alimazighi, Z, 2005, Geographic object
generating process, Symposium international des
technologies de l’information et de la communication
ICTIS’2005, Morocco, june 2005.
Abdat, N, Alimazighi, Z, Allili, T, 2005 a, Un système
d’information géographique appliqué au risque
sismique, Colloque sur l'Optimisation et les Systèmes
d'Information (COSI), Béjaïa Algeria june 2005.
Abdat, N, Alimazighi, Z, Allili, T, 2005 b, A GIS TOOL
for the evaluation of the seismic risk : application to
the seismic risks of Algiers XXII International
Cartographic Conference (ICC 2005), Corunã, Espana,
july 2005.
Chatelain, JL, Guillier, B, Souris,M, Dupérie, Yepes,
1995, SIG et évaluation des risques
naturels ;application aux risques sismiques de Quito.
Mappemonde 3/95
Devillers, R, Bédard, Y, Jeansoulin, R, 2005,
Multidimensional management of geospatial data
quality information for its dynamic use within
Geographical Information Systems. Photogrammetric
Engineering and Remote Sensing.
Devillers, R, Bédard, Y, Gervais, M, 2004, Indicateurs de
qualité pour réduire les risques de mauvaise utilisation
des données géospatiales. Revue Internationale de
Géomatique vol. 14, n. 1
Djeddi, M, 1994, Eléments de sismologie, OPU Algeria
04-1994
Ems, http://www.emsc-csem.org/
Fernandez A, 2000, Les nouveaux tableaux de bord des
décideurs , Paris, Éditions d'organisation,
Glassey, P,J, Forsyth, P, DipGrad, Turnbull, 1997, A GIS-
based hazard Information system: Dunedin pilot
project, IPENZ Transactions, Vol. 24, No. 1/GEN,
1997
Kaplan R.S, Norton D.P, 2001, The strategy-focused
organization : how balanced scorecard companies
thrive in the new business environment, Havard
Business School Publishing Corporation.
Klein G, 1999, Sources of Power - How people make
decisions, Cambridge, Massachusetts, MIT Press.
Koch A, 2001, Linking MultiAgent System and GIS.
Modelling and Simulating Spatial InterActions.
Department of Geography RWTH, Aachen
(Allemangne).
Miller H. J., Han J., 2001, Geographic Data mining and
Knowledge Discovery, Taylor & Francis.
Rivest S., Bédard Y., Marchand P., 2001, Towards Better
Support for Spatial Decision Making: Defining the
Characteristics of Spatial On-Line Analytical
Processing (SOLAP) , Geomatica, vol 55, nº 4
ICEIS 2008 - International Conference on Enterprise Information Systems
582
