
A DATA MINING METHOD BASED ON THE VARIABILITY OF THE
CUSTOMER CONSUMPTION
A Special Application on Electric Utility Companies
F
´
elix Biscarri, Ignacio Monedero, Carlos Le
´
on, Ju
´
an I. Guerrero
Department of Electronic Technology, University of Seville, C/ Virgen de Africa, 7, 41011 Sevilla, Spain
Jes
´
us Biscarri, Roc
´
ıo Mill
´
an
ENDESA Distribuci
´
on, Avda. de la Borbolla, S/N, 41092 Sevilla, Spain
Keywords:
Data mining, power utilities.
Abstract:
This paper describes a method proposed in order to recover electrical energy (lost by abnormality or fraud)
by means of a data mining analysis based in outliers detection. It provides a general methodology to obtain a
list of abnormal users using only the general customer databases as input. The hole input information needed
is taken exclusively from the general customers’ database. The data mining method has been successfully
applied to detect abnormalities and fraudulencies in customer consumption. We provide a real study and we
include a number of abnormal pattern examples.
1 THE NATURE OF ELECTRICAL
UTILITY ANOMALIES
Acording to electrical utilities, a non-technical loss
is defined as any consumed energy or service which
is not billed because of measuring equipment fail-
ure or ill-intentioned and fraudulent manipulation of
said equipment. Therefore, detection of non-technical
losses includes detection of fraudulent users. (Art
´
ıs
et al., 1999)
All our data are drawn from Endesa databases,
with permission. Particularly, data in this paper is
based on two representative customer sectors: private
customers and lodging sector customers. We have se-
lected two samples from two activity sectors with a
historically high rate of non-technical losses, frauds
and anomalies, and with very different consumption
habits, in order to try to prove the mining method.
2 THE STATISTICAL APPROACH
TO OUTLIERS DETECTION
Very often, there exists data objects that do not com-
ply with the general behavior of the data. Such data
objects, which are grossly different from or inconsis-
tent with the remaining data, are called outliers.
Data mining is being applied to multiple fields
and detection of non-technical looses is one field in
which it has met with recent success (Kou et al., 2004)
(Daskalaki et al., 2003) (Editorial, 2006). Consider-
able progress has been made in identifying fraud by
mining methods (Kirkos et al., 2007) (Wheeler and
Aitken, 2000). The method proposed in this paper
is based in outliers’ detection and provides a general
methodology to obtain a list of abnormal users us-
ing only the general customer databases as input. It
has been successfully applied to detect inconsisten-
cies and fraudulencies in customer energy consump-
tion.
Outliers can be caused by measurement error or
by fraud in customer consumption. But, alternatively,
outliers may be the result of inherent data variability.
Thus, outliers detection and analysis is an interesting
data mining task, referred to as outliers mining.
The advantages of the proposed algorithm with re-
spect to the existing technology is:
• The elimination (or, at least, reduction) of the tem-
porary component and the local geographical lo-
cation component of the customer consumption.
Outliers can be caused by measurement errors, not
by the inherent data variability.
• The study of the comparative consumption among
clients of similar characteristics. This method
370
Biscarri F., Monedero I., León C., I. Guerrero J., Biscarri J. and Millán R. (2008).
A DATA MINING METHOD BASED ON THE VARIABILITY OF THE CUSTOMER CONSUMPTION - A Special Application on Electric Utility Companies.
In Proceedings of the Tenth International Conference on Enterprise Information Systems - AIDSS, pages 370-374
DOI: 10.5220/0001721103700374
Copyright
c
SciTePress

is based on the observation that fraudsters sel-
dom change their consumption habits (Art
´
ıs et al.,
2000). They are closely linked to other fraudsters,
but not to the rest of customers.
• Classification methods are particularly useful
when a database contains examples that can be
used as the basic for future decision making (su-
pervised methods). Thus, researchers have fo-
cused on different types of classification algo-
rithms, including nearest neighbor (He et al.,
1997), (He et al., 1999), decision tree induc-
tion, error back propagation (Brokett et al., 1998),
(Brause et al., 1999), reinforcement learning and
rule learning. The data mining based in outlier
detection method presented is an unsupervised
method. This doesn’t require one to be confident
about the true classes of the original data used to
built the models. It can be used to detect frauds
or errors of a type which not have previously oc-
curred.
• The use of a simple tool, developed for mining
very large data set.
The statistical approach to outliers’ detection as-
sumes a distribution or probability model for the
given data set and then identifies outliers with re-
spect to the model using a discordance test (Barao
and Tawn, 1999), (Cabral et al., 2004). Application
of the test requires knowledge of the data set param-
eters (such as the assumed data distribution), knowl-
edge of the distribution parameters (such as the mean
and variance) and, mainly, knowledge of the inherent
data variability (Kantardzic, 1991).
3 DATA DISTRIBUTION
We have selected a sample of homogeneous data
(utility customers with similar characteristics: private
clients, that live in the same city, with similar eco-
nomic levels,...) and we have normalized this sam-
ple (we have ’eliminated’ the temporary and the lo-
cal components of the individual consumption). After
this process, we considered the probability distribu-
tion of the transformed sample, for the normal operat-
ing condition, as gausian. We calculated and adjusted
the threshold of the sample variance and, finally, we
used outliers to guide the inspections. The mining
process is described subsequently:
Figure 1: Selected sample of data for 105 private customers.
3.1 Data Preprocessing and
Discretization
Large real-world databases are incomplete, noisy
(containing errors) and inconsistent (containing data
of clients of not comparable electric consumption)
We have selected a complete (6 bimonthly bills
per year), unnoised (without errors) and consistent
(clients are ’similar’) data set. Figure 1 shows bi-
monthly electric consumption (Kwh vs. private cus-
tomers) of the selected sample. The showed tempo-
rary and local components of data must be eliminated
or highly reduced.
The data set description is the following:
105 private clients (not business). Living in the
same city (Specific geographical location: Utrera,
Seville, Spanish town). With the same power contract
(4 Kw). With the same yearly electric consumption:
between 0 and 5000 Kwh. Only one year, 6 bimonthly
bills per year.
The sample, in order to detect outliers, only con-
siders customer identification and 6 bimonthly bills.
Data format is:
Customer
identifier; bill 1; bill 2; bill 3; bill 4;
bill 5; bill 6
3.2 Data Transformation
This technique assumes there are no interactions
present between time and space. The temporary com-
ponent and the local geographical location component
must be eliminated.
1. Given
• A Data at a set of spatial locations (different
clients).
• Several data acquisitions of the data at each lo-
cation but spaced in time. It is assumed that all
A DATA MINING METHOD BASED ON THE VARIABILITY OF THE CUSTOMER CONSUMPTION - A Special
Application on Electric Utility Companies
371

the locations are sampled at the same time and
are sampled many times.
2. The operating equation is defined as follows: Data
acquired = D
lt
, where D is the actual data point
measurement, l is the location of the measurement
(number of client) and t is the time of the mea-
surement (this is the time at which all the data are
recorded at all locations).
3. The next step is to obtain the average at each time
across all locations. This is defined by the equa-
tion A
t
=
N
∑
l=1
D
lt
N
where A
t
is the average of all data
at time t, across all locations, l, and N is the num-
ber of locations.
4. It can now be observed, by considering the aver-
ages and their times, whether or not there is an
effect on change in time. This is something that
cannot be seen during an analysis of variance, but
which can be seen here.
5. Next, obtain the differences by comparing the data
at each location to the average at that time, that is:
δ
lt
= D
lt
− A
t
. where δ
lt
= the difference between
the data at each location, l, and this time, t, aver-
age.
6. Now it is necessary to obtain the average of the
differences,
¯
δ
l
, at each location across time, that
is:
¯
δ
l
=
M
∑
t=1
δ
lt
M
where
¯
δ
l
= the average of all δ
l
t at location, l,
across time, t, and M is the number of times aver-
aged.
7. It is then necessary to obtain the differences, ∆,
comparing each time difference, δ
lt
, to its average
at location, l, as shown in equation: ∆
lt
= δ
lt
−
¯
δ
l
Note that the δ
lt
values are the residual electrical
consumptions after the linear variations in time
and space averaged out.
4 DISTRIBUTION PARAMETERS
The next step is to calculate the standard deviation
associate with each customer with regard to the rest
of customers, ST D
∆
l
(l=1,· · · ,105; M=6), using equa-
tion:
ST D
∆
l
=
s
M
∑
t=1
∆
lt
−
¯
∆
l
M − 1
Where
¯
∆
l
=
M
∑
t=1
∆
lt
M
Figure 2: Schart for 105 private customers.
5 OUTLIERS ANALYSIS AND
INHERENT DATA
VARIABILITY
The threshold of ST D
∆
l
is estimated by the mean of
ST D
∆
l
multiplied by a constant (1.96 correspond to a
level of significance σ = 0.05).
Plotting ST D
∆
l
(l=1,...,105) and the threshold, we
obtain that 9 customers are outliers (figure 2, Standard
Deviation, in Kwh Vs. Sample Number, 1 to 105).
As we have already said, these outliers can be
caused by measurement error or by fraud in customer
consumption. But, alternatively, outliers may be the
result of inherent data variability.
In anomaly detection, the Standard Deviation
Chart (Schart) offers a signature for each customer,
that is, itself, the baseline for comparison. In clas-
sical research, new consumption for a customer is
compared against their individual signature to deter-
mine if the user’s behavior has changed (Fraud and
Intrusion detection, (Burge and Shawe-Taylor, 1997),
(Denning, 1987), (Fawcett and Provost, 1997), (Lunt,
1993)). A significant departure from baseline is a
signal that the account may have been compromised.
The research presented in this paper offers another
point of view: consumptions for a group of customers
are compared against their group signature to deter-
mine if the behavior of an individual customer is
anomalous.
We have carefully studied the six more likely
fraudulent customers of this group. The Endesa staff
has recommended inspections, two of them. One of
the two has been detected as anomalous (a fraudulent
customer).
ICEIS 2008 - International Conference on Enterprise Information Systems
372
6 SECOND EXAMPLE: LODGING
SECTOR
This new example analyzes 4047 customers from the
lodging sector in Andaluca (Spain). They have a
yearly electric consumption between 0 and 12 ∗ 10
4
Kwh and an extensive contract power range. This in-
consistent sample is divided into 18 subsamples with
similar yearly consumption. Then, general methodol-
ogy is applied, independently, to each one of subsam-
ples.
Customers classified as outliers, based on each
threshold of each subsample, are analyzed in order to
classify them as:
• group 1: Possibly incorrect or fraudulent (due, for
example, to an anomaly in measurement equip-
ment or a fraudulent loss of invoiced energy)
• group 2: Possibly correct, different from the re-
maining data, but not fraudulent and without mea-
surement errors.
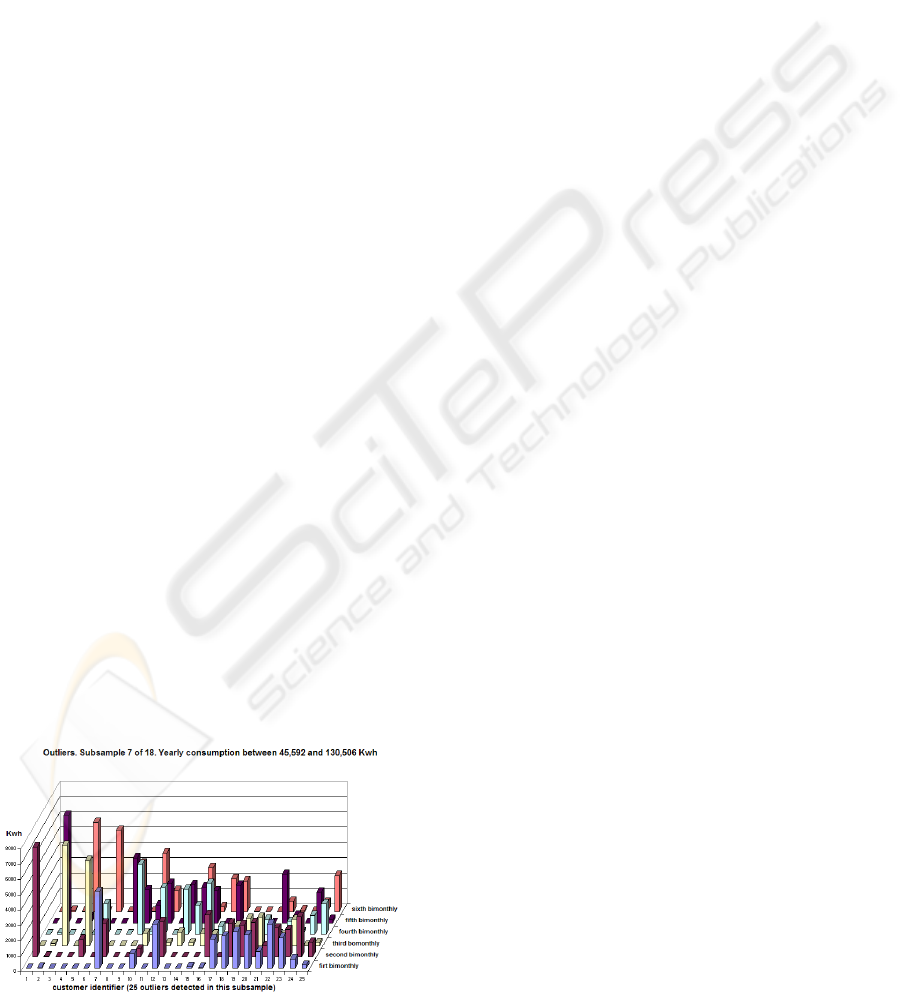
For example, the consumption patterns of outliers,
referring to the subsample 7 of 18, are shown in Fig-
ure 3.
In the lodging sector, the use of new sources of
information, as the power factor or the ’quality’ of
the contract, are necessary to distinguish group one
and group two. The experienced Endesa staff has
checked the general database information, referring
to the group of selected customers (6 private cus-
tomers and 35 lodging sector customers, see Table 1)
by means of a manual task. A specific inspection cam-
paign is included in this selected subgroup.
7 DISCUSSION AND RESULTS
The nature of the problem suggests an unsupervised
mining method. There is no evidence of the num-
ber of anomalies or fraud in customer data bases, be-
Figure 3: Some outliers consumption patterns in lodging
sector.
cause all customers are not inspected. Thus, there is
no evidence of the consumption range on anomalous
or fraudulent customers percentage.
This methodology is general and not bound to a
particular set variables or customer type. The whole
input information needed is taken exclusively from
the general customers’ database. The methodology
has been applied to two different types of users (see
Table 1), and it is now being integrated in a global
customer service, described below:
1. First step. In the proposed mining method, a cus-
tomer’s consumption is compared with the other
customers in the same sample. Similar consump-
tion habits are expected. Only data of bills are
used. We have selected the most relevant outliers
in both samples.
2. Second step. In this point we use contract
database and other data informations, different of
bills (i.e.,read consumption data). The method
supposes that a customer’s consumption habits are
similar under the period of study. We reject, in this
step, customers with a high number of unreliable
readings, customers who have initiated, changed
or canceled their contract in the period of study
and simple abnormalities so obvious: customers
with zero or very low consumption.
3. Third step. Endesa staff have analyzed and in-
spected the ’relevant’ customers. Customers that
Endesa staff are often interested in, include cus-
tomers with long-term high consumption and a
geographical criteria.
In this study, the (customers detected, selected and
inspected)/(anomalous customers) percentage had
reached up to 50%.
The confidence level is high, but the support level,
the percentage of transactions from a transaction data
base that the study satisfies, should be improved. So,
one of the main task in our future research lines is
to analyze and include new sources of information (as
the power factor) in our model. On the other hand, the
customer consumption variability appears as interest-
ing input to current data mining tools, as Bayesian
networks, decision trees, neural networks and other
supervised methods (Kirkos et al., 2007), (Editorial,
2006).
ACKNOWLEDGEMENTS
We would like to thank the initiative and collabora-
tion of Endesa, in particular Tom
´
as Bl
´
azquez, Ignacio
Cuesta, Jes
´
us Ochoa, Miguel Angel L
´
opez and Fran-
cisco Godoy.
A DATA MINING METHOD BASED ON THE VARIABILITY OF THE CUSTOMER CONSUMPTION - A Special
Application on Electric Utility Companies
373

Table 1: Real study results.
Number
of data in
the sample
Outliers Second Step
filter
Customers
inspected by
the ENDESA
staff
Anomalous
customers
Private
customers
105 9 6 2 1
Lodging
sector
4047 440 35 15 8
REFERENCES
Art
´
ıs, M., Ayuso, M., and Guill
´
en, M. (1999). Modeling
different types of automobile insurance frauds behav-
ior in the spanish market. In Insurance Mathematics
and Economics 24 67–81. Elsevier Press.
Art
´
ıs, M., Ayuso, M., and Guill
´
en, M. (2000). Phenomenal
data mining. In SIGKDD Explorations 1(2) (2000)
24–29. SIGKDD Press.
Barao, M. I. and Tawn, J. A. (1999). Extremal analysis
of short series with outliers: sea-levels and athletic
records. In Journal of the Royal Statistical Society
Series C-Applied Statistics 48 67–81.
Brause, R., Langsdorf, T., and Hepp, M. (1999). Neural
data mining for credit card fraud detection. In Pro-
ceeding 11th IEEE International Conference on Tools
with Artificial Intelligence. IEEE press.
Brokett, P. L., Xia, X., and Derrig, R. A. (1998). Using
kohonen’s self-organizing feature map to uncover au-
tomobile bodily injury claims fraud. In The Journal of
risk and Insurance 65(2) 245–274.
Burge, P. and Shawe-Taylor, J. (1997). Detecting cellular
fraud using adaptative prototypes. In Proceeding on
AI Approaches to Fraud Detection and Risk Manage-
ment. 9–13. Menlo Park, CA: AAAI Press.
Cabral, J., Pinto, P., Gontijo, E. M., and Reis, J. (2004).
Fraud detection in electrical energy consumers using
rough sets. In 2004 IEEE International Conference on
Systems, Man and Cybernetics. IEEE press.
Daskalaki, S., Kopanas, I., Goudara, M., and Avouris, N.
(2003). Data mining for decision support on customer
insolvency in the telecommunication business. In Eu-
ropean Journal of Operational Research 145 239–
255. Elsevier press.
Denning, D. (1987). An intrusion-detection model. In
IEEE transactions on Software Engineering 13 222–
232. IEEE press.
Editorial (2006). Recent advances in data mining. In Engi-
neering applications of Artificial Intelligence 19 361–
362.
Fawcett, T. and Provost, F. (1997). Adaptative fraud de-
tection. In Data mining and Knowledge Discovery 1
291–316.
He, H., Graco, W., and Yao, X. (1999). Application of
genetic algorithm and k-nearest neighbors in medical
fraud detection. In Lecture Notes in Computer Science
1585 74–81. LNCS.
He, H. X., Wang, J. C., Graco, W., and Hawkins, S. (1997).
Application of neural networks to detection of medical
frauds. In Expert Systems with Applications 13 (4)
329–363. Elsevier press.
Kantardzic, M. (1991). Data mining: concepts, models
methods ans algorithms. Ed. AAAI/MIT Press, first
edition.
Kirkos, E., Spathis, C., and Manolopoulos, Y. (2007). Data
mining techniques for the detection of fraudulent fi-
nancial statements. In Expert Systems with Applica-
tions 32 995–1003.
Kou, Y., Lu, C.-T., Sinvongwattana, S., and Huang, Y.-P.
(2004). Survey of fraud detection techniques. In Pro-
ceeding of the 2004 IEEE International Conference
on Networking, Sensing and Control. Taiwan, march
21 89–95. IEEE press.
Lunt, T. (1993). A survey of intrusion detection techniques.
In Computers & Segurity, 12 405–418.
Wheeler, R. and Aitken, S. (2000). Multiple algorithms for
fraud detection. In Knowledge based systems 13 93–
99. Elsevier.
ICEIS 2008 - International Conference on Enterprise Information Systems
374
