
AN INFORMATION SYSTEM FOR THE SHORTEST
ORIGEN-DESTINATION ROUTE IN A TRANSPORTATION
NETWORK
Jos
´
e Raymundo Marcial Romero, Oscar S
´
anchez Flores
Facultad de Ingenier
´
ıa, Universidad Aut
´
onoma del Estado de M
´
exico, Toluca, Edo. de M
´
exico, M
´
exico
H
´
ector A. Montes Venegas, Luis Nu
˜
nez V
´
azquez, Israel Hern
´
andez S
´
anchez
Facultad de Ingenier
´
ıa, Universidad Aut
´
onoma del Estado de M
´
exico, Toluca, Edo. de M
´
exico, M
´
exico
Keywords:
Information systems, Transportation systems, Shortest origin-destination algorithms.
Abstract:
There exist several information systems to find and display the shortest origin-destination route in a trans-
portation network. Usually these systems are created by organizations purchasing expensive software aiming
to build them easily, quickly and correctly. This goal, however, still remains elusive. In this paper, an in-
formation system that finds and displays the shortest origin-destination route in a transportation network is
presented. The system is mainly built using free software. In the literature, there were found at least three fast
algorithms to obtain the shortest route in a given network. From these three, one was selected for being more
efficient and less memory consuming according to the experimental analysis carried out. The functionality of
the system is showed using Toluca’s transportation network, one of the largest cities in Mexico.
1 INTRODUCTION
The widespread use of Information and Communica-
tion Technologies has increased the interest in new
developments in computing. One of such devel-
opments are the Geographical Information Systems
(GIS). GIS technology has been extensively used to
deal with issues such as crime analysis (Chainey and
Ratcliffe, 2005), meteorology (Dyras et al., 2005),
transportation (Wu, 2007; Mitra, 2007), urban plan-
ning (Easa and Chan, 2000), among other applica-
tions.
Nowadays, a desirable and often necessary fea-
ture of a GIS is the presentation of geographical in-
formation in real time over the internet. There is
a huge amount of software both commercially and
freely available to design such applications. The wide
variety of applications supported by commercial soft-
ware has been one of the strong advantages over free
software which is often limited to the level of tech-
nical support available and to what the free software
group is interested in. However, commercial soft-
ware for GIS applications has been characterized for
its high licensing costs (Newham and Field, 2001).
A common use of a GIS is the cartographi-
cal presentation of a required place. For example
GoogleMaps (http://maps.google.com) is well known
for presenting the cartography of a vast number of
cities in the world. The design of a GIS for other
applications such as calculating and displaying the
shortest Origin-Destination (O-D) route over a trans-
portation network has not been widely carried out
over the world. One of the limitations to develop
this kind of applications is the necessity of an accu-
rate database with the required information. In differ-
ent continents around the world there are well known
applications. One of such applications is MapQuest
(http://www.mapquest.co.uk) developed in the United
Kingdom. Even though we can search in MapQuest
for maps of almost every country around the world,
the O-D route is limited to European and North Amer-
ican countries. GoogleMaps, Map24, among others
are not the exception.
In this paper, an Information System (IS) is pre-
sented which integrates: Geographical information,
database information and freely available software.
The IS finds and displays the shortest route between
two different places in a transportation network. One
of the relevant characteristics of our IS is that it can
be used freely in any city or country provided the re-
quired database information is available. Our IS is
tested in the transportation network of Toluca, one of
409
Raymundo Marcial Romero J., Sánchez Flores O., A. Montes Venegas H., Nuñez Vázquez L. and Hernández Sánchez I. (2008).
AN INFORMATION SYSTEM FOR THE SHORTEST ORIGEN-DESTINATION ROUTE IN A TRANSPORTATION NETWORK.
In Proceedings of the Tenth International Conference on Enterprise Information Systems - HCI, pages 409-412
DOI: 10.5220/0001722304090412
Copyright
c
SciTePress

the main cities of Mexico.
The paper is organized as follows. In Section 2,
the algorithm used to implement the shortest O-D
route is described. In Section 3, the components used
to build the GIS are presented. In Section 4 the func-
tionality of the GIS is shown. In Section 5, the inter-
face and the answers given by the GIS are presented.
Finally, in Section 6 conclusions and future perspec-
tives are given.
2 ALGORITHMS FOR THE
SHORTEST ROUTE PROBLEM
The analysis of network and transportation systems
within a GIS has become a common practice in many
applications areas. A key problem in network and
transportation analysis is computing the shortest path
between two different locations, especially when the
number of total locations in a real network is of con-
siderable size. Zhan and Noon (Zhan and Noon,
1998) study most of the algorithms for the shortest
route finding a set of three algorithms that perform
efficiently on real road networks. The algorithms
are: 1) the graph growth algorithm implemented with
two queues (TQQ), 2) the Dijkstra’s algorithm imple-
mented with approximate buckets, and 3) the Dijk-
stra’s algorithm implemented with double buckets.
Later on, Zhan (Zhan, 1999) presented the data struc-
tures and some implementation strategies related to
the algorithms. Pallottino (Pallottino, 1984) showed
that the TQQ algorithm performs better than the other
two, running in O(n
2
m) time in the worst case. For
this reason, we use the TQQ as part of the IS pre-
sented in this paper. The algorithm used to compute
the shortest O-D route is at the core of our IS in order
to provide proper and efficient responses to user re-
quests. Similarly, a number of other important com-
ponents were used to build the system as an integrated
and independent application. We discuss those in the
next section.
3 COMPONENTS OF THE IS
The great variety of applications to design a GIS leads
to employ a criterion to select those that offer the best
functionality for the system to be built. In this Sec-
tion the major software components used to build the
Information System are described.
Amongst the open source operating systems con-
sidered, the Linux CentOS distribution was cho-
sen. CentOS is a freely available linux distribution
based on the popular Red Hat Enterprise Linux (Jang,
2004). It supports 64 bits processors, is stable, is safe
and it offers sufficient user support.
PostgreSQL (Douglas and Douglas, 2005) is a
well known SQL compliant, open source object-
relational Database Management System. Since the
realease of 7.4.8 version, module PostGIS (Michell,
2005) is included, which gives support for geo-
graphic objects. This new module allows to design
an object-relational database inside PostgreSQL. The
use of this feature as a backend for the GIS, al-
lows the manipulation of spatial data, such as ESRI
SDE (http://www.esri.com) the spatial extension from
Oracle
TM
(Rahayu, 2005).
Tomcat (http://www.apache.org) was used as a
web container coupled with the web server Apache
to support applications using the Java Development
Kit (JDK). Both Tomcat and Apache are configured to
work in a virtual host architecture in order to receive
the income requests at the port 8080 and only those
requiring the execution of Java Server Pages (JSP)
are sent internally to Tomcat.
MapServer (Kropla, 2005) is an open source
development environment for designing and im-
plementing spatially-enabled internet applications.
MapServer allows to create ”geographic image
maps”, that is, maps that can direct users to content.
MapServer is an interpreter for spatial data. The pow-
erful capabilities and support that MapServer brings,
was the best option for our Information System.
In Addition to the software described above, some
packages were added to improve interaction and func-
tionality for users and developers. Among this soft-
ware MapScript, Proj4, GDAL, QGIS, pgAdmin III
and JDBC were used.
4 THE IS AT WORK
The objective behind our IS is to integrate both a
friendly to use and a friendly to manage system.
This involves enabling diverse hardware an software
components to work together, sharing maps and data
throughout a common communication channel. It is
expected, thus, that having an IS like this available in
real time over the Internet, requires to solve a large
number of technical details. This section provides an
overview of the way the system works both internally
and under the command of the end user.
4.1 The System Internals
The diagram depicted in figure 1 shows the main com-
ponents of our IS. The Database Management System
ICEIS 2008 - International Conference on Enterprise Information Systems
410
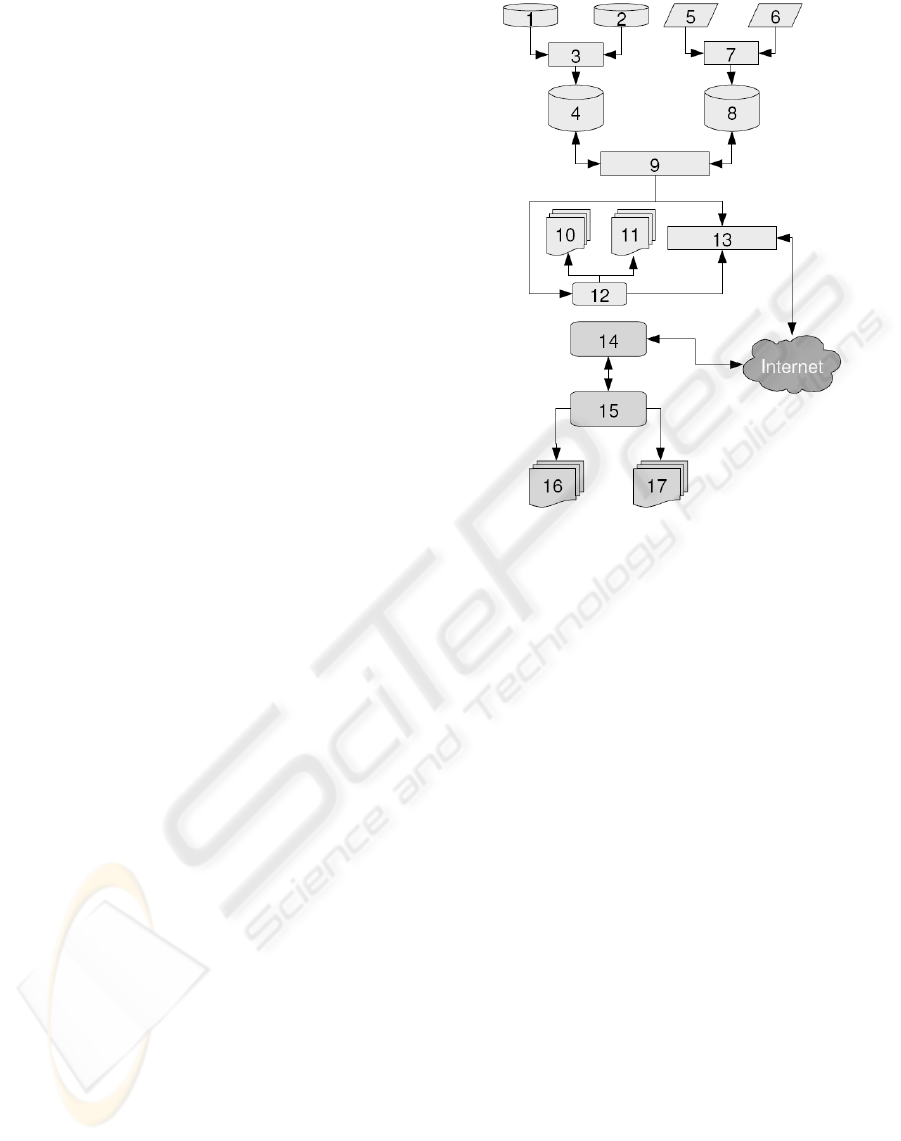
PostgreSQL (9 in figure 1) heavily interacts with sta-
tistical and cartographical information coming from
different sources. The statistical information is orig-
inated from a number of databases provided by gov-
ernmental organizations and private companies (1 in
figure 1). Additional information also comes in the
form of simple tabular data (2 in figure 1) and is pro-
vided by several vendors and also collected by des-
ignated staff. This two pieces of information need to
be validated, integrated and standardized according to
the format of our database design (4 in figure 1). Car-
tographical information is also originated in formats
similar to those of statistical information (5 & 6 in
figure 1) and also goes through a validation and stan-
dardization process using QGIS (7 in figure 1). The
subsequent step is to use PostGIS (8 in figure 1) to
add the cartographical data to the central database (9
in figure 1). This is the core of the entire IS.
The remaining components provide the user in-
terface and create a communication link between the
central database and the end user. Throughout any
web browser (14 in figure 1), users can make a query
to the IS. The response to a certain query might al-
ready be predefined and stored (15 in figure 1), so
the answer can be given with no delay in the form
of either statistical reports and graphs (16 in figure 1)
or with cartography and thematic maps (17 in fig-
ure 1). Finally, communications are properly handled
by Apache and Tomcat (13 in figure 1) to alow the
GIS software MapServer (12 in figure 1) to gather
data from the central database and present it to the
user in the form of statistical information and maps
(10 &11 in figure 1).
4.2 The User Interface
The GIS is the central part of the whole Information
System. The sequence of steps taken to give a re-
sponse to any given query are as follows:
1. The user introduces a pair of streets representing
the origin point, i.e., the intersection of the streets
must exists. Similarly, the user introduces a pair
of streets representing the destination point.
2. If the data entered is correct, a search in the data-
base is performed in order to find the nodes that
represent the streets given by the user. The re-
sult may be more than one intersection depend-
ing on the number of streets with the same name
found. This is not a database inconsistency. The
existence of duplicate street names often occurs
among different areas of large cities.
3. The algorithm described in Section 2 is executed
in order to get the shortest routes of the given
nodes.
Figure 1: Diagram of the main components of the Informa-
tion System.
4. As a result, for each O-D route found, the se-
quence of nodes, which has to be traversed in or-
der to get the proper direction, is obtained.
5. From the sequence of nodes, the SQL query
is built to obtain the appropriate map from
MapServer.
6. The sequence of nodes is transformed to the cor-
responding sequence of streets names by means
of a query to the database.
7. The set of results is displayed to the user. The user
has then to choose one of them to build the map.
8. Mapserver is initialized and the corresponding
map is drawn with the route calculated.
5 A SAMPLE OF TEST RESULTS
The Information System described in this paper was
tested using the geographical data from the city of
Toluca (www.toluca.gob.mx). Toluca is the state cap-
ital of the State of Mexico in central Mexico. It
is located 63 kilometers from Mexico City and is a
very successful industrial and commercial center. The
municipality of Toluca, which includes several com-
munities, has a geographical extent of 420.14 km
2
.
In the 2005 census (INEGI, 2005) 467,713 people
were reported living in the city of Toluca, 747,512
AN INFORMATION SYSTEM FOR THE SHORTEST ORIGEN-DESTINATION ROUTE IN A TRANSPORTATION
NETWORK
411

living in the municipality of Toluca, and 1,610,786
in the twelve municipalities that make up its entire
metropolitan area.
Table 1 shows a small sample of various query
instances and the time taken by the IS to give a re-
sponse. It is worth noting that each instance is evalu-
ated in real time. The tests were carried out in a 64-
bits Server with 2GB in RAM and 1.8 Hz dual core
processor.
Table 1: Time and routes found in several instances.
Instance O-D routes found Time taken
1
23611.06 m
18769.40 m
17123.91 m
13330.05 m
8675.97 m
13364.39 m
1715.93 m
36.94 s
2 16594.72 10.95 s
3 2715.31 m 13.6 s
4
2464.52 m
2528.62 m
2450.52 m
8.7 s
6 CONCLUSIONS
In this paper we have described an Information Sys-
tem built using free software to compute and display
the shortest origin-destination route in a transporta-
tion network. GIS technology and Internet commu-
nications are used to manipulate spatial data and to
respond to user requests in real time.
In a large number of instances, the information
delivered provides effective and attractive results, but
they still remain expensive to integrate and to deploy.
In this sense, free software offers a cost-effective al-
ternative to counteract the economic burden of imple-
menting large scale IS.
Nevertheless, implementing GIS technology us-
ing free software should not be taken as a univer-
sally proven proposition. While the economic ben-
efits could be sufficient to opt for a free software en-
semble, the recognized problems associated with non-
commercial software should not be ignored. There-
fore, the potential costs and benefits must be under-
stood in the context of the particular environment in
which the Information System is implemented.
Finally, before deciding which Information Sys-
tem should be used for a particular need, it is essen-
tial to realize and accept the numerous costs associ-
ated with the technology to be implemented. Hard-
ware needs, permanent staff and maintenance costs
must be taken into account. In addition, the often for-
gotten time cost must also be considered, for in many
cases, a couple of years is required to start seeing sig-
nificant and palpable results. Nevertheless, the costs
of implementing GIS technology are lower than ever,
and before looking for expensive solutions is always
advisable to learn from previous experiences.
REFERENCES
Chainey, S. and Ratcliffe, J. (2005). GIS and Crime Map-
ping. John Wiley & Sons.
Douglas, K. and Douglas, S. (2005). PostgreSQL. A com-
prehensive guide to building programming and ad-
ministering PostgreSQL databases. Sam’s Publishing.
Dyras, I., Dobesch, H., Grueter, E., Perdigao, A., Tveito,
O. E., Thornes, J. E., van der Wel, F., and Bottai, L.
(2005). The use of geographic information systems in
climatology and meteorology. Meteorology Applica-
tions, 12(1):1–5.
Easa, S. and Chan, Y. (2000). Urban Planning and De-
velopment Applications of GIS. American Society of
Civil Engineers.
INEGI (2005). Conteo 2005. INEGI, www.inegi.gob.mx.
Jang, M. (2004). Mastering Red Hat Enterprise Linux 3.
Red Hat Inc.
Kropla, B. (2005). Beginning Mapserver: Open Source GIS
Development. Apress.
Michell, T. (2005). Web Mapping. O’Reilly.
Mitra, S. (2007). Analyzing satellite imagery to develop
freight generation data. In Proceedings of the Geospa-
tial Information Systems for transportation sympo-
sium.
Newham, L. T. H. and Field, J. B. (2001). Gis - expen-
sive toys or useful tools? case studies in landcare re-
source assessment and planning. In Proceedings of
Geospatial Information and Agriculture Conference,
pages 36–47.
Pallottino, S. (1984). Shortest-path methods: Complex-
ity, interrelations and new propositions. Networks,
14(2):257–267.
Rahayu, W. (2005). Object-Oriented Oracle. IRM Press.
Wu, P. (2007). Modeling transportation-related emissions
using gis. In Proceedings of the Geospatial Informa-
tion Systems for transportation symposium .
Zhan, F. B. (1999). Three fastest shortest path algorithms
on real road networks: Data structures and proce-
dures. Journal of Geographic Information and De-
cision Analysis, 1(1):69–82.
Zhan, F. B. and Noon, C. E. (1998). Shortest path al-
gorithms: An evaluation using real road networks.
Transportation Science, 32(1):65–73.
ICEIS 2008 - International Conference on Enterprise Information Systems
412
