
EXTRACTING CLASS STRUCTURE BASED ON FISHBONE
DIAGRAMS
Makoto Shigemitsu and Yoshiyuki Shinkawa
Graduate School of Science, Technology, Ryukoku University, 1-5 Yokotani, Ooe, Seta, Ootsushi, Shiga, 520-2194, Japan
Keywords:
Object orientation, non-routine applications, software development, fishbone diagrams, education assistance
software.
Abstract:
Current software development methodologies usually assume the existence of definite rules and processes in
target problem domains. However, in the software development for non-routine applications, this assumption
might decrease the productivity, and makes it difficult to identify the optimal solutions. The paper proposes a
development method for such software development using fishbone diagrams in order to analyze the require-
ments of stake holders, which can finally derive UML diagrams from the cause-result structure defined by
the fishbone diagrams. The method could improve the productivity of the above development, creating high
quality software specifications. We also show a case study on developing education assistance software using
the proposed method.
1 INTRODUCTION
Software development methodologies usually include
such tasks as “requirement elicitation”, “requirement
analysis”, and “requirement definition”, in order to
identify requirements, namely to determine what the
system to be developed should do for resolving the
problems in a target domain (Ian Sommerville, 1992).
There are different approaches to these tasks depend-
ing on the methodologies they employed. For ex-
ample, in a structured analysis and design methodol-
ogy (Demarco, 1979), the requirements are obtained
through functional decomposition, focusing on the
data flows and data transformationswithin a targetdo-
main. The requirements are finally expressed as a set
of data flow diagrams in this methodology. On the
other hand, in object orientation (Booch, 1993)(et.al,
2000), the requirements are obtained through more
multifaceted analysis, e.g. usage analysis, scenario
analysis, or Class - Responsibility - Collaborator
(CRC) analysis. These analyses provide us with the
objects with their attributes, operations, and behav-
ior, along with the interactions between objects. The
requirements are represented using UML (Unified
Modeling Language) (Miles and Hamilton, 2006) di-
agrams, or other object oriented notations.
These methodologies assume definite rules and
processes in the problem domain, and we only sum-
marize them to define the requirements through the
analysis. They are effective for developing routine
applications such as enterprise information systems
or embedded software. However, when we attempt
to apply them to non-routine applications, we often
are faced with several difficulties, since there are no
definite rules and processes in such applications.
A trial and error approach, e.g. prototyping, has
usually been used in such non-routine application de-
velopment. However, it causes low productivity or
it makes it difficult to identify the optimal solutions,
because of the lack of well defined methodologies or
guidelines.
This paper proposes a comprehensive approach to
extracting and defining requirements in non-routine
applications by focusing on cause and effect rela-
tions that are represented in the form of fishbone dia-
grams(Sue, 1995), which are often used in QC (Qual-
ity Control)(Dailey, 2005) activities. In addition, a
systematic procedure is also presented, which can
transform the results of analysis into UML diagrams.
After the requirements are represented in the form of
UML diagrams, we can follow the traditional devel-
opment methodologies for designing, programming,
testing, and maintaining systems.
A programming assistance system was used as a
typical non-routine application in order to evaluate
this approach. In this example, we examine the causes
460
Shigemitsu M. and Shinkawa Y. (2008).
EXTRACTING CLASS STRUCTURE BASED ON FISHBONE DIAGRAMS.
In Proceedings of the Tenth International Conference on Enterprise Information Systems - ISAS, pages 460-465
DOI: 10.5220/0001726904600465
Copyright
c
SciTePress

of the problems in programming education, and ex-
tract the requirements from these causes to transform
them into UML diagrams for designing and program-
ming the system.
The paper is organized as follows. In section 2, we
discuss essential problems in developing non-routine
applications. Section 3 introduces fishbone diagrams
which are used to identify the requirements in such
application domains. We also propose a procedure to
identify the requirements and to transform them into
UML diagrams in the section. Section 4 shows a case
study of the proposed approach.
2 POSSIBLE PROBLEMS IN THE
DEVELOPMENT OF
NON-ROUTINE APPLICATIONS
In general, there are two different categories of ap-
plications, from which we extract the requirements
for the software systems to be developed. The first
category is for routine applications, in which pro-
cesses, rules, and usages of the system are definitely
defined, and the second is for non-routine applica-
tions, in which those are vaguely defined or not de-
fined. Requirement analyses in traditional software
development methodologies assume the target do-
main to be for a routine application. In cases of a non-
routine application, we usually extract the require-
ment iteratively, using a trial and error based proto-
typing method, and presenting prototypes to clients in
each iteration for mutual agreements. Consequently,
it causes low productivity or it makes it difficult
to identify the optimal solutions. The requirement
analyses and definitions are regarded as important in
large-scale software developments for routine appli-
cations, however a non-routine application develop-
ment is usually a small-scale one, and in such a case,
agile software development methods, e.g. XP (eX-
treme Programming), are more suitable. As a result,
a source code centric approach is taken in this devel-
opment, which make it difficult to reflect the require-
ments from clients and markets.
One of the important roles of software develop-
ers is to realize exactly the behavior and functionality
of the system that clients or users expect. Therefore,
software developers have to recognize what clients
or users expect. This requires the developers to per-
form requirement analysis and definition before cre-
ating the functional specifications and module spec-
ifications of the software to be developed. Even in
small-scale software developments, it is important to
define the requirements and expectations of clients to
the system to be developed, and to create accurate
functional specifications. In the requirement anal-
ysis of routine applications, we usually follow the
five steps of “extraction”, “analysis”, “specification”,
“validation”, and “maintenance”, and there are estab-
lished methodologies for these steps. However, few
methodologies are established for requirement anal-
ysis and definition in non-routine software develop-
ment.
The situation we are put in non-routine applica-
tion resembles that of quality improvement problems
in QC (Quality Control) management. In quality im-
provement, or kaizen, which is originated in Japanese
manufacturing industries, many unrelated factors as-
sociated with the quality have to be organized into
well-defined and structured cause and result rela-
tionships. Similarly in non-routine application de-
velopment, we have to deal with many fragmented
problems, requirements, facts, and constraints, which
must be summarized into specifications.
In the next section, we present how QC techniques
are applied to non-routine applications.
3 TRANSFORMING FDM BASED
REQUIREMENT DEFINITIONS
INTO UML DIAGRAMS
3.1 Requirement Analysis and
Modeling of Non-Routine
Applications based on Fishbone
Diagrams
FDM (Fishbone Driven Method) that this paper pro-
poses can relieve above mentioned problems in re-
quirement analysis and definition for non-routine ap-
plications, in which no procedures or system usages
are previously defined. Requirements for non-routine
applications are usually ambiguous and difficult to ex-
tract. In addition, even if we can extract the require-
ments, it is difficult to organize them into specifica-
tions, since there are few explicit relationships be-
tween each requirement. This ambiguity decreases
the productivity of the development of non-routine
applications. Therefore, if there is a systematic way
to organize ambiguous requirement into specification,
the above productivity would be improved.
Following is a brief procedure of FDM.
1. We first extract the factors that cause the prob-
lems, from which client requirements arise, then
organize them using fishbone diagram.
EXTRACTING CLASS STRUCTURE BASED ON FISHBONE DIAGRAMS
461
2. We examine possible solutions corresponding to
each factor, and then define the optimal solutions.
3. We design functional units of software, e.g. meth-
ods in JAVA, from the defined solutions. And we
replace each of the factors of fishbone diagrams
with the above methods.
4. We divide the diagram into multiple parts that
compose sources of classes, based on a deter-
mined criterion discussed later.
5. We derive UML diagrams using the above parts
and methods.
As a typical example of non-routine applications,
we pick up programming education support. The
clients of this application can enumerate the problems
with which they are faced, even though they do not
understand the requirements and specifications to be
implemented.
For example, clients can state “we need a software
product that helps the students to understand pro-
gramming more exactly”, even though they do not un-
derstand the explicit requirements. The above state-
ment implies the problems of “the students do not un-
derstand programming exactly”. Once we identify the
problem, we can find out the factors of it by analyz-
ing the problem, to which we think up the solutions.
Through these solutions, we can define the specifica-
tions for the software to be developed. Since these so-
lutions can resolve the client’s problems implied, and
can be transformed into system specifications, which
satisfy the system behavior that the clients anticipate.
The transformed specifications are derived from prob-
lem factors, and they reflect the optimal solutions.
Thereforethey could be more excellent than those that
created by prototyping.
In this approach, it is important to analyze each
problem factors and there relationships. FDM uses
fishbone diagrams for this analysis.
3.2 A Brief Introduction to Fishbone
Diagrams
Quality Control (QC) often deals with vague require-
ments, e.g. “quick delivery to customers”, “decrease
the defect ratio”, or “increase customer satisfaction”,
and in such cases, we have to obtain necessary in-
formation for quality improvement from verbal data.
This technique can be applicable to requirement def-
initions in non-routine applications, which include
many vague requirements. In this section, we briefly
introduce fishbone diagrams used in QC.
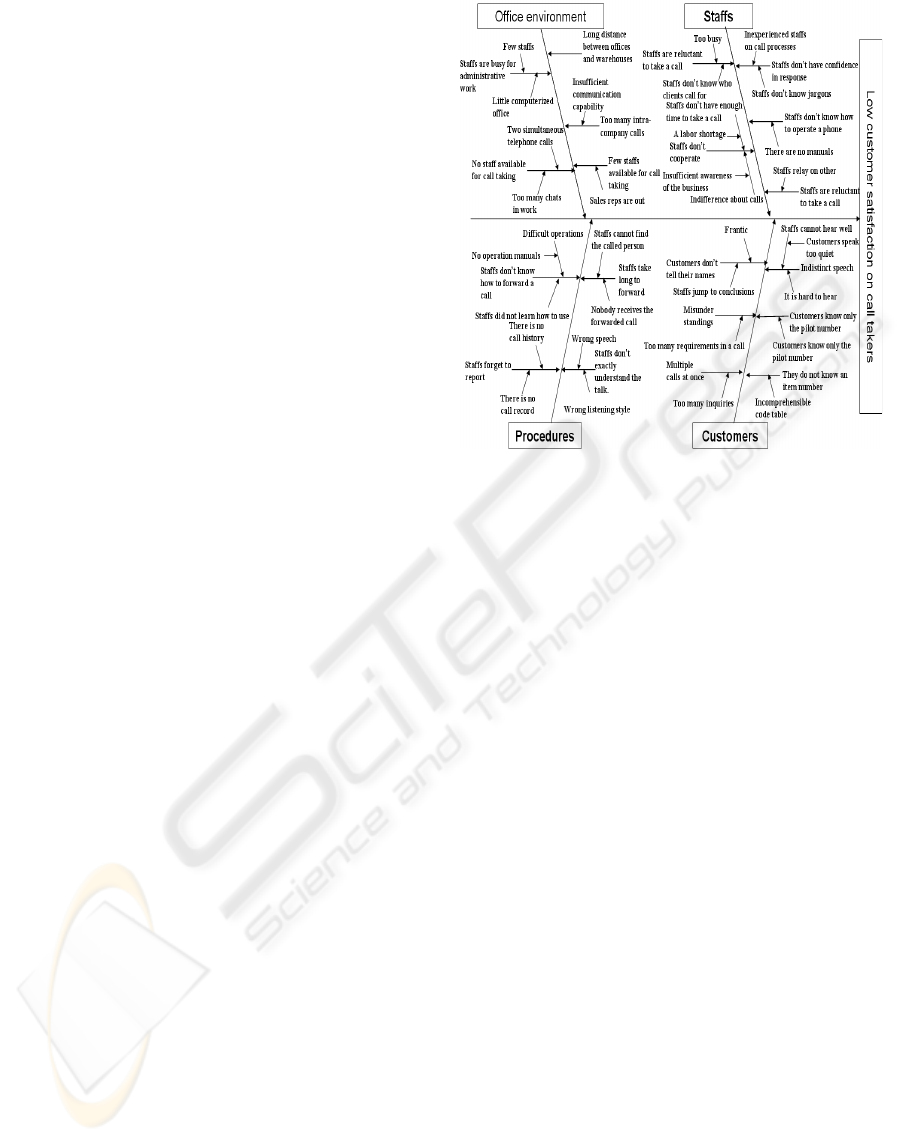
A fishbone diagram provides us with a systematic
way to find out all the factors behind a problem. If
Figure 1: A example of a fishbone diagram.
there is a problem, there must be some factors be-
hind it, and these factors also havetheir factors behind
them, unless they are not primitive ones. Such cause-
result relationships can be represented as hierarchical
structures.
A fishbone diagram depicts these hierarchical
structures. For example, if there is a sales office
showing low customer satisfaction with telephone re-
sponses, we can express this problem using the fish-
bone diagram in Figure 1. In a fishbone diagram,
an original problem is written at the right of the di-
agram at the end of the main “bone”.The main possi-
ble factors of this problem are written down in rect-
angles at top or the bottom of the diagram at the end
of the large bones off of the main bone. The factors
of the above each factor are drawn off of the above
large bone, which compose smaller bones. These fac-
tors are decomposed iteratively in the same way un-
til the final factors are found out. As a result, cause
and effect relationships of the problem are systemat-
ically expressed in this diagram. This diagram rep-
resents the factors more understandable than enumer-
ated ones. In addition, all the possible factors can be
found out through an exhaustive approach in fishbone
diagram creation.
3.3 Mapping Solutions to Specifications
In order to examine whether fishbone diagrams can
be applied to requirement analysis of the software for
non-routine applications, we try to apply it to devel-
opment of a programming education support system.
ICEIS 2008 - International Conference on Enterprise Information Systems
462

As an example, we pick up such ambiguous require-
ment as “we need a software product that helps the
students to understand programming more exactly”,
then analyze using a fishbone diagram. The above
client requirement implies a background problem that
can be expressed as “students do not understand pro-
gramming”. Therefore, the client requires the solu-
tion of this background problem.
This background problem is analyzed using a fish-
bone diagram. Each factor that occurs in the fishbone
diagram causes the problem directly or indirectly, and
the solution for it satisfies a part of the customer re-
quirement. For example, if a factor “dynamic algo-
risms in a textbook are difficult to understand” occurs
in the diagram, there could be a solution “explanation
using motion pictures”. This solution can be regarded
as a part of the software function that the clients an-
ticipate. Therefore, we can define the software spec-
ifications that the clients anticipate, by analyzing the
programs behind the client requirements, and then by
designing a corresponding solution to each factor in
the fishbone diagram, succeeded by expressing it as
the specifications. We call a fishbone diagram that
includes the corresponding solutions to factors as a
“requirement structure diagram”. Each solution in a
requirement structure diagram represents a function
to be implemented in the software specification, and
the solutions are categorized based on the factors of
the original problem. The most detailed level solu-
tions are implemented as methods or functions, which
compose the classes of the software to be developed.
This approach can be generalized as follows. Let
R be a client requirement, and R be a software specifi-
cation that cannot be implemented by the client him-
self. We define generalized factors and solutions iter-
atively in the following way.
1. A solution for the factor Q
−→
p
is denoted as Q
′
−→
p
,
where
−→
p represents a series of natural numbers.
2. If a factor Q
−→
p
has farther factors that cause Q
−→
p
these factors are denoted as Q
−→
p −n
(n=1,2,...).
3. The highest level factors are denoted as Q
n
(n=1,2,...).
If we can implement the solution Q
′
−→
p
that occur in
the requirement structure diagram, the original prob-
lem Q
−→
p
is considered to be resolved, and they satisfy
a part of the original requirement, that is Q
′
n−m
⊆ R
′
holds. Consequently, R
′
⊆ ∪Q
′
−→
p
holds. Q
′
−→
p
is a solu-
tion that the clients did not notice, and the one that is
derived from the requirement structure diagram. The
most detailed level solutions {Q
′
−→
p
} are regarded as
methods or functions, and these are organized into
classes. We can define ambiguous requirements, and
can determine the class structure by deriving require-
ment structure diagrams from fishbone diagrams of
the original requirements.
3.4 Transforming a Requirement
Structure Diagram into UML
Diagrams
In 3.3, we discussed a way to derive class diagrams
from fishbone diagrams using requirement structure
diagrams. In this section, we present how fishbone
diagrams are transformed into requirement structure
diagrams in FDM. The following three translation ta-
bles are used for the above translation.
• Assign a unique number for each factor in a fish-
bone diagram, and then note these numbers in the
translation table 1.
• For each factor in the translation table 1, define the
solution for it, in order to complete the translation
table 2.
• For each solution in translation table 2, define ac-
tors and their behavior associated with it, in order
to complete the translation table 3.
By the translation table 2, we can analyze the detailed
requirements which we can not obtain trough hear-
ing, and can define the solutions for each requirement.
Based on the agreement on the translation table 2 be-
tween the clients and the developers, the actors and
their behavior are defined, which are associated with
each solution. The above defined items are identical
to use cases in UML. A “requirement structure dia-
gram” is a fishbone diagram, each factor of which
represents the solution that corresponds to the origi-
nal factor.
In object orientation, class diagrams are most es-
sential diagrams to develop software. A class is a set
of data and associated operations, which can be cat-
egorized based on its role or purpose. Each method
in a requirement structure diagram is classified based
on the purposes, and this classification is similar to
that of the classes. A bone to which a method is at-
tached directly represents the factor to be resolved by
the method, and the factor is regarded as a purpose.
This purpose is also a solution for another purpose if
it is decomposed from another factor. A set of all the
methods can resolve all the factors reside in a fishbone
diagram. Even though we can categorize the methods
in any granularity based on the bone structure which
represents the relationship between purposes and so-
lutions, all the requirement structure diagrams always
have three major bone types, that is “main bones”,
“large bones”, and “small bones”, and other lower
level bones might not included.
EXTRACTING CLASS STRUCTURE BASED ON FISHBONE DIAGRAMS
463

Therefore, we define initial class categories based
on the small bones, which any requirement structure
diagrams include. The modeling procedure is sum-
marized as follows.
1. Determine the most important customer require-
ment from client statements and software usage
conditions through hearing.
2. Examine the background factors of the require-
ment to define the essential problem.
3. Create a fishbone diagram for the problem with
the clients.
4. Assign a unique number to each factor and tran-
scribe them onto a table which is referred to as
a “transformation table 1”. This table is used to
transform the fishbone diagram to a requirement
structure diagram.
5. For each factor in the transformation table 1, find
out the solution and its effects, then note it down
to the table to create a “transformation table 2”.
6. Confirm the customers whether each solution and
its effects satisfy their requirements.
7. Identify the actors and their activities which are
associated the solutions in the transformation ta-
ble 2, then note them down to the table to create a
“transformation table 3”.
8. Replace each factor in the fishbone diagram with
the corresponding activity in the transformation
table 3 in order to create a requirement structure
diagram.
9. Integrate the duplicate methods or classes into sin-
gle ones through the requirement structure dia-
gram.
10. Define class diagrams based on the small bones in
the requirement structure diagram.
11. Derive use cases from the actors and their activ-
ities defined in the transformation table 3, and
then deploy them into activity diagrams and se-
quence diagrams according to usual object ori-
ented methodologies.
4 A CASE STUDY
As stated in section 3.2, we assume a client claims
“we need a software product that helps the students
to understand programming more exactly”. If the
factor of this requirement is defined as “students do
not understand programming”, the fishbone diagrams
from this factor can be depicted as shown in Figure 2.
For each factor derived from the original factor “stu-
dents do not understand programming”, define the so-
lution for it and write it down to the appropriate place
in the diagram, and through the above mentioned
three translation tables, we can create the requirement
structure diagram shown in Figure 3. In this figure,
we consolidate duplicate solutions or methods into
one. From this requirement structure diagram, the use
case diagrams, activity diagrams, sequence diagrams
are created. Through this example, we learned the
following lessons.
Firstly, we found that each method derive from
the translation table 3 represents the solution to the
requirement from the clients, which are identified by
the fishbone diagram, and the set of these methods
reflect the original factor or problem in the fishbone
diagram, that is, the original clients requirement.
Secondly, we found all the factors that are iden-
tified by the fishbone diagram are mapped into the
solutions in the translation table 2, and therefore all
the identified problems can be thought to be resolved.
The specifications for these solutions satisfy all the
clients requirements. By FDM, we can define the
clients requirements explicitly to define the specifi-
cations.
Thirdly, we found we can define the specifica-
tions in the early stage in the development, since we
can create the requirement structure diagram from the
fishbone diagram swiftly. Since all the specifications
are defined in the early stage of the development, we
can reduce the risk to fail the development because of
incomplete specifications.
Lastly, we found the classes are derived usually
from small bones, however in some cases, they are
derived from other bone types. For example, the
factor “inconvenient lecture environment” in Figure
2 is mapped to the class name “assistance charac-
ter” in Figure 2 through translation tables. One of
the detailed factor “cannot see the instructor well”
is mapped to the lowest class “assistance character”.
This lowest class includes the actual methods “dis-
play the character”, “display speaking motion”, and
“display blinking motion”. As shown above, a class
that is mapped from one of the most detailed factors
includes methods. This example represents the whole
procedure of FDM.
5 CONCLUSIONS
In this paper, we proposed FDM (Fishbone Driven
Method) which can identify the non-routine require-
ments in such applications that no predefined pro-
cedures or system usage are known. Using FDM,
ICEIS 2008 - International Conference on Enterprise Information Systems
464
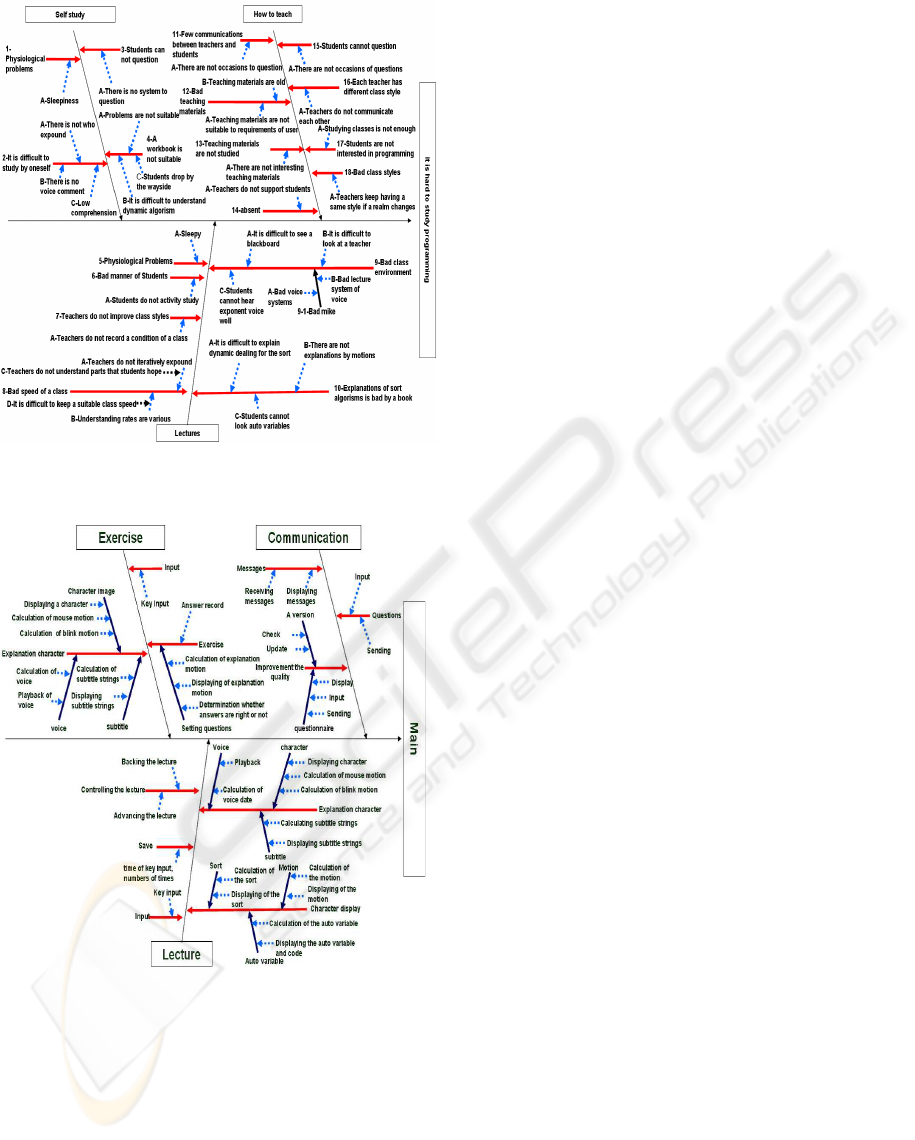
Figure 2: A fishbone diagram.
Figure 3: A requirement structure diagram.
we can reflect these requirements to the specifica-
tions. FDM adopts fishbone diagrams often used
in QC (Quality Control) management and examine
cause and effect relationships between the factors by
these diagrams. Through these examinations, we can
organize the procedures in order to analyze and de-
fine the non-routine requirements. From the defined
methods and requirement structure diagrams, we de-
rive use case diagrams, activity diagrams, sequence
diagrams, and class diagrams to complete require-
ment models. By applying FDM to the develop-
ment of a programming education support system,
we showed we could define appropriate class struc-
tures with methods from a single ambiguous client re-
quirement. In FDM, clients and developers can share
the translation tables which describe the requirements
and solutions explicitly, and as a result, we can easily
modify or add the functionality in the tables, without
any misunderstanding.
FDM assumes small scale development, since it
derive the solutions directly from requirements in
translation table 2. On the other hand, in large scale
software development, the requirements must be de-
composed in more detailed way than FDM. However,
FDM can deal with ambiguous requirements in non-
routine applications, in which no detailed require-
ments are predefined and no determined processes ex-
ist.
By applying FDM, we make it possible to de-
fine and analyze the ambiguous requirements in non-
routine applications, which are difficult to be dealt
with traditional methodologies. In addition, the func-
tionality of the system can be described systemati-
cally in translation tables and requirement structure
diagrams, and we can easily determine class struc-
tures. Therefore, FDM can increase the productivity
of small scale software developments in non-routine
applications.
REFERENCES
Booch, G. (1993). Object-Oriented Analysis and Design
with Applications. Addison-Wesley Professional.
Dailey, K. W. (2005). The Kaizen Pocket Handbook. DW
Publishing Co.
Demarco, T. (1979). Structured Analysis and System Spec-
ification. Prentice Hall PTR.
et.al, I. J. (2000). Object-Oriented Software Engineering.
ADDISON-WESLEY.
Ian Sommerville, P. S. (1992). Requirements Engineering:
A Good Practice Guide. Wiley.
Miles, R. and Hamilton, K. (2006). Learning UML 2.0.
O’REILLY.
Sue, E. R. (1995). Cause-and-Effect Diagrams. ORIEL
PRESS,.
EXTRACTING CLASS STRUCTURE BASED ON FISHBONE DIAGRAMS
465
