
An Approach to Simulate Enterprise Resource Planning
Systems
André Bögelsack, Holger Jehle, Holger Wittges, Jörg Schmidl and Helmut Krcmar
Department of Informatics, Technische Universitaet Muenchen
Boltzmannstraße 3, 85748 Garching
Abstract. Enterprise Resource Planning (ERP) systems are an essential part of
the infrastructure to run and support a company’s business processes. These
systems have to be updated frequently to satisfy law regulations, needed
functionality and sustain stability within a changing technical environment.
Having these needs for change in mind the impact of related updates is often
not transparent to the operator and may cause unwanted side-effects. The way
to prevent update problems is running a shadow system and deploy changes
there first. However this is not always feasible due to monetary or other
reasons. One proper approach might be the simulation of ERP systems.
Therefore this workshop paper shows a process how a simulation model for
complex ERP systems might be developed. The paper focuses on the
development of an adequate structure to represent complex ERP system
architectures. For the development of this structure it utilizes the idea of the
Enterprise Service Oriented Architecture (SOA) paradigm and an extended 3
tier architecture reference model. The basic approach focuses on a so called
multi-layer service map, which contains all services inside an ERP system and
interdependencies between these services. This multi-layer service map can be
used as data basis to create a simulation model of the analysed ERP system later
on.
1 Introduction
Enterprise Service Oriented Architecture (SOA) describes the concept of
understanding application architectures as a set of services supporting business
processes [1]. Within an Enterprise SOA, functionality is offered and consumed using
a standardized service-interface. Today’s state-of-the-art Enterprise Resource
Planning systems (ERP systems) offer an Enterprise SOA. The ERP system offers
(via proprietary or standardized interfaces) services that support the vital business
processes of a company and its partners – today often known as their ecosystem or the
value web. Following the current understanding, Enterprise SOA consequently
disembogues in a set of internal and external services. Each service can be consumed
either from an internal ERP system or from an external ERP system. This leads to a
more and more complex architecture of modern ERP systems.
ERP systems consist in most cases of numerous, heterogeneous systems being
connected in a complex IT landscape [2]. Nowadays, globalization and other
Bögelsack A., Jehle H., Wittges H., Schmidl J. and Krcmar H. (2008).
An Approach to Simulate Enterprise Resource Planning Systems.
In Proceedings of the 6th International Workshop on Modelling, Simulation, Verification and Validation of Enterprise Information Systems, pages
160-169
DOI: 10.5220/0001732601600169
Copyright
c
SciTePress

challenges force the companies to react and change faster. Thus, the benefit of
running an ERP system for a company rises with the systems’ ability to adapt to the
changing demands of the company. Therefore, the IT landscape needs to be very
flexible in order to react very quickly to changing challenges without causing any
unwanted side-effects to the unchanged services.
Those parts of the IT landscape which are considered to be highly critical are
provided with highly redundant equipment. Also, there are copies of the operational
systems to test the effects as well as the side effects of the applied changes. Because
of resource shortage, this kind of extra funding is not used on systems that are
considered less critical (e.g. most of the operational systems of medium-sized-
businesses). Especially in these cases, there is a need for appropriate testing methods
to analyze the (side-) effects of demanded changes and to anticipate the impact on the
IT landscape caused by the change.
The ambition of this workshop paper is to describe an approach on how a simulation
model for complex ERP systems might be developed. Therefore the paper focuses on
the development of an adequate structure to represent Enterprise SOA-based ERP
system architectures. We will focus on the introduction of this adequate structure and
the development of this structure. Later the structure and contained information can
be used to build up the simulation model. Development of the simulation model itself
is not subject to this paper.
2 Approach
Our approach to simulate Enterprise SOA-based ERP systems is shown in figure 1. It
starts with the 3 tier architecture reference model, the Enterprise SOA paradigm and
the ERP system. These are our prerequisites for building up an internal architecture of
the ERP system. The development of the architecture will be the first step in our
work. The result of this step will be a so called multi-layer service map - a type of
blueprint of the ERP system. After this multi-layer service map is developed, we will
gradually measure the degree of internal dependencies between each service.
Therefore a theoretical performance measurement framework needs to be applied.
The reason for choosing a performance measurement framework is described later in
this chapter. The framework combined with the multi-layer service map leads to the
performance measurement which produces a comprehensive data set. Based on this
data set we can complete the “laboratory” analysis for determining an overall
statement of the system’s behaviour and statements about the internal dependencies.
These statements will be used to populate the multi-layer service map and to build a
simulation model later on. In the end we want to simulate the Enterprise SOA-based
ERP system. The results of simulation can be used to adopt the multi-layer service
map and to implicate changes to our simulation.
161
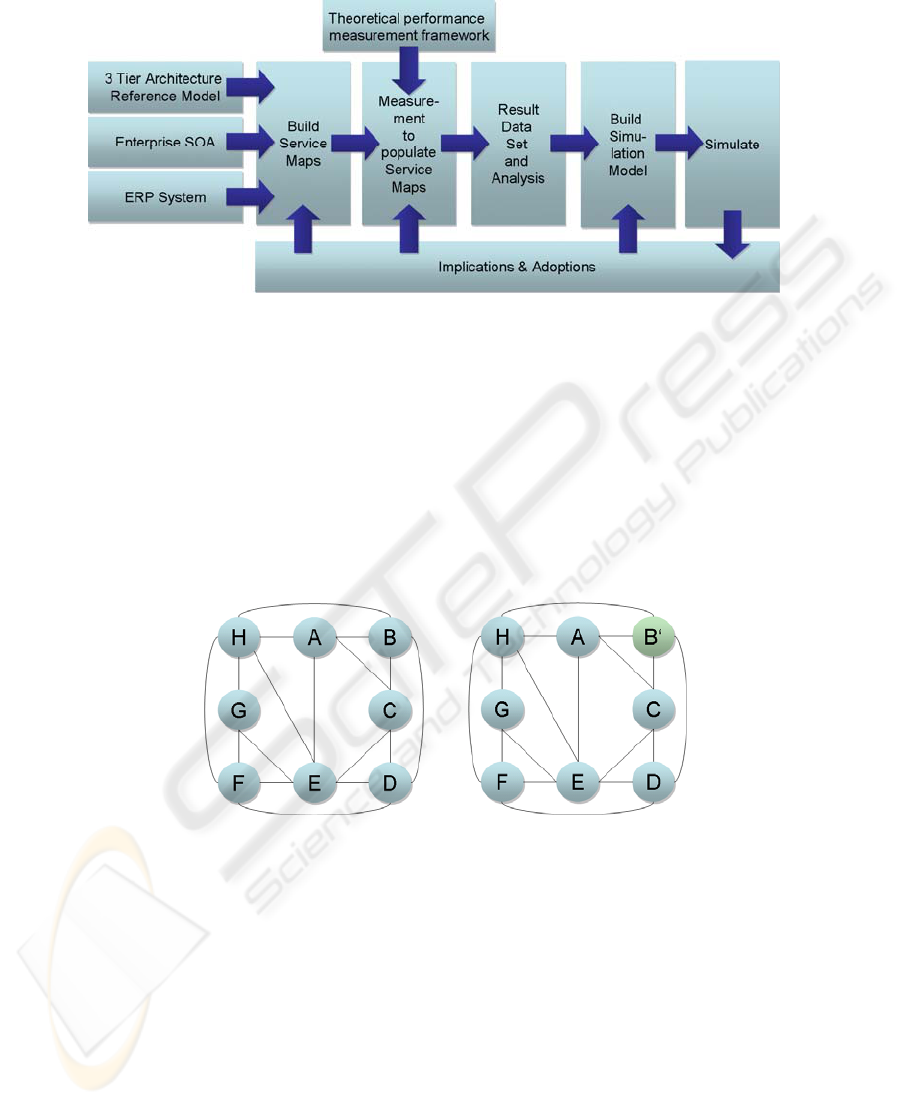
Fig. 1. Approach process overview.
Note, that this is an exemplary process on how a simulation model might be
developed. In the paper we neglect the measurement, analysis and building the
simulation model. So the first step in our approach is building a blueprint of the ERP
system. We esteem the internal structure of a complex ERP system as a set of
services, linked together with internal dependencies between each service. This
understanding derives from the Enterprise SOA paradigm.
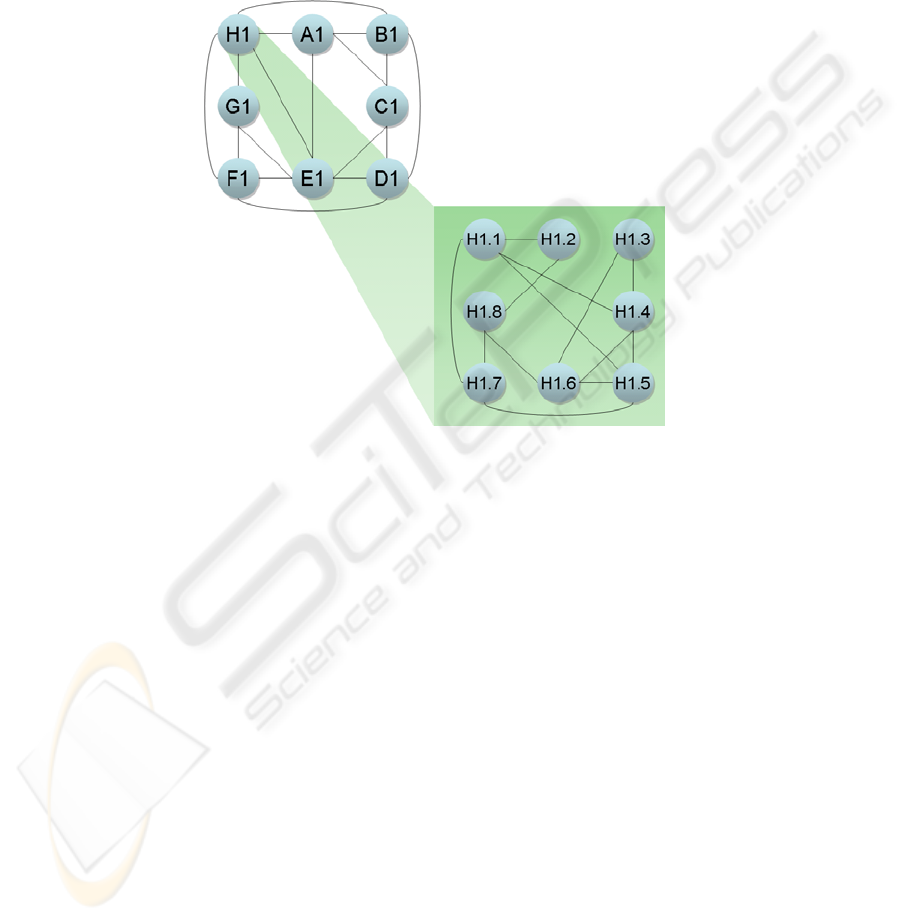
At first we need to analyze the entire ERP system, making a kind of map of all
internal and external services and of all the dependencies between these services. The
following figure shows an example structure of a small ERP system.
Fig. 2. Changing a service in a small service map.
In this example, we consider eight different services. This setting shows, that
changing the service B to B’ affects nearly all other services and without providing
any appropriate testing methods there is no way to forecast and determine the
influences on the system’s behaviour.
As a first step we have to create a service map, which has to contain all internal and
external services of an ERP system. When creating the service map we suggest
following the top-down strategy strictly, starting from the top-level of the ERP system
architecture. Seen abstractly also components like application server and database can
be interpreted as a service. By decomposing each service one can find even more fine
grained services [3]. This has two advantages: we can specify how deep we want to
162
dive into the system, which means how many services we want to identify. The other
advantage is that it is more comprehensible to identify services when starting from
top-level, because it is easier to identify a service and then to break it down into sub-
services than starting from the lowest-level services and try to build up the all-
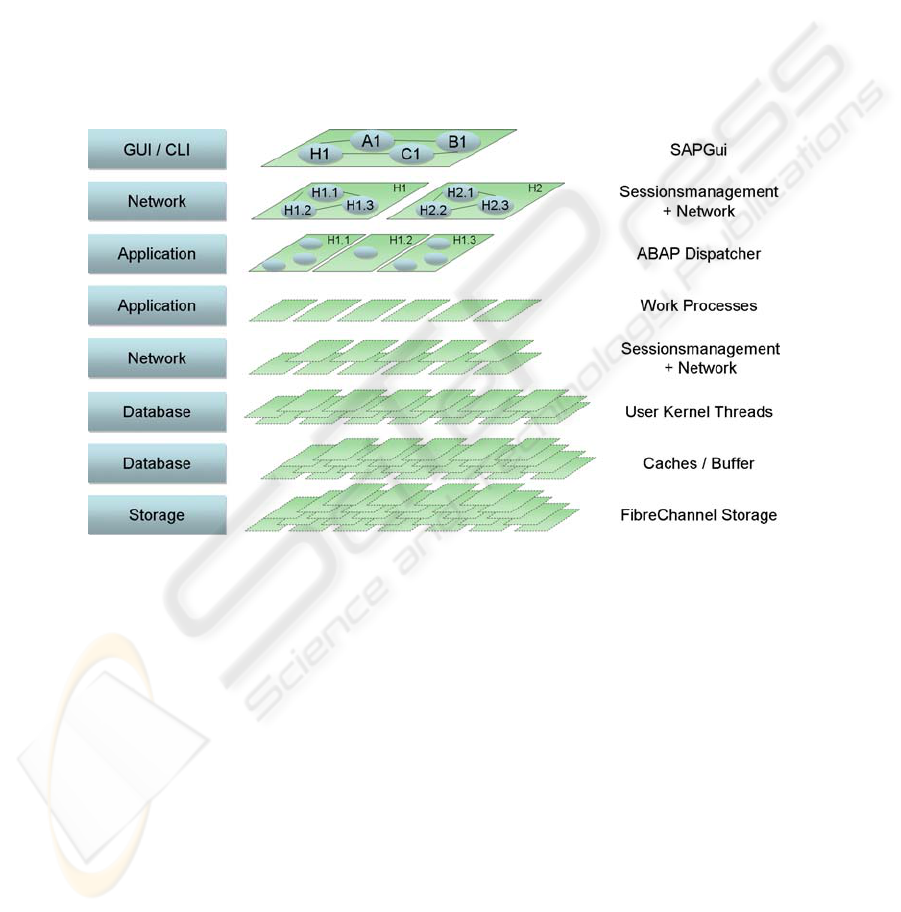
embracing service. The following figure illustrates this issue. It is easier to find out
which sub-services the overlying service H1 has than to try to find out which sub-
services form one overlying service.
Fig. 3. Decomposition of service H1.
Now the question is how deep we should dive into the system. Diving into the system
is necessary as we have to identify all services inside the ERP system. A danger exists
in getting lost inside the huge ERP system architecture. It is for this reason we need a
model for orientation to build up our service maps.
A proper approach is to take a standard reference model to limit the effort of service
identification. The danger in getting lost in the systems architecture is limited by
using a model to identify the numbers of layers.
Our choice is the well known 3 tier architecture model, containing three different
layers for a typical application interaction: a layer for input and output, an application
layer and a database layer. To partition the whole ERP system, we apply this
reference model to the ERP system. Of course, it is clear that also other reference
models can be used. Applying a multi layered reference model to the ERP
architecture means that our envisioned service map will be a multi-layer service map.
The 3 tier architecture model gives us the possibility to enhance the model with some
network layers, which we think are also very important. We extend the model with
two additional network layers. Moreover we distinguish the application and database
layer in more detailed layers.
Identification starts on the first layer, the input output layer. We identify all services
on the first layer which are responsible for sending user inputs to the underlying
163
layers or receiving data from the underlying layers. So, a simple graphical user
interface will become a service on this layer. After we identified all services on the
first layer, we proceed to identify all underlying services from the next layer. This
procedure will be repeated until the last layer is reached. Analogously, each layer is
represented by at least one service map. Obviously more than one service map can
form one layer. The number of services that forms a service map derive from the
granularity e.g. a database can be considered as one service but also as a couple of
services. The number of service maps forming a layer, depends on the number of
service maps in the predecessor layer. All service maps then form the multi-layer
service map for the entire ERP system which can be described as the blueprint of the
ERP system.
We divide the ERP system into several layers according to the 3 tier architecture
model, each containing several service maps.
Fig. 4. The eight layers and service maps.
Figure 4 shows the eight layers. The first layer is the layer responsible for input an
output of data. We use these layers to dive into our ERP system. At first we identify
services closest to the actual business processes: A1, B1, C1 and H1. These services
form the ‘root’ map on the input/output layer. Now we dive deeper into the system
and identify all services from the network layer. We start identifying H1.1, H1.2 and
H1.3 as the services which H1 consists of. These services form the service map H1. In
the same manner we have to identify the underlying services for A1, B1 and C1 as
well. All of the service maps are linked to exactly one service from the predecessor
service map. A typical relationship between a service map and its successors is 1:n.
There is no need to distinguish between internal and external services so far. The only
difference is that external services appear as ‘atomic’ services without linked service
maps.
To illustrate our approach we take an example from the world of ERP system – a SAP
system. For input and output of such a system, SAP provides its customers with a
164

graphical user interface, the so called SAPGui. This forms our first service on the root
service map. We then continue to identify service which lay also on the root map.
After this identification is completed we dive deeper into our system which actually
means we start identifying the service from the first network layer. The next layer is
the first application layer. It contains the so called ABAP dispatcher, which is
responsible for distributing the work over all available work processes in the SAP
system. These mentioned work processes form our second application layer. As a
matter of course, these two application layers must contain all parts of the application
server of the SAP system. After these two application layers, we face a network layer
again. Afterwards we have two different database layers. The first one contains
something like user kernel tasks and the second on contains buffers / caches. In the
last layer we consider the database storage.
Why the use of such a comprehensive architecture model is advantageous can be
shown by a simple example. Operating numerous ERP systems in an operating centre
is difficult and sometimes tricky. Especially when end-users face performance
problems there are several different starting points to search for a bottleneck as there
are several different layers in an ERP system. Because of this complexity, identifying
the bottleneck can be very time-consuming. The problem stems not only from the
complexity of the ERP system, it also stems from the huge number of different,
interconnected, internal layers (and therefore services) in the ERP system. So, if
facing a performance problem it is possible that the bottleneck is not inside the ERP
system but in the database storage or in the network interface controller. Using the
architecture model allows us to identify all related services. Of course knowing each
service does not mean to simulate each service.
After we built up the main service maps we will reveal the interdependencies by
building up a more complex ERP system service map containing not only the services
but also the interdependencies between them. Revealing and describing the internal
dependencies is inevitable for simulating the complete system. Reviewing the first
figure 2 we see that service B is linked to nearly all remaining services included in the
example. We want to know what type of interdependencies exist between the services
and in which way the impact will cause side-effects when changing the service to B’.
To specify the impact and side-effects, we need to identify metric and indicators,
describing the current system status. These indicators have to be measured and
compared after the change. The properties of the indicators and the metric depend on
the type of dependencies. In complex ERP systems there are several different types of
dependencies possible. In this paper we will focus on the impact of the dependencies
to the performance of the overall system. The task to determine the overall system
performance is commonly known as collecting benchmarks [4]. Comparing
benchmarks of the systems before and after changing single services will enable us to
investigate the internal dependencies of the system [5].
Hence, it is necessary to determine all appropriate performance factors of the ERP
system. We will approach this task with a theoretical performance measurement
framework. This framework will contain important performance factors which derive
from the type of ERP system and its architecture as well as from the insights provided
by the service map. The performance factors derive from the type of ERP system, the
underlying hardware, underlying operating system and network type [6]. The
framework will provide for a guideline for testing and monitoring [7]. Moreover, it
165
will contain a metric, expressing the degree of dependency as well as the overall
performance of the ERP system which we can use to express the overall changes.
Following the process shown in figure 1, we are going to apply this framework to our
service map. By adding additional testing tools, we have a means to determine the
degree of dependencies: measurement. We will gradually measure the degree of
dependencies between each connected service. Each degree will be added as a
numeric value to a service map.
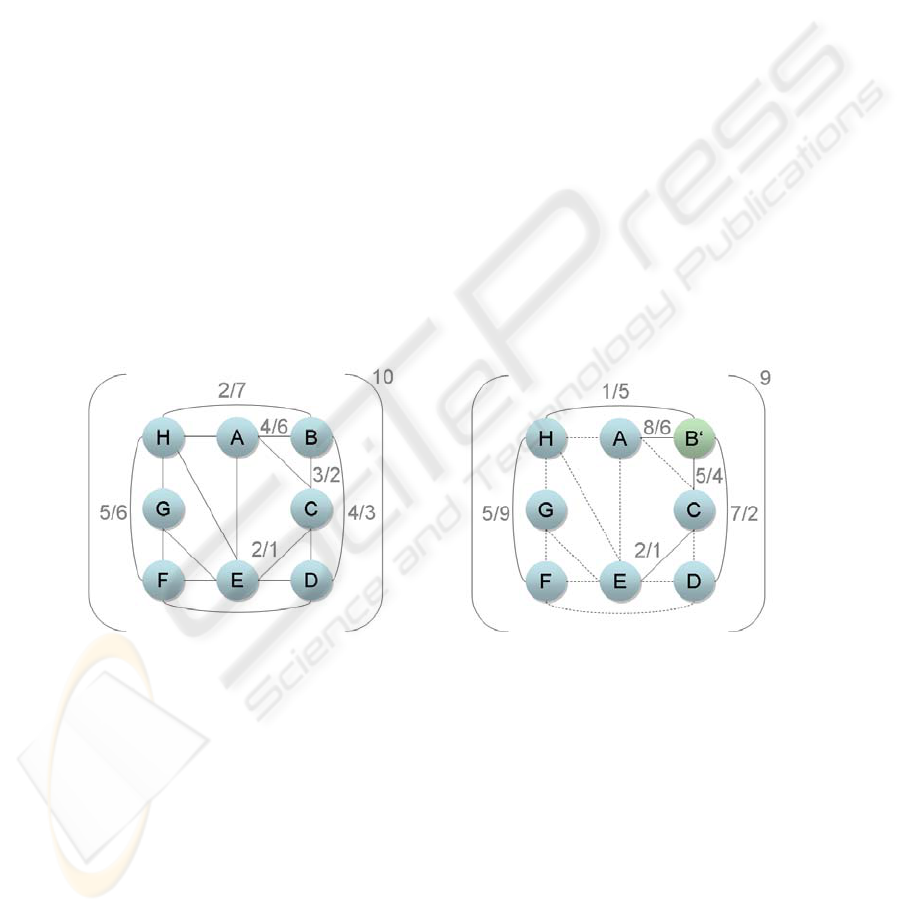
Inspired by the example shown in figure 5 this will lead us to statements such as: if
we decrease the performance of service A, the performance of service B will be
negatively influenced by factor four. When the performance of service B is decreased,
the performance of service A is decreased by factor six. Note that there is a transitive
dependency between service B and service F (B-H-F). If service B is changed not
only the performance of service H is influenced but also of service F. The overall
performance will be indicated by a complex metric arranged in form of a numeric
value: in figure 5 indicated by parenthesis and the number 10.
So our approach is to gain enough information to develop a multi-layer service map
with interdependencies and an overall performance metric which allows us to make
statements about the system’s behaviour after replacing/changing one service in the
system. Figure 5 shows what happens when service B is replaced by B’. A lot of
dependencies change and the overall performance of the system is decreased from an
index of 10 to an index of 9. Moreover we can make statements about
interdependencies between different layers and sub-services.
Fig. 5. Theoretical service map with interdependencies.
For gaining such information we need a testing environment. As it is not feasible to
test every service/dependency manually, a more convenient way (which is also the
only practical approach to high-load scenarios) is to use automated tests. We will
follow the idea of one factor experiments [5]. This implies that we change one service
and measure the overall performance difference as well as the interdependencies in
the service maps. Of course, this is the simplest design for an experiment but suitable
for our approach. The result will be a comprehensive data set, which is subject of the
next step: analysis.
166

The analysis of the data set is our next step in building up the architecture of the ERP
system. Analysing in this context means revealing the interdependencies between the
services and specifying the degree of interdependencies. After gaining this
information we can populate our service maps using the gained degrees. Only if all
service maps are completed with interdependencies and we know the overall
performance of each single service map, it is possible for us to build up a simulation
model from the multi-layer service map.
Now, as we have an idea of the interdependencies and the overall performance, we
can proceed to the next step and begin to build up a complex simulation model
containing and respecting all discovered dependencies. This means to migrate all
necessary information from the multi-layer service map to a simulation model which
is suitable for simulation software. Yet, we do not know which type of simulation
model can be used (e.g. queueing theory, Petri nets [8]). Of course, the simulation
model must be suitable for the used simulation software. This means also to evaluate
which might be appropriate simulation software for us.
Once the simulation model is completed we can start to simulate the system’s
behaviour after replacing/changing a system’s service. On the one hand the results
from simulation can be used to adopt or change the simulation model. Thus we can
change and elaborate the simulation model as well as the multi-layer service map. On
the other hand we can use the information to change the architecture of the ERP
system.
It will not be necessary anymore to test a complex system each time something has
been changed, which is very time-consuming and allocates a lot of resources. Instead,
you can just simulate the system’s behaviour, which is a lot safer, cheaper and less
time-consuming.
3 Discussion
Especially in the field of ERP systems it happens very often that updates/upgrades
and patches influence the system heavily. With simulation there is a chance to
evaluate the changes before running an update/upgrade/patch on a productive system.
Typical problems can be evaluated early and solved before applying
updates/upgrades/patches to the system. Simulation renders such processes more
transparent and safe. There is no need to test the entire system intensively after
applying an update/upgrade/patch. Instead you simulate the system and get the results
before changing the productive system. Moreover simulation makes it possible to
reduce the number of system for testing, development and quality assurance. Instead
of operate a big software landscape with an entire software development landscape
simulation can replace such landscapes.
One issue of this workshop paper is the development procedure. It takes the 3 tier
reference model to divide the ERP system into layers and identify all services. As this
reference model is less detailed it does not cover topics like: CPU, RAM, mass
storage. These topics and their related services must be included into the simulation
model too, even though the 3 tier architecture model gives a first idea of low level
services.
167

Yet, we cannot create a cost estimate for our approach. As we do not focus on one
simulation software and we do not know which simulation model can be used, it is
not possible for us to estimate the costs. There are several software products for
different simulation models available (see [9], [10])
We proceed from the assumption that it is possible to measure the dependencies once
before a service in the ERP system is changed and after it was changed. So if it is not
possible to determine the dependencies after it was changed, there is no chance to
gather the necessary information for the service maps. This leads to a failure in the
simulation model later on and therefore to a wrong forecast.
Creating such a complex model to simulate an ERP system requires a lot of effort.
Even if the model exists and it could be used adequately, it still would not be able to
solve every problem as it will not provide for all contingencies.
Our main approach builds upon the assumption that it is possible to identify and
measure the interdependencies between services of a complex ERP system. It can
become very difficult to identify the services especially when not having the required
understanding of the ERP system. Moreover we assume that it is always possible to
quantify the interdependencies. In case it is not quantifiable this model cannot be
used.
One advantage of the approach is the flexibility of our service maps. They can be
extended to contain other information about the ERP system. Once the multi-layer
service map is built up we can use it for other types of interdependencies. This means
instead of performance values we can populate the model with e.g. reliability values.
As the service map stays the same we have to come up with a suitable metric for
reliability only. This saves a lot of effort.
Another advantage is the knowledge of the internal structure of an ERP system. We
can identify services with a poor performance or weak services that show a poor
reliability.
4 Conclusions
This workshop paper shows a process how a simulation model for complex ERP
systems might be developed. Therefore the paper focuses on the development of an
adequate structure to represent complex ERP system architectures. It builds upon the
Enterprise SOA paradigm and uses the 3 tier architecture reference model to develop
a multi-layer service map. The ERP system is divided into eight layers each
containing service maps. Inside a service map the dependencies of the services are
described. The entire collection of service maps from the ERP system forms a
structure which can be used to build a simulation model later.
Our next steps will include the design of the performance framework as well as
developing the service maps. After all service maps and the performance framework
are developed we can go on and measure the interdependencies. This will give us the
chance to populate the service maps.
As we do not make any suggestions which type of simulation model will be used we
have to evaluate which simulation type is suitable for us. After we adopted a
simulation type to our multi-layer service map we can go on and simulate an
Enterprise SOA-based ERP system which is actual the goal of the whole process.
168

References
1. Krafzig, Banke, Slama: Enterprise SOA Service Oriented Architecture: Best practices
Prentice Hall International (2005)
2. Skene, J.; Emmerich, W.: Model Driven Performance Analysis of Enterprise Information
Systems. In, (2003), Page 11.
3. Kubota, F.; Sato, S.; Nakano, M.: Enterprise modeling and simulation platform integrating
manufacturing system design and supply chain. In: Systems, Man, and Cybernetics, 1999.
IEEE SMC '99 Conference Proceedings. 1999 IEEE International Conference, Vol. Vol. 4
(1999), Page 5
4. Spillner, A.; Linz, T.: Basiswissen Softwaretest. (2005).
5. Lilja, D.J.: Measuring Computer Performance - A practitioner's guide, Cambridge
University Press 2000.
6. Gray, K.: The Benchmark Handbook
7. Welbon, E.; Chan-Nui, C.; Shippy, D.; Hicks, D.: The POWER2 Performance monitor. In:
IBM RISC System/6000 Technology, (1993).
8. Peterson, J. L. (1977) “Petri Nets” Computing Surveys Vol. 9 p.p. 223-252.
9. http://www.arenasimulation.com/, accessed 3/3/2008
10. http://www.hyperformix.com/index.asp, accessed 3/3/2008
169
