
An Intelligent Clinical Decision Support System for
Analyzing Neuromusculoskeletal Disorders
Nigar Şen Köktaş
1
, Neşe Yalabik
1
and Güneş Yavuzer
2
1
Department of Computer Engineering, METU, Ankara, 06531, Turkey
2
Department of Physical Medicine and Rehabilitation
Ankara University Medical School, Ankara, Turkey
Abstract. This study presents a clinical decision support system for detecting
and further analyzing neuromusculoskeletal disorders using both clinical and
gait data. The system is composed of a database storing disease characteristics,
symptoms and gait data of the subjects, a combined pattern classifier that
processes the data and user friendly interfaces. Data is mainly obtained through
Computerized Gait Analysis, which can be defined as numerical representation
of the mechanical measurements of human walking patterns. The decision sup-
port system uses mainly a combined classifier to incorporate the different types
of data for better accuracy. A decision tree is developed with Multilayer Per-
ceptrons at the leaves. The system is planned to be used for various neuromus-
culoskeletal disorders such as Cerebral Palsy (CP), stroke, and Osteoarthritis
(OA). First experiments are performed with OA. Subjects are classified into
four OA-severity categories, formed in accordance with the Kellgren-Lawrence
scale: “Normal”, “Mild”, “Moderate”, and “Severe”. A classification accuracy
of 80% is achieved on the test set. To complete the system, a patient follow-up
mechanism is also designed.
1 Introduction
Gait analysis is the process of collecting and analyzing quantitative information about
walking patterns of people. Gait analysis finds applications in medicine and enables
the clinicians to differentiate gait deviations objectively. It serves not only as a meas-
ure of treatment outcome, but also as a useful tool in planning ongoing care of vari-
ous neuromusculoskeletal disorders such as cerebral palsy, stroke, OA, as an assistive
tool to other approaches such as X-rays, magnetic resonance imaging (MRI), chemi-
cal tests etc. Gait process is realized in a ‘gait laboratory’ by the use of computer-
interfaced video cameras to measure the patient’s walking motion, by the use of
surface electrodes placed on the muscles to follow muscle activity, and by the use of
force platforms embedded in a walkway to monitor the forces and torques produced
between the subject and the ground. Resultant data (such as knee angle/time) is tabu-
lated in graphic/numerical forms by commercial software. Kinetic and kinematical
temporal changes during walking are also obtained. In addition to temporal changes
of joint angles and force data, time-distance parameters of the gait such as velocity,
cadence, stride length, step length are recorded. It is not possible to predict the resul-
¸Sen Kökta¸s N., Yalabik N. and Yavuzer G. (2008).
An Intelligent Clinical Decision Support System for Analyzing Neuromusculoskeletal Disorders.
In Proceedings of the 8th International Workshop on Pattern Recognition in Information Systems, pages 29-37
Copyright
c
SciTePress

tant biomechanical musculoskeletal characteristics using other approaches such as
radiographic evaluations, which makes gait analysis a preferable tool.
Non automated decision making from gait data requires high level of expertise of
neuromusculoskeletal system trained for the purpose. An automated system is ex-
pected to decrease this requirement by a ‘transformed knowledge’ of these experts.
Automated gait analysis in medicine may also be used as a consultative and educa-
tional tool.
A clinical decision support system (CDSS) may be used for many medical applica-
tions [13-17] but CDSS’s for deseases that use gait data are new. There are studies in
which pattern recognition algorithms are used to distinguish ‘healthy’ from ‘patho-
logical’ gait. Most popular of these algorithms are neural networks (NNs) [1-4]
and support vector machines (SVMs) [4]. Most of these studies are implemented by a
limited number of subjects (less than 20) and by using manually selected gait fea-
tures. Since gait data is high dimensional and complex, to design a complete decision
support system may require a combination of all available features. In fact, physicians
make decisions about the illnesses by interpreting all available data in traditional
systems.
Most of the previous gait analysis systems ignore history and symptoms of the pa-
tient, such as age, pain grade, family history. Recently, the focus has been on combin-
ing several classifiers and getting a consensus of results for better accuracy for similar
cases [5, 6]. Today, combining methods are preferred for many well known pattern
recognition problems such as character recognition and speech recognition.
Automatic feature selection from many numerical gait parameters is another sub-
ject that’s not studied well. Actually, there are many medical practices testing the
variations which are caused by the related illness in the gait attributes [7-9]. Selection
of attributes is usually done by using the result of these studies by expert clinicians.
However, the judgments may vary in different experts leading to the different inter-
pretations. Obviously, automated selection lessens the dependence and the load on the
experts
The main objective of this study is to design an intelligent CDSS, namely
OAGAIT, to grade and further follow the progress of OA as a neuromusculoskeletal
disorder. Moreover, the design of a complete gait database that is adaptable to any
data collection software in the gait laboratory is in the scope of this study. Symptoms
and history of the patients and automatically selected numeric gait data are combined
using a multi-classifier approach.
The remainder of the report is organized as follows. Section 2 introduces the data
collection process and the characteristics of data. This is followed by details of fea-
ture selection process and classifier combination. Then the next section gives infor-
mation about the experiments and their results. Conclusions are presented in the last
section.
2 Data Collection
In this study, the gait data are collected by the gait experts in Ankara University Fa-
culty of Medicine, Department of Physical Medicine and Rehabilitation Gait Labora-
30
tory. The symptoms and history of the patients are also collected in the lab before the
patients are walked. Collected information other than gait is converted to numerical
values before they are used as features. Then, the first subset of the data can be de-
fined as:
A = {age, BMI, pain, stiffness, history, period}
Subjects undergo gait analysis with the same protocol by one and the same physi-
cian. Skeletal movement can be described using surface markers placed in precise
anatomical positions. All subjects are instructed to walk at a self selected speed along
the walkway and to practice until they can consistently and naturally make contact
with both of the force plates. Time-distance parameters of the gait are gathered at the
end. So the second set of the data is composed of time distance parameters (Set B):
B = {Cadence, Walking Speed, Stride Time, Step Time, Single Support, Double
Support, Stride Length, Step Length}
External retro-reflective markers are placed on each of the following anatomical
locations: anterior superior iliac spine (ASIS), sacrum, lateral thigh, joint line of the
knee, lateral shank, calcaneus, lateral malleolus and second metatarsal head. Ground
reaction forces (GRF) are collected using 2 force plates. Moments and powers are
calculated by using GRF data. Then the final subset of the data includes 33 gait
attributes which are defined as the temporal changes of the joint angles (Set C).
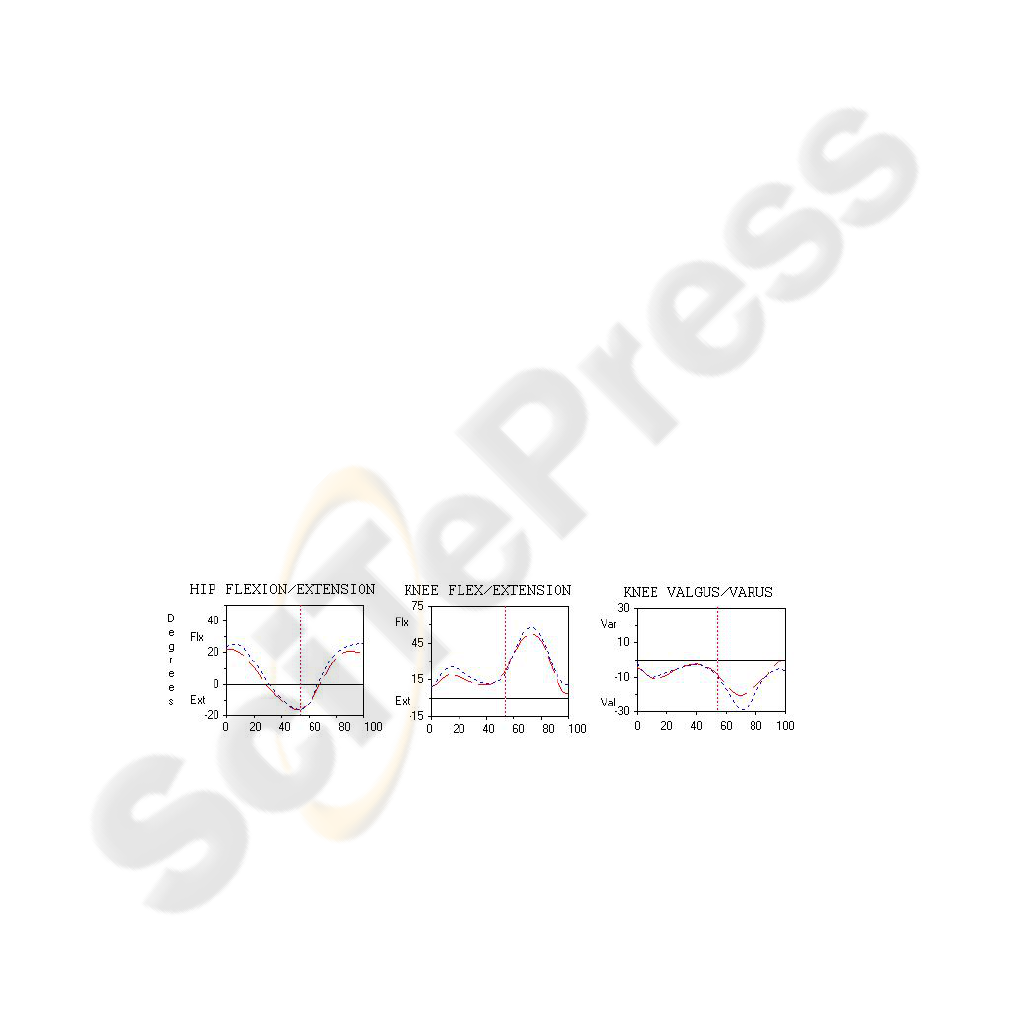
C = {PelvicTilt, Pelvic Obliquity Knee Flexion, Knee Varus, … }
Each of these attributes in C above is represented by a graph that contains 51 sam-
ples taken in equally spaced intervals for one gait cycle. So the attributes for a given
subject can be arranged as a 33x51 dimensional array X as below:
⎥
⎥
⎥
⎦
⎤
⎢
⎢
⎢
⎣
⎡
=
51,332,331,33
51,12,11,1
....
:::
....
xxx
xxx
X
Where
ji
x
,
is the value of the i
th
gait attribute at j
th
time period of the gait cycle.
Fig. 1. Examples to temporal gait attributes (data set C): The data is reported in 2-D charts with
the abscissa defined as the percentage of the gait cycle time and the ordinate displaying the gait
parameter.
Figure 1 shows examples of the graphical representation of the temporal changes of
the joint angles with 51 samples in each graph taken for one stride. A complete data-
31
base is designed and integrated to data collection software to keep them together and
to access easily when needed.
2.1 Feature Reduction and Selection
A basic feature reduction technique was applied before a selection process was used.
Initially, the dimensions of all attributes are reduced from 51 to 5, by taking means of
10 consecutive time samples. The feature space still has a too high dimension (5x33),
which forces the elimination of the redundant attributes. The Mahalanobis Distance
is used as a selection criterion, which may result with correlated attributes in general.
However, since our data is from different motion planes and different anatomic levels
of the body, correlation between the selected ones is not very probable. The number
of selected attributes is limited to the best ratio of the number of subjects and the
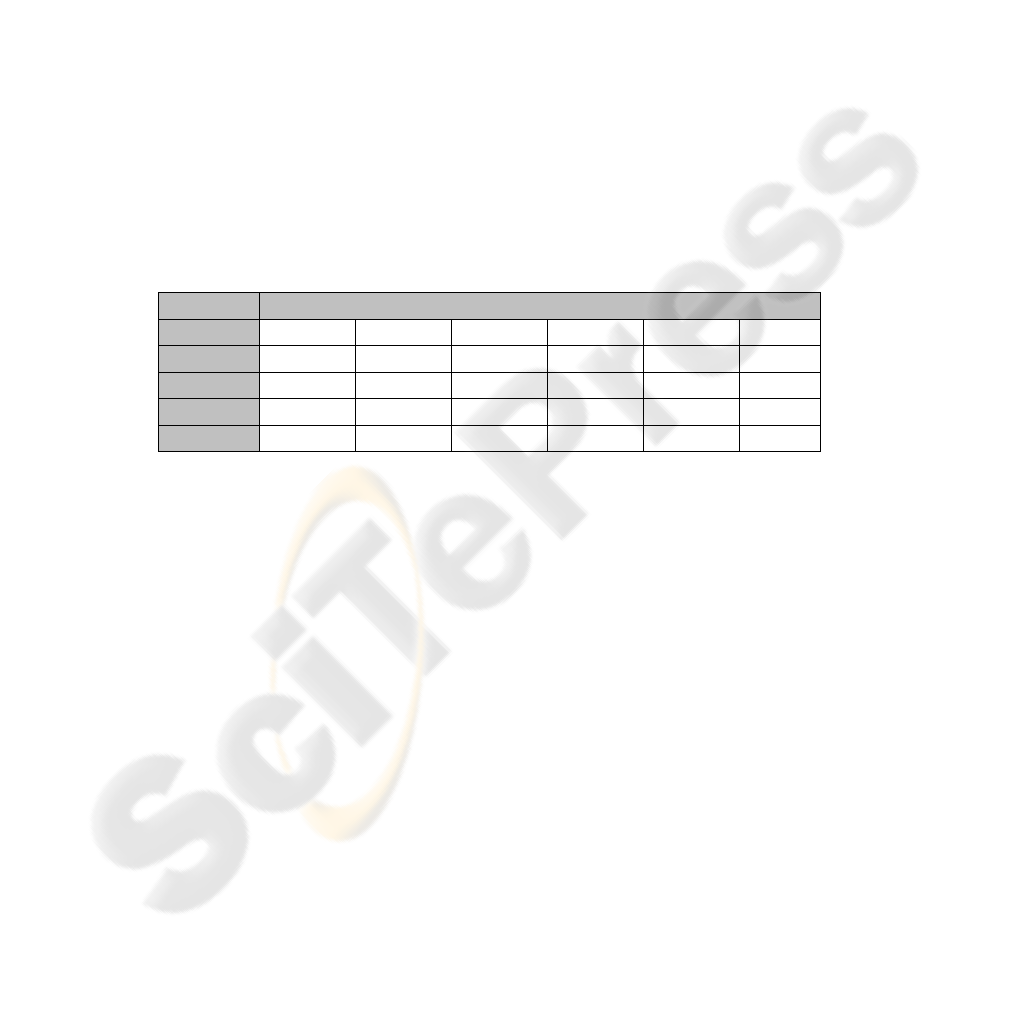
number of features, which is suggested as one over five in [10, 11]. Table 1 shows the
classes (i.e. grade of the OA) that datasets include and the selected gait attributes for
those datasets.
Table 1. Selected gait attributes for each two class case (P: Pelvic, F: Foot, H: Hip, K: Knee,
Flex: Flexion, M: Moment, Tot: Total, Dor: Dosrflexion, Rot: Rotation, Val: Valgus, Obliq:
Obliquity, Adb: Abduction). The classes are the severity levels of OA, as explained before.
Classes
Selected Gait Attributes
0-1
F.M.Dor H.Flex K.M.Flex K.Flex P.Tilt F.Rot
1-2
K.Flex K.M.Flex K.P.Flex H.P.Tot K.P.Tot K.Val
2-3
H.P.Abd H.Flex A.P.Dor H.Rot H.P.Flex K.Val
1-3
K.P.Flex K.P.Tot K.Flex P.Obliq K.M.Rot K.Val
0-2
F.M.Dor K.Flex H.Flex F.Dor K.Rot P.Tilt
In the next stage, these gait attributes are used for creating input vectors for the re-
lated expert MLP. Listing these attributes gives some valuable information about
progress of the OA.. For example, while knee related attributes seen more frequently
in dataset composed of classes 1 and 2, hip related ones seem more discriminative for
classes 2 and 3. This shows that as the grade of the illness increases hip angles are
affected more. This kind of information is valuable for clinical decision making and
training physicians.
3 Classification using Decision Tree MLP Multi-Classifier
It is difficult to combine different features as continuous variables, binary values, and
discrete labels into a single representation. Therefore, the combination of multiple
classifiers is a good solution for a problem involving a variety of features. In this
study a Mixture of Decision tree classifiers and Multilayer Perceptrons that are ex-
perts for different regions of the feature space are used for classifying four levels (0 to
3) of knee Osteoarthritis. The approach is similar to the Mixture of experts combined
32
classifier method [5]. The accuracy of the proposed system will be safeguarded by
using all feature sets A, B, C above with Kellgren score-labeled subjects.
The learning and classification processes consist of two stages. In the first stage a
decision tree is trained by using data set A and B as shown above. In the second
stage, the samples in every leaf are analyzed for feature selection and an expert MLP
is trained by composed datasets using attributes from set C to classify the data into
one of the two categories 0-1, 1-2 etc..
This approach uses three recognizers with 2 categories each instead of a recognizer
for four-categories, using expert neural networks for discriminating neighbor classes.
The basic classifiers used in the leaves of the decision tree are MLPs. Three- layered
(one hidden layer) MLPs are trained by different input vectors. These input vectors
are trained by automatically selected gait attributes, different for each leaf as men-
tioned above. So, they are assumed to be experts in the region of the binary decision
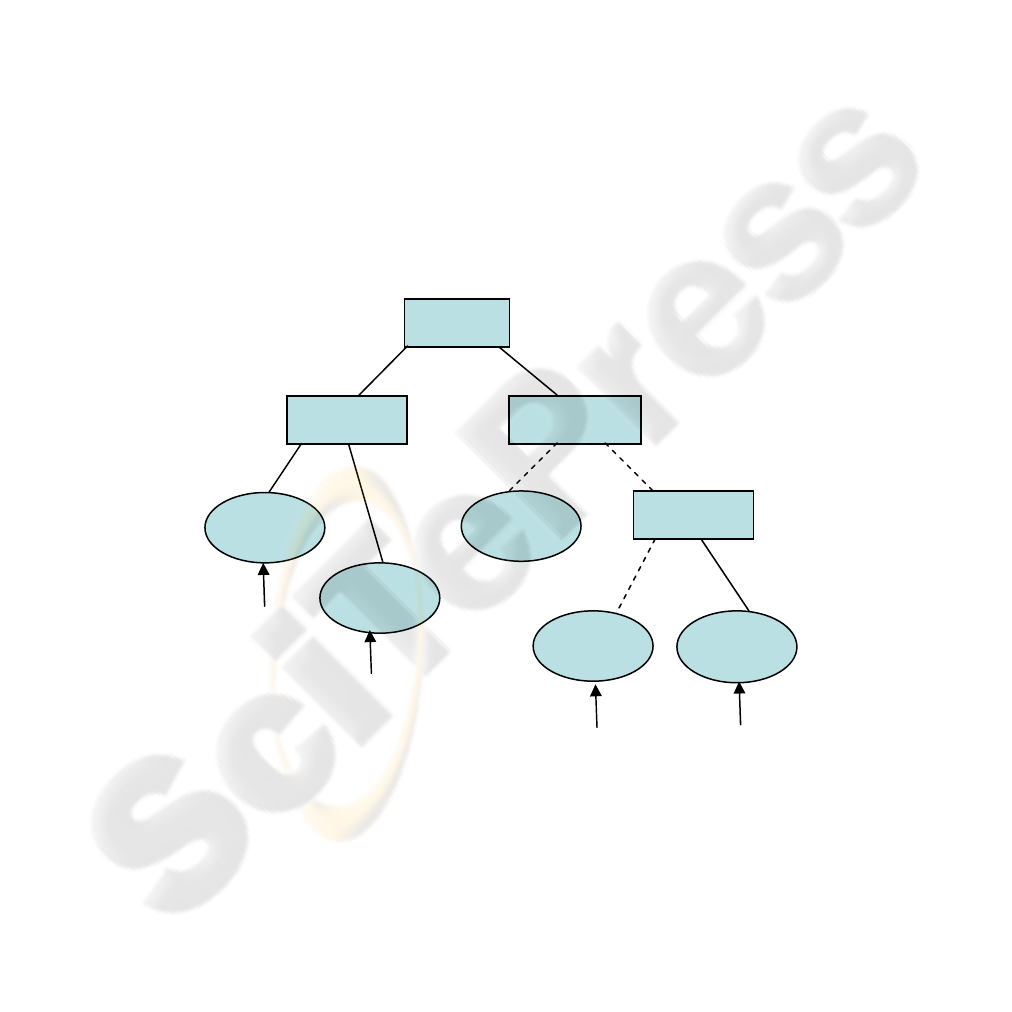
of the category. Figure 2 summarizes the proposed combination in a simplified form,
where
• Y = {y
1
, y
2
, ... y
n
} is the union of set A and B above
• T = {t
1
, t
2
, ... t
n
} is the set of corresponding threshold values for above, used
for composing tree.
• X= {x
1
, x
2
, … x
m
} is the set of datasets composed by selected attributes of
set C and presented to the expert networks as input
Fig. 2. Proposed example combination in a simplified symbolic representation.
y
1
<t
1
y
2
<t
2
y
3
<t
3
y
n
<t
n
MLP_1
MLP_2
MLP_m
.....
......
x
1
x
2
...
x
m
33
3.1 Implementation and Results
The training of our combined algorithm has two parts, decision tree training and
training of MLP’s. In decision tree trainers, topology is created first and then training
data is presented. Decision tree construction and training processes can not be consi-
dered separately. Tree is constructed according to the training data set by using some
predefined criteria. Splitting and stopping criteria are important for constructing the
best tree representing the training set and avoiding overfitting. Here, Gini index im-
purity is used for splitting.
Pruning step of the tree construction is done by considering the structure of the
combination. This means that a method to prune the tree so that each leaf has samples
from two classes was used.
In the next stage of the combination process, MLP’s responsible for discriminating
these two classes are replaced by the related leaf. These MLPs are responsible for
discrimination of classes 0-1, 1-2 and 2-3 respectively. They are trained by bpxnc
property of the PRTools [12]. This function creates a feedforward neural network and
uses Backpropagation algorithm for training. MLP’s have three-layer structures with
binary outputs. They are tested by crossvalidation approach and an average error rate
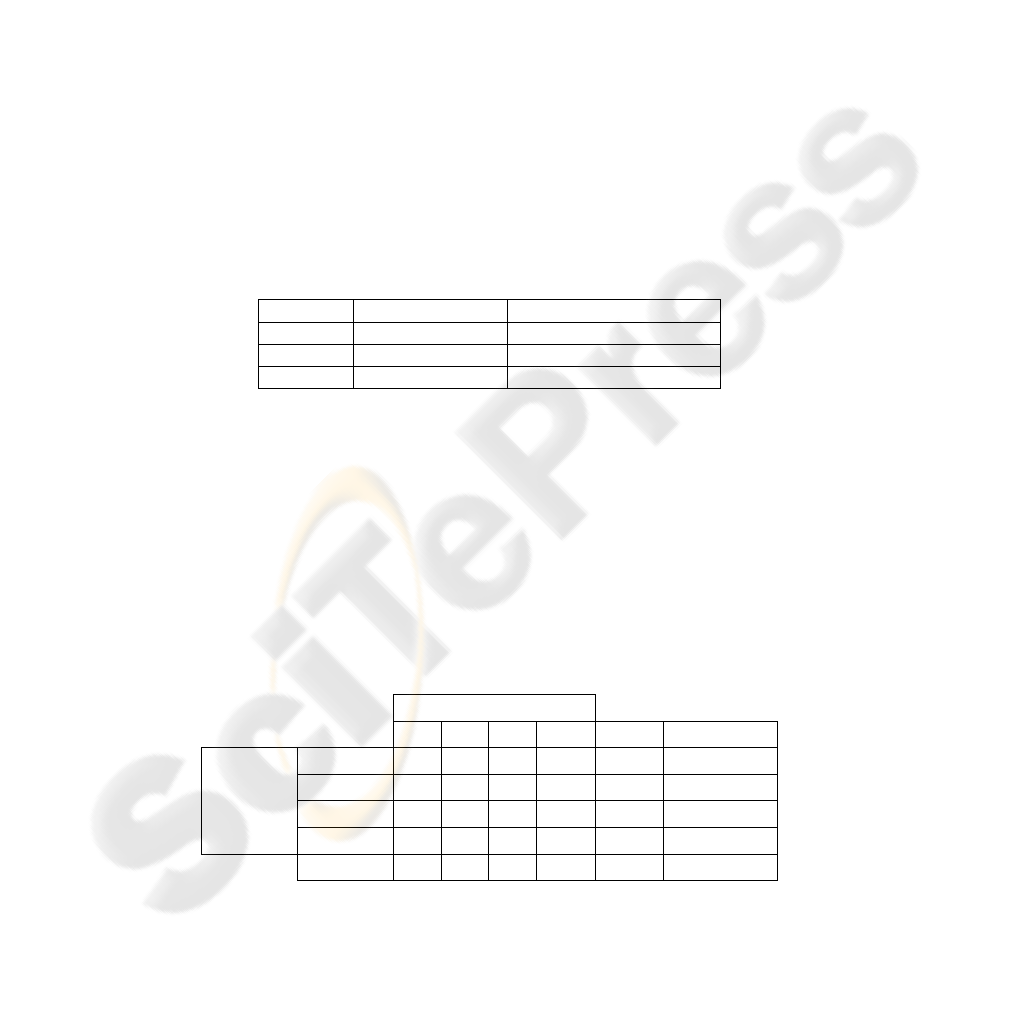
for each is gathered as shown in Table 2.
Table 2. Classification errors of MLPs.
MLP Classes (grades) Classification error (%)
MLP1 0-1 11
MLP2 1-2 16
MLP3 2-3 21
Then the algorithm is tested by an unseen dataset composed of 20 samples and a
correct classification ratio of %80 is achieved, as shown in confusion matrix in Table
3. The reason for most of these misclassified subjects is that they have been assigned
to wrong expert MLP in the decision tree. This wrong assignment is mostly because
of the pain level feature, which is a subjective feature determined by the subject him-
self. For example, a subject from grade 1 can determine his pain level as 10 (max
value for pain level) while the other from grade 3 can say 3. These kind of subjective
features are not preferred in classification processes but experts and medical studies
in literature show that pain level is one of the important indicators of the selected
illness, so it is used here anyway.
Table 3. Confusion matrix for combination (test data).
Estimated Classes
0 1 2 3 total error rate
Actual
Classes
0
18 2 0 0 20 0,1
1
1 15 2 2 20 0,25
2
0 1 17 2 20 0,15
3
0 2 4 14 20 0,3
total
19 20 23 18 80
0,2
34

Finally, for comparing the success of our combination schema with a single MLP
classifier, a four-class neural network is trained. A three layered MLP, call it MLP4, is
created. The same feature reduction and selection processes are applied to this new
dataset. The estimated labels are gathered as an output of crossvalidation algorithm.
The classification rate of the MLP4 which is about %58, proved us that using differ-
ent experts for different part of the feature space and then combining produced better
results.
4 Clinical Decision Support System
CDSS’s can be defined as interactive computer programs assisting physicians and
other health professionals with decision making tasks. The basic components of a
CDSS include a medical knowledge base and logical rules derived from experts.
There are many computer applications designed to be a CDSS. Programs that perform
database search or check drug interactions support decisions, but usually they are not
called CDSS. In [13] a CDSS is defined as a program that supports a reasoning task,
implemented behind the user interfaces and based on the clinical data.
Today, medical experts’ desire for computer usage in clinical applications, the
need for rapid access to recent information and the need for time saving increases the
number of commercialized CDSSs. Other potential benefits of using CDSSs in clini-
cal practice are grouped in three broad categories [16]: Improved patient safety, im-
proved quality of care, improved efficiency in health care delivery.
DXplain, QMR, ERA and ATHENA are good examples of successful systems
originating after 80s [13-15]. In [17] the authors systematically reviewed the literature
published up to 2003 to identify features of CDSSs critical for improving clinical
practice. Table 4 shows most significant 15 of these features of CDSSs as compared
to OAGAIT. It can be concluded that OGAIT classifies as a good CDSS.
Table 4. Features of OAGAIT compared to the ones suggested in [17].
Features of a good CDSS Features of OAGAIT
General system features
Integration with charting or order entry system to
support workflow integration
Integration of OAGAIT and VICON system
Use of a computer to generate the decision support Fully computerized decision support
Clinician-system interaction features
Automatic provision of decision support as part of
clinician workflow
When the subject’s gait data is entered to the
database the grading info is automatically
displayed on the screen.
No need for additional clinician data entry All needed data is entered to the database before
processing
Request documentation of the reason for not follow-
ing CDSS recommendations
There is a additional notes entry in all forms
Provision of decision support at time and location of
decision making
The grading results are shown on the screen just
after the walking of subject
Recommendations executed by noting agreement Not applicable
35

Table 4. Features of OAGAIT compared to the ones suggested in [17] (cont).
Communication content features
Provision of a recommendation, not just an assess-
ment
OAGAIT supply reasoning for the assessment
to help creation of treatment plans
Promotion of action rather than inaction OAGAIT produces most probable two classes
as a result rather than “not classified” message.
Justification of decision support via provision of
reasoning
OAGAIT shows assessment stages to support
reasoning
Justification of decision support via provision of
research evidence
The decision tree property of OAGAIT supplies
research evidences for provision of OA
Auxiliary features
Local user involvement in development process
An expert physician is included in the develop-
ment process as both an knowledge expert and
end user
Provision of decision support results to patients as
well as providers
Physician is responsible for delivering the
results to the patients
CDSS accompanied by periodic performance feed-
back
Not applicable
CDSS accompanied by conventional education
A short training is given to the physicians
and/or other laboratory staff
The system has easy-to-use user interfaces, so a short training is enough for the
physicians and/or other laboratory staff. It has a short processing time; the grading
results are shown on the screen just after walking of the subject, which provides an
immediate feedback.
5 Conclusions
OGAIT, a software for grading and further analysis of the knee OA was studied as a
part of a CDSS for neuromuscular disorders. Main aim of OAGAIT is to interpret gait
data almost as close as an expert’s. This interpretation is done by using expert know-
ledge on gait and features of pattern recognition. OAGAIT supports the function of
radiographic films for grading of OA and/or other diseases. It has a complete gait
database integrated with the data collection software. This database combined all new
and old gait data in an easy access and portable environment. Moreover, this database
is convenient to use for further studies about other diseases or integration to other
software systems.
This study presents a new approach for estimating Kellgren-Lawrence grades of
the subjects by using only gait data and patient history with an accuracy rate of 80%,
which is found to be very successful as a clinical test by the M.D.’s. Moreover, data
analysis process indicated relations of severity of the OA to the joints affected by gait
adaptations. We proved the hypothesis that the reduced motion of the knee joint is
compensated by an increased motion of the hip joint.for the patients with the ad-
vanced OA.
The classification success of the implemented combining classifier was compared
with the generalization accuracy with a single uncombined MLP. It can be concluded
that our algorithm performed significantly better and supplied some additional advan-
tages such as reasoning about the disease level is possible using this approach.
36

Acknowledgements
This study is supported by The Scientific and Technological Research Council of
Turkey (TUBITAK).
References
1. G. Barton, P. Lisboa, A. Lees, S. Attfield, “Gait quality assessment using self-organizing
artificial neural networks”, Gait and Posture, vol. 25, pp. 374-379, 2007
2. M. Kohle , D. Merkl , J. Kastner, “Clinical gait analysis by neural networks: issues and
experiences”, in Proceedings of the 10th IEEE Symposium on Computer-Based Medical
Systems 1997, pp.138
3. N. Sen Koktas, N. Yalabik, G. Yavuzer, “Ensemble Classifiers for Medical Diagnosis of
Knee Osteoarthritis Using Gait Data”, in Proceeding of IEEE International Conference on
Machine Learning and Applications, 2006, pp. 225-230
4. R. K. Begg, M. Palaniswami, B. Owen, “Support Vector Machines for Automated Gait
Classification”, IEEE Transactions On Biomedical Engineering, vol. 52, pp. 828-838, 2005
5. L. I. Kuncheva, Combining Pattern Classifiers: Methods and Algorithms. Wiley-
Interscience, 2004
6. J. Kittler, M. Hatef, R. P. W. Duin, J. Matas, “On Combining Classifiers”, IEEE Transac-
tions on Pattern Analysis and Machine Intelligence, vol. 20, pp. 226-239, 1998
7. H. Gök, S. Ergin, G. Yavuzer, ”Kinetic and kinematic characteristics of gait in patients
with medial knee arthritis” , Acta Orthop Scand, vol. 73, pp. 647–652, 2002
8. K. J. Deluzio, J. L. Astephen, “Biomechanical features of gait waveform data associated
with knee osteoarthritis: An application of principal component analysis”, Gait and Posture,
vol. 25, pp. 86-93, 2007
9. Kaufman, K., Hughes, C., Morrey, B., Morrey, M., An, K., “Gait characteristics of patients
with knee osteoarthritis”, Journal of Biomechanics,, vol. 34, pp. 907–915, 2001
10. Anil K. Jain , Robert P. W. Duin , Jianchang Mao, “Statistical Pattern Recognition: A
Review”, IEEE Transactions on Pattern Analysis and Machine Intelligence, vol. 22, pp. 4-
37, 2000
11. R.O. Duda, P.E. Hart, and D.G. Stork, Pattern Classification. John Wiley and Sons, New
York, 2001
12. R.P.W Duin, PRTOOLS (version 4). A Matlab toolbox for pattern recognition. Pattern
Recognition Group, Delft University of Technology, February 2004
13. Decision Support Systems, January 2008, http://www.openclinical.org/dss.html
14. R. A. Miller, F.E. Masarie, “Use of the Quick Medical Reference (QMR) program as a tool
for medical education”, Methods of Information in Medicine, vol. 28, pp.340-5, 1989
15. DXPlain, January 2008, http://lcs.mgh.harvard.edu/projects/dxplain.html
16. E. Coiera. The Guide to Health Informatics (2nd Edition). Arnold, London, October 2003.
17. K. Kawamoto, “Improving clinical practice using clinical decision support systems: a
systematic review of trials to identify features critical to success”, BMJ, vol. 330, pp. 330-
765, 2005
37
