
BALANCED GOALCARDS
Combining Goal Analysis and Balanced Scorecards
Alberto Siena
Center for Scientific and Technological Research FBK-Irst, via Sommarive 18, Trento, Italy
Alessio Bonetti, Paolo Giorgini
University of Trento, via Sommarive 14, Trento, Italy
Keywords:
Software Engineering, Requirements Engineering, Business Strategy, Goal Analysis.
Abstract:
Today’s Information Systems are complex systems that have to deal with a variety of different and potentially
conflicting needs. Capturing their strategic requirements is a critical activity, as it must answer at the same
time to software and corporate goals. In this paper, we introduce the economic foundations of strategic re-
quirements. We propose a novel conceptual framework for requirements modeling and validation, based on
economic and business strategy theory. The soundness of the framework is also evaluated, by presenting the
result of its application to a real case study.
1 INTRODUCTION
Understanding and analysing the purpose of a soft-
ware system before defining its desired functional-
ities, results crucial and more and more mandatory
in the development of modern information systems
(Fuxman et al., 2001). Early requirements analysis
(Giorgini et al., 2003; Alencar et al., 2000) is cur-
rently gaining popularity in the requirements engi-
neering community as an effective way to understand
the reasons of a new system with respect to the organ-
isational setting in which it will operate. In this con-
text, goal-oriented techniques have been proposed in
the last decade (Rolland, 2003; Giorgini et al., 2005;
Delor et al., 2003) to answer why questions, besides
what and how, regarding system functionality. An-
swers to why questions ultimately link system func-
tionality to stakeholder needs, preferences and objec-
tives.
Goal analysis techniques (Dardenne et al., 1993)
are useful to understand the structure and the corre-
lations among goals, their decomposition into more
fine-grained sub-goals, and their relation with opera-
tional plans. Moreover, reasoning techniques applied
to goal models (Giorgini et al., 2002) can be very use-
ful to verify properties of the model and possibly to
support the analyst in the conflict resolution process.
Although these techniques result very useful to rea-
son about single goal models, they are inadequate to
support strategic decisions of an organisation. This is
mainly due to the fact that they assume the perspec-
tive of the designer of the system and do not consider
other dimensions like the business or financial needs
that are crucial in decision process of an organisation.
In this paper, we revise the Tropos methodology
(Bresciani et al., 2004) extending its goal reasoning
framework (Giorgini et al., 2005) with a more enter-
prise and business oriented approach, the balanced
scorecards. The adoption of balanced scorecards al-
lows the analyst to have a more comprehensive vi-
sion of the enterprise and consequently to adopt so-
lutions that can be related to its strategic decisional
process. The purpose of this paper is twofold. On
the one hand, it introduces the conceptual framework
and the methodology for guiding the analyst in the re-
quirements analysis process, by assuming and comb-
ing multiple perspectives of analysis (i.e., financial
perspective, internal processes perspective, customer
perspective, learning and growth perspective). On the
other hand, it evaluates such a framework with respect
to its actual contribution to the software engineering
process, by means of a real world example.
The paper is structured as follows. Section 2
presents our experience with a requirements analysis
case and the problems it rises. Section 3 introduces
the underlying concepts of goal analysis techniques
107
Siena A., Bonetti A. and Giorgini P. (2008).
BALANCED GOALCARDS - Combining Goal Analysis and Balanced Scorecards.
In Proceedings of the Third International Conference on Evaluation of Novel Approaches to Software Engineering, pages 107-114
DOI: 10.5220/0001763801070114
Copyright
c
SciTePress

and the Balanced Scorecards business modelling ap-
proach. Section 4 presents the new Balanced Goal-
cards framework. Section 5 discusses the results that
emerge from the application of the framework to our
case. Section 6 concludes the paper.
2 AN IS FOR LOGISTICS
Frioli S.n.C. is a small Italian transport company lo-
cated in the Trentino region, interested in developing
a new information system to support its business. The
company was founded in the sixties as a family com-
pany, and today it has five associates and four full-
time employees. It owns five trucks and four trailers,
and it transports both construction material (mainly
cement) and undifferentiated goods. The transport ac-
tivity is 80% in northern Italy, 10% in the rest of Italy,
and 10% among Austria, Germany and France. Its
costs are mainly related to fuel, insurance and road
tolls. First need of the company is to optimise travels,
and a new information system seems to be a necessary
step in this direction. Our purpose is to gather the re-
quirements for such an information system, ensuring
them to be aligned with the actual business culture of
the company.
Requirements have been initially collected after a
number of meetings with people in the company. The
main objective of these meetings was to understand
the company’s strategy and related activities. Unfor-
tunately, after that it was not possible to have further
meetings with the company (mainly for reasonable
business constraints). This methodological constraint
is the major motivation for our work. In a perfect
world, with full information and unlimited resources,
we could elicitate the requirements perfectly with ef-
fectiveness and efficiency. But in the real world, the
challenge of software development is to overcome any
kind of limitations - time constraints, budget con-
straints, communication obstacles, domain-specific
skills, implicit information, and so on - to deliver the
right solution at the right time and for the right mar-
ket (Ebert, 2005).
Our experience with the company has confirmed
such a problem. A modelling session followed the
interviews, with the purpose to model and formally
analyse the models. Already during the modelling
phase, we have encountered suspicious inconsisten-
cies. For instance, managers declared interest in re-
ducing costs but they were not interested to reduce
phone customer support and off-line marketing tech-
niques in favour of on-line services. The reason of this
can be shortly explained as follows: the company has
currently a positioning in the market and in the local
community and doesn’t want to lose it. Its position-
ing is built on top of the company’s philosophy that is
implicit and depends on many factors, such as qual-
ity of directors and employees, local market charac-
teristics, history and structure of the company, results
obtained, etc. In this scenario, on-line marketing can
produce a very negative impact and change heavily
the customers’ perception of the company. So, even
if the company wants to reduce costs, choosing the
lower-cost solution is not the right solution.
These and other considerations showed clearly the
need to:
i) support the analyst in capturing during the inter-
views both technical requirements and business
strategy needs;
ii) provide a formalism to represent business entities
in the software development process.
3 BACKGROUND
3.1 Tropos and Goal Analysis
Tropos (Bresciani et al., 2004) is an agent-oriented
software development methodology, tailored to de-
scribe the system-to be in terms of its requirements.
It is intended to capture both functional and non-
functional requirements, and, as such, a special role
is given to the capability to model and understand
the stakeholders’ goals. The methodology analyses
the requirements of the system-to-be in terms of goal
models. Goals basically represent the functional re-
quirements, while the softgoals represent the non-
functional requirements of the system. Goal models
are represented by means of goal graphs composed
of goal nodes and goal relations. Goal relations can
be AND and OR decomposition relations; or, they can
be contribution relations, partial - the “+” and “−”
relations - and full - “++” and “−−” relations. In
practice, a goal graph can be seen as a set of and/or
trees whose nodes are connected by contribution rela-
tions arcs. Root goals are roots of and/or trees, whilst
leaf goals are either leaves or nodes which are not part
of the trees.
For each goal of a goal graph, we consider three
values representing the current evidence of satisfia-
bility and deniability of goal: F (full), P (partial), N
(none). We admit also conflicting situations in which
we have both evidence for satisfaction and denial of
a goal. So for instance, we may have that for goal G
we have fully (F) evidence for the satisfaction and at
the same time partial (P) evidence for denial. Such
an evidence is either known a priori or is the desired
ENASE 2008 - International Conference on Evaluation of Novel Approaches to Software Engineering
108

one. In both cases, the conflicts arise by reasoning on
the graphs with the techniques explained below.
On goal graphs, it is possible to analyse it with
both forward reasoning and backward reasoning.
Forward Reasoning. Given an initial values assign-
ment to some goals, input goals from now on (typ-
ically leaf goals), forward reasoning focuses on the
forward propagation of these initial values to all other
goals of the graph according to the rules described in
(Giorgini et al., 2005). Initial values represent the ev-
idence available about the satisfaction and the denial
of a specific goal, namely evidence about the state of
the goal. After the forward propagation of the initial
values, the user can look the final values of the goals
of interest, target goals from now on (typically root
goals), and reveal possible conflicts. In other words,
the user observes the effects of the initial values over
the goals of interests.
Backward Reasoning. Backward reasoning focuses
on the backward search of the possible input values
leading to some desired final value, under desired
constraints. We set the desired final values of the tar-
get goals, and we want to find possible initial assign-
ments to the input goals which would cause the de-
sired final values of the target goals by forward prop-
agation. We may also add some desired constraints,
and decide to avoid strong/medium/weak conflicts.
The present work is based on the consideration
that this kind of systematic analysis of the stake-
holders’ goals is necessarily general-purpose and per-
formed from the perspective of the requirements engi-
neer. As such, it provides little help in understanding
the business specific requirements of the organisation.
To overcome these difficulties, we refer to the “Bal-
anced Scorecard” approach.
3.2 Balanced Scorecards
The Balanced Scorecards (BSC) framework was
introduced by Kaplan and Norton in the early
nineties (Norton and Kaplan, 1992) as a new strat-
egy management approach, able to overcome the
limitations they found in the then existing manage-
ment methodologies. Essentially, pre-existing finan-
cial analysis techniques used to focus on monetary in-
dicators, without taking into account non-measurable
capitals of a company, such as knowledge or cus-
tomers loyalty. As opposite, the BSC approach re-
lies on three basic ideas (Kaplan and Norton, 2001):
i) both the material and immaterial objectives are
important for the company; ii) the objectives, mate-
rial and immaterial, can be numerically measured via
properly chosen metrics; iii) the strategy is the resul-
tant of the balancing of different kinds of metrics. In
a broad sense, the strategy consists in the set goals,
which will determine the success of the organisation
in the market (Porter, 1996). The strategy is the ac-
tual realisation of the mission, values and vision: the
Mission statement describes the reason of being of
the organisation and its overall purpose; the Busi-
ness Values represent the organisation’s culture, and
turn out in the priorities that drive the organisation’s
choices; the Vision describes the goals to be pursued
in the medium and long term, and how the organisa-
tion wants to be perceived from the market. In the
BSC approach, the strategy is bounded with a con-
ceptual tool, the Strategic Map (Kaplan and Norton,
1996). It is commonly represented as a diagram, con-
taining goals and their inter-connections. The connec-
tions are cause-effect relationships, meaning that the
achievement of a goal brings to the achievement of its
consequent. The strategic map is comprised by four
different perspectives, i.e., the the financial perspec-
tive, the internal processes perspective, the customer
perspective and the growth perspective.
The Economic-Financial Perspective. This per-
spective looks at the company from the point of view
of the profitability, as well as solvency, liquidity, sta-
bility and so on. It expresses how well are the com-
panys finances managed to achieve the mission. The
metrics associated with this perspective are monetary
and economic such as ROI, ROE, and more low-level
values.
The Customer Perspective. Customers are the key
stakeholders for the success of a company, so it is im-
portant to identify the target customer and define the
properties that meet his needs. The ultimate purpose
is to make products attractive for the customers.
The Internal Processes Perspective. The goals as-
sociated with this perspective are those that can have
an impact on the internal effectiveness and efficiency
of the company. Also, the goals that attain human and
organisational resources are relevant, and can be mea-
sured by metrics such as are time, turnaround time,
internal communications rating and so on. For in-
stance, the choice to use e-mails instead of the tele-
phone could improve the processes.
The Learning and Growth Perspective. The fourth
perspective describes the long-term success factors.
It is important to understand the characteristics that
should equip the human, informative and organisa-
tional resources. So for instance, the choice to train
the employees to use IT resources could allow the
company to stay on the market also in the evolving
global economy.
The representation capabilities of a strategic map
may appear indeed limited. For instance, cause-
effect relationships are too restrictive and do not al-
BALANCED GOALCARDS - Combining Goal Analysis and Balanced Scorecards
109

low the analyst to represent all the possible relation-
ships among goals. Also, it is not possible to express
negative effects; it is not possible to specify partial
contributions among goals; and it is not possible to
express conflicts. Finally, relationships among goals
are not enough fine-grained: when multiple cause-
effect implications exist, it is unclear what can happen
if some goals cannot be satisfied. However, besides
these limitations the conceptual expressiveness of the
BSC approach seems promising, since it can capture a
business-centred entity, such as the strategy, in quite a
formal way. Thus, we aim at extending the represen-
tation capabilities of Tropos goal diagrams with the
conceptual expressiveness of the BSC.
4 BALANCED GOALCARDS
With the term “Balanced Goalcards” we refer to a
novel approach for conceptual modelling that aims at
aligning the business-centred needs of an organisation
with IT-oriented requirements. The approach extends
the i*/Tropos methodology in both its modelling and
analysis capabilities, and turns out in the ability to
capture strategic requirements that are consistent with
economic principles. The methodological framework
of the approach is shown in Figure 1. Shortly, the
first step is the domain modelling and consists in the
definition of the basic organisational settings. The
actors are identified and their strategic dependencies
are modelled. This phase follows exactly the Tropos
methodology guidelines (see (Bresciani et al., 2004)
for more details). Then, in the strategy modelling,
the business context is modelled. Firstly, the mission
of the organisation should be made clear, and then
business values and vision. Using as leading parame-
ters these root entities, the four different perspectives
are modelled separately. The perspectives are then
joint in a goal diagram that represents the Strategic
Map. Finally, the map is validated along three dimen-
sions: conflicts detection and resolution, minimisa-
tion of costs, and evaluation of unpredictable events.
The result of the validation is the actual requirements
system.
4.1 Strategy Modelling
The idea is that the Tropos early requirements phase is
led by the emergence of the strategic map. The strate-
gic map is represented as a Tropos goal diagram, so
that BSC’s cause-effect relations are replaced by Tro-
pos relations. AND-decompositions are used, when
multiple cause-effect relations exist, and there is the
evidence that the decomposed goal can’t be reached
Actors
modelling
Strategic
dependencies
modelling
Mission
Financial
Perspective
Customer
Perspective
Internal
Processes
Perspective
Learning and
Growth
Perspective
Strategic Map
Vision
Conflicts
detection
Costs
minimization
Analysis of
the events
Strategic
Requirements
Organization
Domain modelling
Strategy modelling Validation
Requirements Analysis Process
Balanced Goalcards Modeling Framework
Vision and Business Values
Vision and Business Values
Figure 1: The Balanced Goalcards methodological frame-
work.
if at least one of the sub-goals is not achieved. OR-
decompositions are used, when multiple cause-effect
relations exist, but achieving one of the sub-goal is
enough to consider achieved the parent goal. If there
is no clear evidence of a decomposition, a contribu-
tion link is used. Carefully evaluating the contribu-
tion metrics (“+”, “−”, “++” and “−−”, see section 3
for the guidelines) allows the designer to describe in
a more precise and realistic way the mutual influence
among goals.
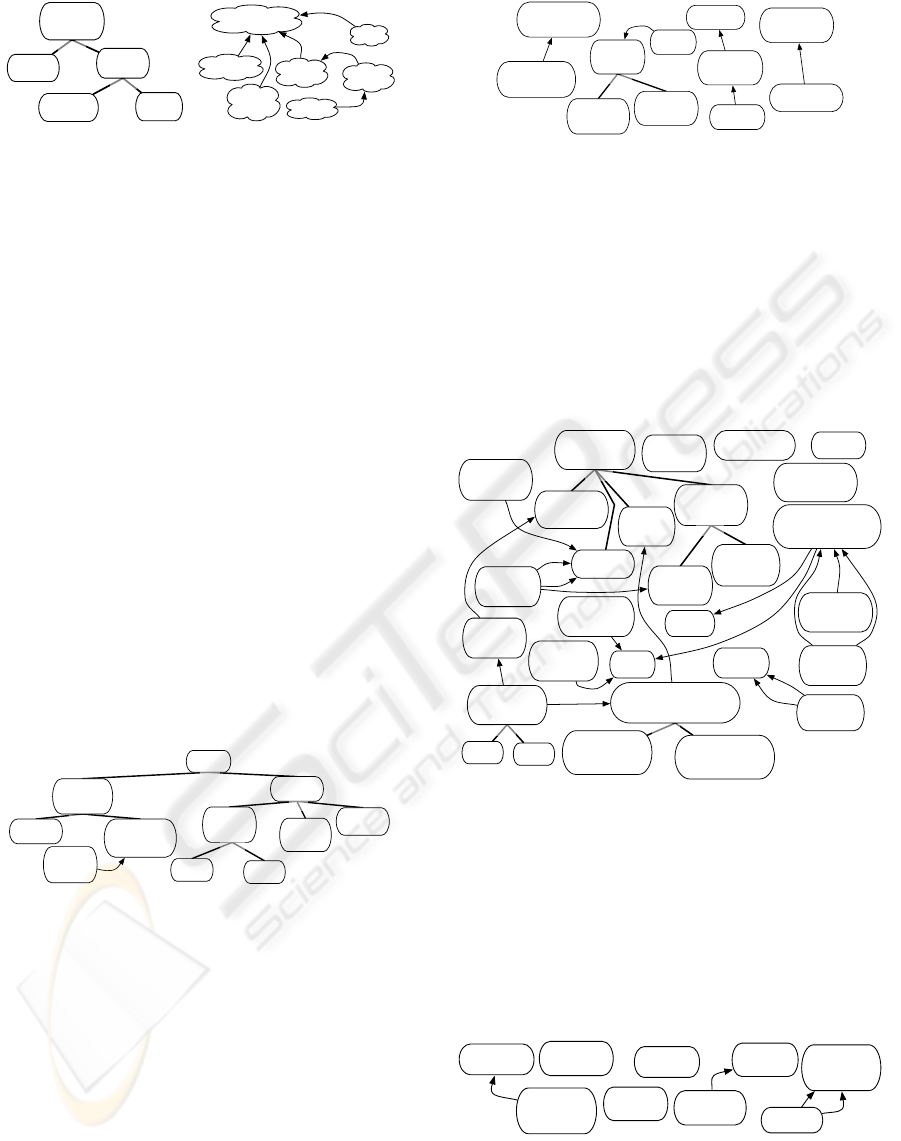
Mission. The concept of mission is mapped as the
root goal. Frioli is a transportation company, so we
have a root in the goal “Delivery service be fulfilled” as
in Figure 2(a). The root goal is further analysed by
a decomposition into more operational goals (“Orders
be received”, “Goods be delivered” and so on). There
could also be more that one root, if the company’s
business is wider.
Business Values. The business values are represented
as softgoals. They emerge from both, an explicit in-
dication of the organisation to be modelled, and the
perception of the analyst. For instance, “Customer
loyalty”, “Timeliness”, “Care corporate image”, and so
on (Figure 2(b)) are business values. They are linked
in weak cause-effect relations (represented as contri-
butions in the picture). The “Long-term value for the
associates” general-purpose goal is possibly reached
directly, via a “Growth” of the company; or indirectly,
via the “Customers loyalty” given by the “Quality of
service”. “Effectiveness” is related in particular with
the inner processes of the company, whereas “Care
corporate image” refers to how to company is per-
ceived by the customer.
Vision. The vision represents the link between what
the organisation is and what it wants to be. For the
Frioli company, no vision has been clearly identified.
This mainly because it is implicit in the managers’ ra-
tionales, and the challenge is to capture it and make it
explicit, so that we can elicit consistent requirements.
ENASE 2008 - International Conference on Evaluation of Novel Approaches to Software Engineering
110
Orders be
received
Vehicles be
available
Route be
planned
Goods be
delivered
AND
Delivery
service be
fulfilled
AND
(a)
Long-tern value
for the associates
Growth
Effectiveness
Quality of
service
Care
corporate
image
Customers
loyalty
Timeliness
+
+
+
+
+
+
(b)
Figure 2: (a) The mission of the company. (b) The business
values. Ovals represent goals, and clouds represent soft-
goals.
Strategy. We want to make the strategy to emerge
during the goal modelling, through the building and
evaluation of the strategic map. We want to capture
the business needs, and this means we need also to
model the business profile of the company. In order to
do this, we adopt here the classical BSC-based mod-
elling approach. In detail, we build our goal model
by taking into account the four perspective mentioned
above: the economic-financial perspective, the cus-
tomer perspective, the internal processes perspective
and the learning and growth perspective.
Economic-financial Perspective. From the economic
perspective, we observe an important effort of the
Frioli company to contain costs (see Figure 3). There
are two kinds of costs: management costs and sup-
ply costs. Supply costs are intrinsic to the transport
activity, such as fuel and tolls. On the other hand,
management costs are related to the administration of
the business; TLC are an important part, but also the
extra payments the arise from unforeseens.
+
Reduce
expenses
for tolls
Minimize
in-vain trips
Reduce
TLC costs
Reduce
costs
Sign
insurance
contracts
Reduce
management
costs
OR
Reduce
costs
OR
Reduce costs
for unforeseens
and casualties
Reduce
supply costs
OR
Reduce
expenses
for fuel
AND
Reduce
waste
Figure 3: The Economic-financial Perspective.
Customer Perspective. From this perspective, it is
important to understand in which way a company
can be attractive for the customer (Figure 4). The
overall image of the company (“Care corporate
image”) is important, as well as the details, such
as the look of the personnel and of the documents.
The communications with the customer (“Care the
communications with customers”) are important for
the customers to be loyal to the company. Also, an
important goal is to be able to offer an international
transportation service. Even if not frequent, the lack
of this service could affect the perception of the
customer in the company’s capabilities.
+
Care
the look of the
employee
Care
the look of the
documents
Behaviour
code
Be friendly in
communications
Consultancy
Be available
at communicating
with customers
Care
corporate
image
AND
International
freight
Capability
to satisfy short-term
commitments
Capability to
administrate
shipments
Care the
communication
with customers
++
++
++
++
Figure 4: The Customer Perspective.
Internal Processes Perspective. Economic-financial
goals and customer’s strategy have to be translated
into internal processes. Notice that we don’t want to
actually model the sequences of activities that form
the company’s business processes. What we want to
capture here is the why of the processes. The pro-
cesses shall allow the company to achieve its goals,
so we model only the low-level goals that the internal
activities are expected to fulfil (Figure 5).
++D
++S
+D
+
++S
+
+D
+S
++
++S
+
+S
++D
+S
++S
+
+S
Reduce
route errors
Reduce
communication
errors
Reduce
delivery
errors
Equip
vehicles
with GPS
Modify
corporate
structurre
Buy more safe
and efficient
vehicles
Optimize
routes
Detailed
daily info
on routes
Updated
news on
viability
E-mail
VoIP
Verify place and
modality of delivery
with sender
Verify place and
modality of delivery
with recipient
Verify
route and
delivery time
Verify
availability of
the vehicles
Increase quality
and frequency of
maintenance actions
Norm-compliant
vehicles
Integration
with the
customers IS
Select
high quality
components
Minimize
crashes
Minimize
injuries
Continuous
monitoring of
work tools
Buy
injury-protection
clothes
Vehicles
availability
Errands for
the requests
Improve
customer-carrier-recipient
communication
AND
Verify the
feasibility of
the order
AND
New
communication
media
OR
Reduce
malfunctionings
and errors
AND
Figure 5: The Internal Processes Perspective.
Learning and Growth Perspective. From this per-
spective, the company has a little margin of techni-
cal improvement. For instance, it could acquire new
tools (for self-made reparations) or train the person-
nel (Figure 6). Some other goals are related to the ac-
quisition of new customers. More ambitious growth
plans, such as investments in new market segments,
are not present in the company.
++
+
++S
+D
Safe-drive
courses
Acquire
new tools
Professional
staff
Acquire
proficiency
New
customers
acquisition
Gain
proficiency
Knowledge
of foreign
languages
Acquire new
knowledge
Marketing
Figure 6: The Learning and Growth Perspective.
BALANCED GOALCARDS - Combining Goal Analysis and Balanced Scorecards
111

4.2 Validation of the Strategic Map
The last step consists in putting together the perspec-
tives and balance them into a consistent strategy. One
of the strength points of the original BSC framework
is its simplicity; using a goal diagram based approach
causes the level of complexity to grow up (see Fig-
ure 7), and this raises the need for formal analysis able
verify and validate the models. The first problem (ver-
ification) can be solved with goal analysis techniques.
The second problem (validation) is more complex,
since it requires to align the models with economic
principles. For this purpose, we have defined an anal-
ysis methodology comprised by three steps: conflicts
resolution, costs minimisation and risk prevention.
Conflicts Resolution. A conflict is a situation where
the satisfaction of some subgoals prevents (fully or
partially) the top goals from being fulfilled. Such kind
of situation is extremely dangerous, since an unseen
conflict can undermine the enforcement of the strat-
egy. But it results difficult to be detected, specially
when the strategic map becomes complex. The proce-
dure that we use for conflicts detection and resolution
is the following: i) we execute backward reasoning
in order to find a possible vales assignment for leaf
nodes that satisfy all the top goals; ii) if the solution
introduces a conflict for some of the top goal we start
again backward reasoning for each of the conflicting
goal; iii) the whole goal model is then modified ac-
cordingly to the partial results obtained in the previ-
ous step.
So for example, in Figure 7, the goal “Verify the fea-
sibility of the order”, introduced in order to “Reduce
malfunctioning and errors”, caused a conflict with the
goal “Reduce management costs”. Since the com-
pany privileges the financial perspective over the in-
ternal processes one, the first goal has been discarded.
Costs Minimisation. Due to OR-decompositions
and multiple contribution relations, different strate-
gies can be adopted; i.e., it is possible to find differ-
ent values assignments to the leaf goals that satisfy
the top goals without any critical conflict. To select
one of them we recall the BSC fundamentals, argu-
ing that each alternative has a different cost for the
organisation. So we assign to each goal a numerical
value, which represent its cost. If possible, we evalu-
ate its monetary cost; so for instance the actual cost of
the “Consultancy” can be accurately estimated. Other-
wise, we search for a suitable metrics; for instance,
for transport companies “timeliness” can be evaluated
and translated into a numerical value. Costs are then
associated to goals as meta tags, so that each possible
strategy will have by this way a corresponding weigh
in term of its resulting cost. The selection of the best
strategy will be based on the comparison of that costs.
For instance, in Figure 7, the goal of obtaining “Cus-
tomers loyalty” can be achieved either adopting a mar-
keting strategy (e.g., promotional campaigns) or in-
troducing a dedicated software able to reduce delivery
errors. However, a new software can be very expen-
sive and adopting marketing-based strategy could be
more convenient.
Risk Prevention. Risk is something that heavily af-
fects a company’s life. Risky events are outside the
control of an organisation and can prevent its strategy
to be accomplished. We take into account this prob-
lem by introducing in the diagrams a new entity - the
“Event”. Events are linked via −−
S
contribution rela-
tions to one or more goals. So, if an event occurs (i.e.,
its SAT value equals to P or F), then the affected goal
is inhibited. We have no control over the occurrence
of the event; however, by assigning the SAT value to
the event, we can perform bottom-up analysis and see
what is the potential effect of the event.
For example, in Figure 7 the event “Crashes” can
potentially compromise the whole long-term strategy
having a negative impact on the reduction of costs.
5 EVALUATION
In order to verify our approach, we have implemented
a CASE tool, the B-GRTool (Balanced-GoalCards
Tool). The tool has been implemented as an extension
of the GR-Tool (Giorgini et al., 2005) and maintains
all its functionalities, including reasoning techniques
like forward and backward reasoning. Besides the
standard GR-Tool scenarios, the B-GRTool supports
views on single scenarios that are used to build the
balanced perspectives. We used the tool to model the
strategy for Frioli S.n.C. according to the approach
shown in previous section. An almost complete goal
model is illustrated in Figure 7. It contains the mis-
sion and values of the company, together with the four
perspectives; notice that during the validation phase,
we have completed and refined the model by estab-
lishing further relations (contributions and decompo-
sitions). Table 1 shows the metrics that result from the
goalcards; due to lack of space, only a subset of the
goals can be shown. The four scenarios correspond
to alternative strategies, each of which gives different
priorities to different goals.
Scenario 1. The first scenario shows the current strat-
egy of the company and reflects its business values.
In this case, some goals result more important than
others. For instance, it is extremely important the
“Customer loyalty” obtained offering a reliable service.
This requires a particular attention to “Care corpo-
ENASE 2008 - International Conference on Evaluation of Novel Approaches to Software Engineering
112
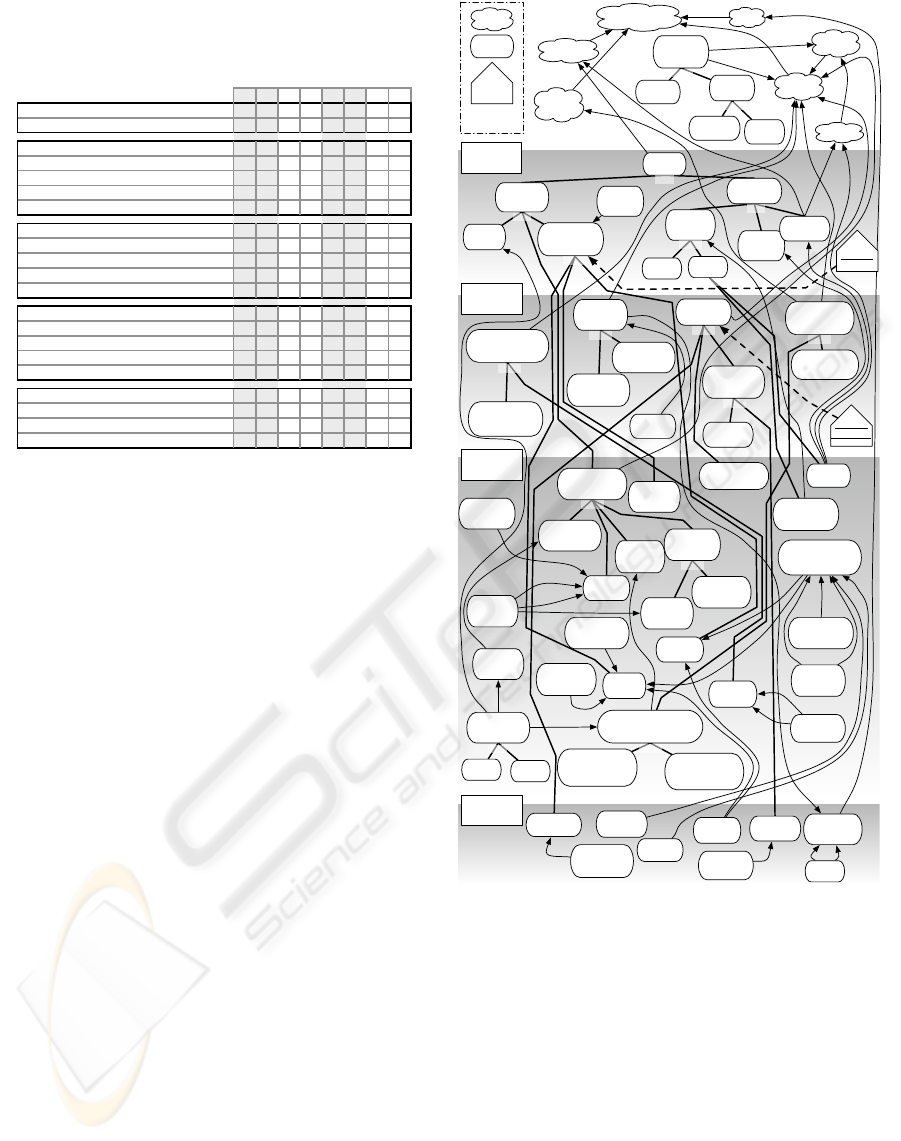
Table 1: Perspective-based comparison of four possible
scenarios. The “S” columns contain Satisfiability values,
whereas the “D” columns contain Deniability values.
Scenario:
1 2 3 4
S D S D S D S D
Values
Long-term value for the associates P P P P
Customer loyalty P P P P
Sign insurance contracts P F
Reduce management costs P P F P
Reduce supply costs P P F P
Minimize in-vain trips F
P F F F
Capability to satisfy short-term commitments P
Care the communication with customers F P P
Care corporate image F P P P
International freight P P F P
Behavior code F F
Equip vehicles with GPS F
Reduce malfunctioning and errors P F P
New communication media P F P F
Improve customer-carrier-receiver comm. F P P P
Increase frequency of maintenance actions P P P P
New customers acquisition F F P P
Acquire new tools P P P F
Marketing F P P
Acquire new knowledge P F P
P = “Partial” T = “Total”
Economic
perspective
Reduce costs for unforeseens and casualties
Customer's
perspective
Internal
processes
perspective
Learning and
growth
perspective
rate image” and to “Care the communication with cus-
tomers”.
Scenario 2. The second scenario proposes a strat-
egy for a growth-oriented company. The focus of
the analysis is on goals such as “Acquire new tools”
or “New customers acquisition”. What we obtain is a
strategy that privileges the growth, but goals such as
“Reduce management costs” and “Reduce costs for
unforeseens and casualties” are denied. If a company
wants to grow, it is extremely difficult to reduce at the
same time the costs.
Scenario 3. The third scenario describes a strategy
for a company that wants to reduce costs. In this
case, the focus is on the economic and the internal
processes perspective, and particularly on goals such
as “Reduce management costs” or “Reduce expenses
for fuel”. The resulting strategy allows the company
to satisfy all goals, but suggests to abandon the inter-
national freight, and some non essential goals such as
“Care the communication with customers” and “Care
corporate image” are denied.
Scenario 4. The last scenario proposes to reach the
top goals by investing in innovation. In this case the
learning and growth perspective has again a relevant
influence on the strategy, but caring at the same time
the internal processes one. The resulting strategy is
similar to the one of scenario 2, but it is now possible
to contain costs.
Some interesting results come from the case study.
Despite their claim of the “Growth” as a business
value, the actual strategy does not reflect such a will.
It is possible to see in Figure 7 that the learning and
Long-tern value
for the associates
Growth
Effectiveness
Quality of
service
Care
corporate
image
Customers
loyalty
Timeliness
+
+
++D
+D
+
+
+
+
+
++
+
++S
+D
++D
+D
+
+
+
Crashes
No route
via Austria
Financial
Perspective
Customer
Perspective
Internal
Processes
Perspective
Learning and
Growth
Perspective
+
+
+
+
+
+
+
+
--S
+
+
-S
+
Event
SoftGoal
++S
--S
+
+
+
+
++S
+D
+
++S
+
+D
+S
++
++S
+
+S
++D
+S
++S
+
+S
Orders be
received
Vehicles be
available
Route be
planned
Reduce
expenses
for tolls
Minimize
in-vain trips
Reduce
TLC costs
Reduce
costs
Sign
insurance
contracts
Care
the look of the
employee
Care
the look of the
documents
Behaviour
code
Be friendly in
communications
Consultancy
Be available
at communicating
with customers
Reduce
route errors
Reduce
communication
errors
Reduce
delivery
errors
Equip
vehicles
with GPS
Modify
corporate
structurre
Buy more safe
and efficient
vehicles
Optimize
routes
Detailed
daily info
on routes
Updated
news on
viability
E-mail
VoIP
Verify place and
modality of delivery
with sender
Verify place and
modality of delivery
with recipient
Verify
route and
delivery time
Verify
availability of
the vehicles
Increase quality
and frequency of
maintenance actions
Norm-compliant
vehicles
Integration
with the
customers IS
Select
high quality
components
Minimize
crashes
Minimize
injuries
Continuous
monitoring of
work tools
Buy
injury-protection
clothes
Vehicles
availability
Errands for
the requests
Safe-drive
courses
Acquire
new tools
Professional
staff
Acquire
proficiency
New
customers
acquisition
Gain
proficiency
Knowledge
of foreign
languages
Acquire new
knowledge
Marketing
Goal
Reduce
management
costs
OR
Reduce
costs
OR
Reduce costs
for unforeseens
and casualties
AND
Reduce
supply costs
OR
Reduce
expenses
for fuel
AND
Reduce
waste
AND
Care
corporate
image
AND
International
reight
AND
Capability
to satisfy short-term
commitments
AND
Capability to
administrate
shipments
AND
Care the
communication
with customers
AND
Improve
customer-carrier-recipient
communication
AND
Verify the
feasibility of
the order
AND
New
communication
media
OR
Reduce
malfunctionings
and errors
AND
Goods be
delivered
AND
Delivery
service be
fulfilled
AND
Legend
Figure 7: An (almost) complete goal model for the Frioli
S.n.C. case study.
growth perspective has a few number of goals. The
scenarios above also confirm this perception. So we
observe that, despite the fact that the company wants
to grow, its implicit values do actually privilege sta-
bility. This observation is reinforced by a look at the
customer perspective: it has an important impact on
the realisation of the business values. In particular,
we see that many goals exist in order to satisfy the
“Customer loyalty” soft-goal. Through the customer
loyalty, the general-purpose “Long-term value for the
associates” is intended to be reached. Thus, the com-
pany seems to have a well-established relation with
customers, and wants to keep it, without going fur-
BALANCED GOALCARDS - Combining Goal Analysis and Balanced Scorecards
113

ther into market risks. So the resulting requirements
system should privilege this status quo arrangement.
6 CONCLUSIONS
The importance of business criteria is explicitly
recognised in particular in the e-Commerce engineer-
ing, where value exchanges play a role in under-
standing and generating requirements for the sys-
tem (Gordijn and Akkermans, 2003). Also, in e-
Business, some approaches exist, which focus on
the need for the alignment of IT and business strat-
egy (Bleistein et al., 2004; Grembergen and Saull,
2001). In this paper we have presented a new method-
ological framework for modelling requirements and
validating them against a business strategy: goal
graphs are used to represent the strategic map, and
the economic metrics are associated to goals’ sat-
isfiability and deniability; this allows to reason on
the metrics and analyse the diagrams, building bal-
anced requirements systems. We have reported the
use of the framework in our experience with a trans-
port company, trying to evaluate the results by com-
paring different scenarios and estimating the effec-
tiveness gained in gathering requirements.
REFERENCES
Alencar, F., Castro, J., Cysneiros, L., and Mylopoulos, J.
(2000). From early requirements modeled by the i*
technique to later requirements modeled in precise
UML. In Anais do III Workshop em Engenharia de
Requisitos, pages pp. 92–109, Rio de Janeiro, Brazil.
Bleistein, S. J., Aurum, A., Cox, K., and Ray, P. K. (2004).
Strategy-oriented alignment in requirements engineer-
ing: Linking business strategy to requirements of
e-business systems using the soare approach. vol-
ume 36.
Bresciani, P., Giorgini, P., Giunchiglia, F., Mylopoulos, J.,
and Perini, A. (2004). Tropos: An agent-oriented
software development methodology. Journal of Au-
tonomous Agents and Multi-Agent Systems, 8(8):203
– 236.
Dardenne, A., van Lamsweerde, A., and Fickas, S. (1993).
Goal-directed requirements acquisition. Science of
Computer Programming, 20(1-2):3–50.
Delor, E., Darimont, R., and Rifaut, A. (2003). Software
quality starts with the modelling of goal-oriented re-
quirements. In 16th International Conference Soft-
ware & Systems Engineering and their Applications.
Ebert, C. (2005). Requirements before the requirements:
Understanding the upstream impact. In RE ’05: Pro-
ceedings of the 13th IEEE International Conference
on Requirements Engineering (RE’05), pages 117–
124, Washington, DC, USA. IEEE Computer Society.
Fuxman, A., Giorgini, P., Kolp, M., and Mylopoulos, J.
(2001). Information systems as social structures. In
Second International Conference on Formal Ontolo-
gies for Information Systems (FOIS-2001), Ogunquit,
USA.
Giorgini, P., Kolp, M., and Mylopoulos, J. (2003). Orga-
nizational patterns for early requirements analysis. In
the 15th Conference On Advanced Information Sys-
tems Engineering (CAiSE*03).
Giorgini, P., Mylopoulos, J., Nicchiarelli, E., and Sebas-
tiani, R. (2002). Reasoning with goal models. In the
21st International Conference on conceptual Model-
ing (ER2002), Tampere, Finland. Springer Verlag.
Giorgini, P., Mylopoulos, J., and Sebastiani, R. (2005).
Goal-oriented requirements analysis and reasoning in
the tropos methodology. Engineering Applications of
Artifcial Intelligence, 18/2.
Gordijn, J. and Akkermans, H. (2003). Value based require-
ments engineering: Exploring innovative e-commerce
idea. Requirements Engineering Journal, 8(2):114–
134.
Grembergen, W. and Saull, R. (2001). Aligning busi-
ness and information technology through the balanced
scorecard at a major canadian financial group: It’s sta-
tus measured with an it bsc maturity model. In HICSS
’01: Proceedings of the 34th Annual Hawaii Interna-
tional Conference on System Sciences ( HICSS-34)-
Volume 8, page 8061, Washington, DC, USA. IEEE
Computer Society.
Kaplan, R. and Norton, D. P. (1996). The Balanced
Scorecard: Translating Strategy into Action. Mas-
sachusetts: Harvard Business School Press.
Kaplan, R. S. and Norton, D. P. (2001). The strategy-
focused organization. how balanced scorecard compa-
nies thrive in the new business environment. Harvard
Business School Press.
Niehaves, B. and Stirna, J. (2006). Participative enterprise
modelling for balanced scorecard implementation. In
Ljunberg J, A. M. e., editor, the Fourteenth European
Conference on Information Systems, pages 286–298,
Goteborg.
Norton, D. and Kaplan, R. (1992). The balanced scorecard:
measures that drive performance. Harvard Business
Review, 70 (1).
Porter, M. E. (1996). What is strategy? Harvard Business
Review, 74(6):61–78.
Rolland, C. (2003). Reasoning with goals to engineer re-
quirements. In 5th International Conference on En-
terprise Information Systems, Angers, France, April
22-26.
ENASE 2008 - International Conference on Evaluation of Novel Approaches to Software Engineering
114
