
COMPARISION OF K-MEANS AND PAM ALGORITHMS
USING CANCER DATASETS
Parvesh Kumar and Siri Krishan Wasan
Department of Mathematics, Jamia Milia Islamia, New Delhi, India
Keywords: Data mining, Clustering, k-means, PAM.
Abstract: Data mining is a search for relationship and patterns that exist in large database. Clustering is an important
datamining technique . Because of the complexity and the high dimensionality of gene expression data,
classification of a disease samples remains a challenge. Hierarchical clustering and partitioning clustering is
used to identify patterns of gene expression useful for classification of samples. In this paper, we make a
comparative study of two partitioning methods namely k-means and PAM to classify the cancer dataset.
1 INTRODUCTION
According to Usama Fayyad et al. (Fayyad,1996),
“Data mining is a step in the KDD (Knowledge
Discovery in Databases) process that consists of
applying data analysis and discovery algorithms that
produce a particular enumeration of patterns (or
models) over the data”.
According to Guha et al. (Guha,1998), “
Clustering problem is about partitioning a given data
set into groups (clusters) such that the data points in
a cluster are more similar to each other than points
in different clusters “ . A mathematical definition of
clustering is the following : let X = { x
1
, x
2
, x
3
,
…… , x
m-1
, x
m
} ⊂ R
n
set of data items
representing a set of m points x
i
in R
n
where x
i
= {
x
i1
, x
i2
, x
i3
, …… , x
in
} . The goal is to partition X
into k-groups { C
i
: 1 ≤ i ≤ k } such that data
belong to the same group are more “alike" than data
in different groups. Each of the k-groups is called a
cluster. The result of the algorithm is an injective
mapping of data items x
i
to groups C
k
.
Partitional clustering algorithms divide the whole
data set into a set of disjoint clusters directly. These
algorithms attempt to determine an integer number
of clusters that optimise a certain objective function
through an iterative procedure.
To classify the various types of cancer into its
different subcategories, different data mining
techniques have been used over gene expression
data. Gene expression data, obtained using gene
expression monitoring by DNA microarrays,
provides an important source of information that can
help in understanding many biological processes. A
common aim, then, is to use the gene expression
profiles to identify groups of genes or samples in
which the members behave in similar ways. One
might want to partition the data set to find naturally
occurring groups of genes with similar expression
patterns. Golub et al (Golub,1999), Alizadeh et al
(Alizadeh,2000), Bittner et al (Bittner,2000) and
Nielsen et al (Nielsen,2002) have considered the
classification of cancer types using gene expression
datasets. There are many instances of reportedly
successful applications of both hierarchical
clustering and partitioning clustering in gene
expression analyses. Yeung et al (Yeung,2001)
compared k-means clustering, CAST (Cluster
Affinity Search Technique), single-, average- and
complete-link hierarchical clustering, and totally
random clustering for both simulated and real gene
expression data. And they favoured k-means and
CAST. Gibbons and Roth (Gibbons,2001) compared
k-means, SOM ( Self-Organizing Map ) , and
hierarchical clustering of real temporal and replicate
microarray gene expression data, and favoured k-
means and SOM.
In this paper, we make a comparative study of
two clustering algorithms namely k-means and PAM
to classify the cancer datasets and is based on
accuracy and ability to handle high dimensional
data.
255
Kumar P. and Krishan Wasan S. (2008).
COMPARISION OF K-MEANS AND PAM ALGORITHMS USING CANCER DATASETS.
In Proceedings of the Third International Conference on Software and Data Technologies - ISDM/ABF, pages 255-258
DOI: 10.5220/0001868602550258
Copyright
c
SciTePress

2 K-MEANS ALGORITHM
The k-means algorithm is a partitioning clustering
algorithm. The k -means algorithm is very simple
and most popular clustering algorithm. The k-means
algorithm is a squared error-based clustering
algorithm.
The k-means is given by MacQueen
(MacQueen,1967) and aim of this clustering
algorithm is to divide the dataset into disjoint
clusters by optimizing an objective function that is
given below
Optimize
∑∑
=∈
=
k
icix
mixdE
1
),(
(1)
Here m
i
is the center of cluster C
i
, while d(x,m
i
)
is the euclidean distance between a point x and
cluster center m
i
. In k-means algorithm, the
objective function E attempts to minimize the
distance of each point from the cluster center to
which the point belongs.
Consider the data set with ‘n’ objects ,i.e.,
S = {x
i
: 1 ≤ i ≤ n}.
1) Initialize k-partitions randomly or based on some
prior knowledge.
i.e. { C
1
, C
2
, C
3
, …….., C
k
}.
2) Calculate the cluster prototype matrix M (distance
matrix of distances between k-clusters and data
objects) .
M = { m
1
, m
2
, m
3
, …….. , m
k
} where m
i
is a
column matrix 1 × n .
3)Assign each object in the data set to the nearest
cluster - Cm i.e. x
j
∈C
m
if d(x
j
,C
m
) ≤ d(x
j
,C
i
) ∀
1 ≤ j ≤ k , j ≠m where j=1,2,3,…….n.
4) Calculate the average of cluster elements of each
cluster and change the k-cluster centers by their
averages.
5) Again calculate the cluster prototype matrix M.
6) Repeat steps 3, 4 and 5 until there is no change
for each cluster.
3 PAM ALGORITHM
The purpose for the partitioning of a data set into k
separate clusters is to find groups whose members
show a high degree of similarity among themselves
but dissimilarity with the members of other groups.
The objective of PAM(Partitioning Around
Medoids) (Kaufman,1990) is to determine a
representative object (medoid) for each cluster, that
is, to find the most centrally located objects within
the clusters. Initially a set of k-items is taken to be
the set of medoids. Then, at each step, all objects
from the input dataset that are not currently medoids
are examined one by one if they should be
medoids.That is the algorithm determines whether
there is an object that should replace one of the
existing medoids . Swapping of medoids with other
non-selected objects is based on the value of total
cost of impact T
ih
.The PAM represents a cluster by
a medoid so PAM is also known as k-medoids
algorithm.
The PAM algorithm consists of two parts. The first
build phase follows the following algorithm:
Phase-1:
Consider an object i as a candidate.Consider another
object j that has not been selected as a prior
candidate. Obtain its dissimilarity d
j
with the most
similar previously selected candidates. Obtain its
dissimilarity with the new candidate i. Call this d(j;
i): Take the difference of these two dissimilarities.
1) If the difference is positive, then object j
contributes to the possible selection of i.
Calculate C
ji
= max (d
j
- d(j; i); 0) where d
j
– Euclidian distance between j
th
object and
most similar previously selected candidate
and d(j; i) – Euclidian distance between j
th
and i
th
object .
2) Sum Cji over all possible j.
3) Choose the object i that maximizes the sum
of C
ji
over all possible j.
4) Repeat the process until k objects have been
found.
Phase-2:
The second step attempts to improve the set of
representative objects. This does so by considering
all pairs of objects (i; h) in which i has been chosen
but h has not been chosen as a representative. Next it
is determined if the clustering results improve if
object i and h are exchanged. To determine the
effect of a possible swap between i and h we use the
following algorithm:
Consider an object j that has not been previously
selected. We calculate its swap contribution C
jih
:
1) If j is further from i and h than from one of the
other representatives, set C
jih
to zero.
2) If j is not further from i than any other
representatives (d(j;i)=d
j
), consider one of two
situations:
a) j is closer to h than the second closest
representative & d(j; h) < E
j
where E
j
is the
Euclidian distance of between j
th
object and the
second most similarly representative . Then
C
jih
= d(j; h)-d(j; i).
Note: C
jih
can be either negative or positive
depending on the positions of j, i and h. Here only if
ICSOFT 2008 - International Conference on Software and Data Technologies
256
j is closer to i than to h is there a positive influence
at implies that a swap between object i and h are a
disadvantage in regards to j.
b) j is at least as distant from h than the second
closest representative( d(j; h) >=Ej ).Let Cjih =
Ej - dj. The measure is always positive,
because it not wise to swap i with h further
away from j thane second closest
representative.
3) If j is further away from i than from at least one of
the other representatives, but closer to h than to any
other representative, C
jih
= d(i; h) - d
j
will be the
contribution of j to the swap.
4) Sum the contributions over all j. T
ih
= ∑ C
jih
. This
indicates the total result of the swap.
5) Select the ordered pair (i; h) which minimizes T
ih.
6) If the minimum T
ih
is negative, the swap is carried
out and the algorithm returns to the first step in the
swap algorithm. If the minimum is positive or 0, the
objective value cannot be reduced by swapping and
the algorithm ends.
4 CANCER DATASETS USED
FOR COMPARISION OF
K-MEANS AND PAM
We used three different datasets to make a
comparision study between k-means and PAM
algorithms .Brief description is given below :
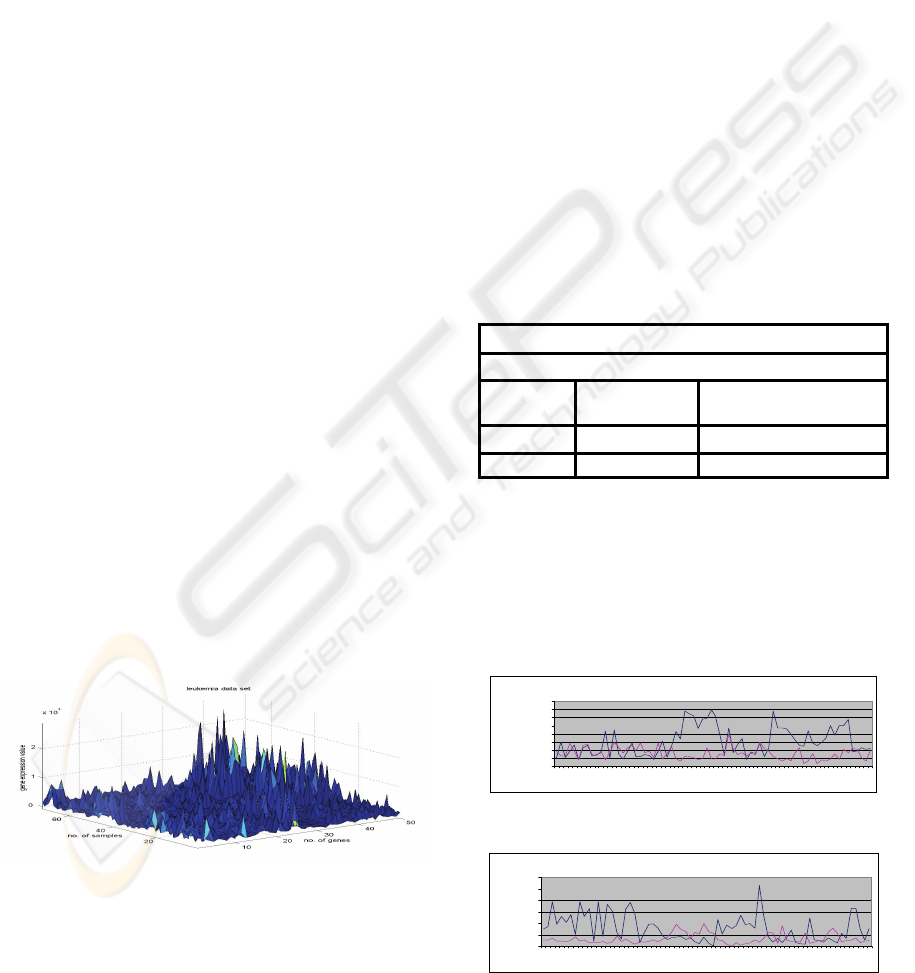
The Leukemia data set is a collection of gene
expression measurements from 72 leukemia
(composed of 62 bone marrow and 10 peripheral
blood) samples reported by Golub.
It contains an initial initial training set composed
of 47 samples of acute lymphoblastic leukemia
(ALL) and 25 samples of acute myeloblastic
leukemia (AML).
Figure 1: Graphical representation of Leukemia dataset.
The Colon dataset is a collection of gene
expression measurements from 62 Colon biopsy
samples from colon-cancer patients reported by
Alon. Among them, 40 tumor biopsies are from
tumors (labelled as "negative") and 22 normal
(labelled as "positive") biopsies are from healthy
parts of the colons of the same patients. Two
thousand out of around 6500 genes were selected
.
The Lymphoma dataset is a collection of gene
expression measurements from 96 normal and
diffused malignant lymphocyte samples reported by
Alizadeh. It contains 42 samples of diffused large B-
cell lymphoma (DLBCL) and 54 samples of other
types. The Lymphoma data set contains 4026 genes.
5 RESULTS
5.1 Comparison of k-means and PAM
for Gene-leukemia Dataset
Here we apply k-means and PAM algorithms on
leukemia data set to classify it into two equivalent
classes . We use two variations of leukemia data set
one with 50-genes and another with 3859-genes.
Table 1: Results for 50-gene-leukemia dataset.
Results of k-means & PAM using 50-gene-leukemia
Total Number of records in dataset = 72
Clustering
Algorithm
Correctly
Classified
Average Accuracy
k-means 69 95.83
PAM 64 88.89
We observe that k-means algorithm converges
fast in comparision to PAM algorithm . In this case,
accuracy for k-means is also better than the accuracy
of PAM algorithm.
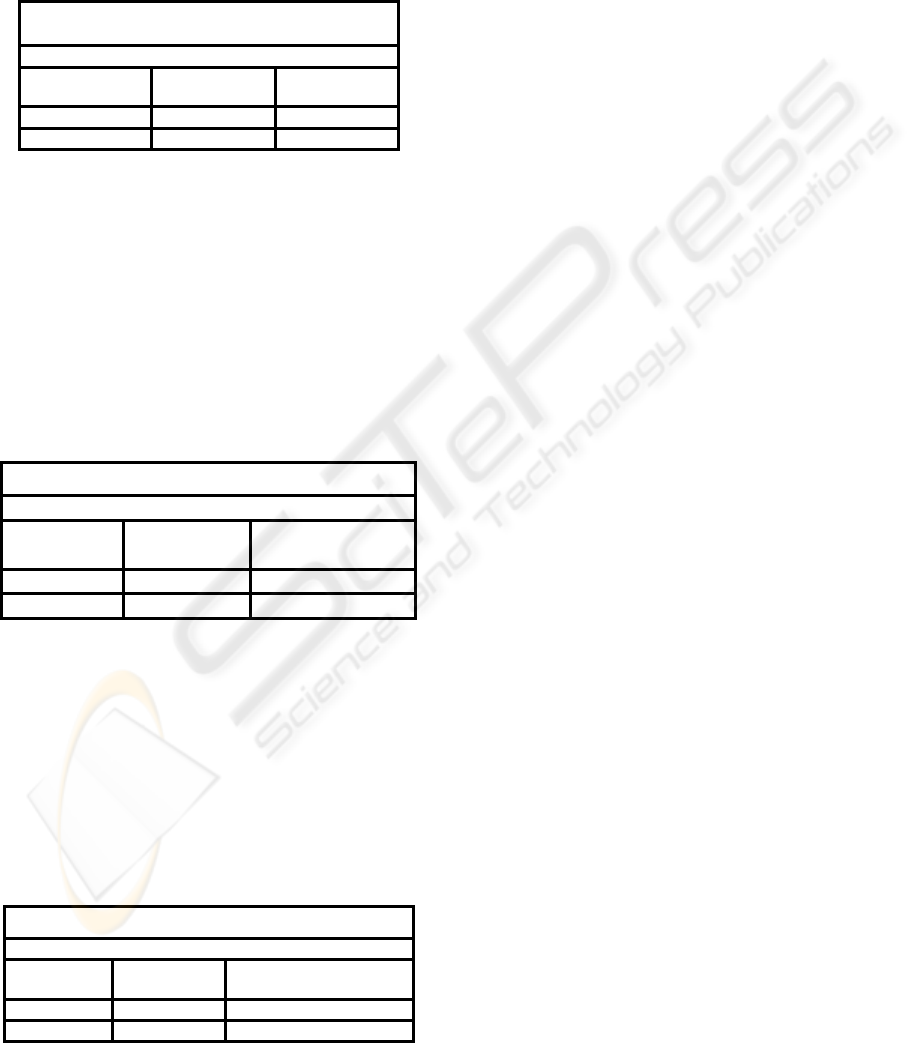
Graphical representation of two cluster centers of
50-gene-leukemia data set using k-means and PAM
algorithm is shown below:
cluster center using k-means
0.00E+ 00
1.00E-01
2.00E-01
3.00E-01
4.00E-01
5.00E-01
6.00E-01
7.00E-01
8.00E-01
1 4 7 10 13 16 19 22 25 28 31 34 37 40 43 46 49 52 55 58 61 64 67 70
Gene Number
Gene Express ion Val ue
Figure 2: Graph of cluster centers using k-means.
Cluster centers using PAM
0
2000
4000
6000
8000
10000
12000
1 4 7 101316192225283134374043464952555861646770
Gene Number
Gene Expressi on Val ue
Figure 3: Graph of cluster centers using PAM.
COMPARISION OF K-MEANS AND PAM ALGORITHMS USING CANCER DATASETS
257
When we apply these algorithms on 3859-gene-
leukemia dataset results are different as compared to
results with 50-gene-leukemia dataset. In this case
PAM algorithm’s accuracy is better than k-means
algorithm’s accuracy. This shows that PAM perform
better when we increase number of attributes.
Table 2: Results for 3859-gene-leukemia dataset.
Results of k-means and PAM using
3859-gene-leukemia
Total number of records in dataset = 72
Clustering
Algorithm
Correctly
Classified
Average
Accuracy
k-means 61 84.72
PAM 68 94.44
5.2 Comparison of K-means and PAM
for 2000-Gene-colon Dataset
Analysis of 2000-gene-colon data set is also done
with the help of these two partitioning algorithms
i.e. k-means and PAM algorithm. In this case PAM
algorithm performs better then k-means method. But
accuracy difference between these algorithms over
colon data set is significantly low. Average accuracy
remains low.
Table 3: Results for 2000-gene-colon dataset.
Results of k-means and PAM using 2000-gene-colon
Total number of records in dataset = 62
Clustering
Algorithm
Correctly
Classified
Average Accuracy
k-means 33 53.22
PAM 34 54.84
5.3 Comparison of K-means and PAM
for 4026-Gene-lymphoma Dataset
Using these algorithms , we divide the whole dataset
into two different clusters which are used to
differentiate between normal and diffused samples .
Here PAM algorithm correctly classifies 77 records
out of 96 whereas k-means algorithm correctly
classifies 71 records
Table 4: Results for 4026-gene-dlbcl dataset.
Results of k-means and PAM using 4026-gene-dlbcl
Total number of records in dataset = 96
Clustering
Algorithm
Correctly
Classified
Average Accuracy
k-means 71 73.96
PAM 77 80.21
So it is clear that PAM performs better when we
increase the number of genes.
6 SUMMARY
Algorithm’s comparision shows that accuracy of
PAM is better from accuracy of k-means as number
of objects in the dataset increases. In case of k-
means intial selection of cluster centres plays a very
important role. So there is a possibility to improve
both algorithms by using some good initial selection
technique. Here in this paper PAM performs better
in the classification of cancer types using cancer
datasets than k-means.
REFERENCES
Alizadeh A.A, Eisen M.B, Davis R.E, et al. Distinct types
of diffuse large B-cell lymphoma identified by gene
expression profiling. Nature. 2000;403(6769):503–
511.
Bittner M, Meltzer P, Chen Y, et al. Molecular
classification of cutaneous malignant melanoma by
gene expression profiling. Nature.
2000;406(6795):536–540.
Fayyad, M.U., Piatesky-Shapiro, G., Smuth P.,
Uthurusamy, R. (1996). Advances in Knowledge
Discovery andData Mining. AAAI Press.
Gibbons F.D, Roth F.P. Judging the quality of gene
expression-based clustering methods using gene
annotation. Genome Res. 2002;12(10):1574–1581.
Golub T.R, Slonim D.K, Tamayo P, et al. Molecular
classification of cancer: class discovery and class
prediction by gene expression monitoring. Science.
1999;286(5439):531–537.
Guha, S., Rastogi, R., and Shim K. (1998). CURE: An
Efficient Clustering Algorithm for Large Databases. In
Proceedings of the ACM SIGMOD Conference.
L. Kaufman and P. J. Rousseeuw, Finding Groups in Data:
an Introduction to Cluster Analysis, John Wiley &
Sons, 1990.
MacQueen, J.B. (1967). Some Methods for Classification
and Analysis of Multivariate Observations. In
Proceedings of 5th Berkley Symposium on
Mathematical Statistics and Probability, Volume I:
Statistics, pp. 281–297.
Nielsen T.O, West R.B, Linn S.C, et al. Molecular
characterisation of soft tissue tumours: a gene
expression study. Lancet. 2002;359(9314):1301–1307.
Yeung K.Y, Haynor D.R, Ruzzo W.L. Validating
clustering for gene expression data. Bioinformatics.
2001;17(4):309–318.
ICSOFT 2008 - International Conference on Software and Data Technologies
258
