
DETERMINING SEVERITY AND RECOMMENDATIONS IN
PROCESS NON-CONFORMANCE INSTANCES
Sean Thompson and Torab Torabi
Department of Computer Science and Computer Engineering, La Trobe University, Bundoora, Australia
Keywords: Process improvement, process severity, recommender systems, process non-conformance, non-conformance
detection.
Abstract: We have seen a variety of frameworks and methodologies aimed at dealing with non-conformance in
processes presented in the literature. These methodologies seek to find discrepancies between process
reference models and data returned from instances of process enactments. These range from methodologies
aimed at preventing deviations and inconsistencies involved in workflow and process support systems to the
mining and comparison of observed and recorded process data. What has not been presented in the literature
thus far is a methodology for explicitly discerning the severity of instances of non-conformance once they
are detected. Knowing how severe an instance of non-conformance might be, and therefore an awareness of
the possible consequences this may have on the process outcome can be helpful in maintaining and
protecting the process quality. Subsequently, a mechanism for using this information to provide some kind
of recommendation or suggested remedial actions relating to the non-conformance for process improvement
has also not been explored. In this paper we present a framework to address both these issues. A case study
is also presented to evaluate the feasibility of this framework.
1 INTRODUCTION
Although research has been conducted in detecting
deviations in processes in the past, very little
research has been conducted in determining the
severity of the non-conformance detected. Knowing
the severity of detected instances of non-
conformance is useful because it provides an
indication of its possible implications. Therefore a
severity indicator can aid in the provision of
recommendation information to the administrators of
the process – another area in process improvement
in which little work has been presented. In this
paper, we seek to provide a framework on how the
severity of deviations and inconsistencies in
processes may be ascertained and show how this
information can be used to provide effective
recommendations to process administrators.
In order to be successful in detecting non-
conformance and ascertaining its severity, the
process model must be defined and implemented in
a formal and robust way. Informal process
definitions result in an array of problems with
process control, transfer of process knowledge and
adaptation to change (
Rombach 1990).
There have been a number of different approaches
presented in the literature with the goal of detecting
process deviations. These include an approach
presented by Huo, Zhang, Jeffery (2006) based on
process discovery, where they compare a discovered
process model to a pre-determined reference model
to find discrepancies. Process discovery is a
technique described in (Cook, Wolf 1998) where
process data is mined in order to discover the
process model from its enacted values. A fuzzy
logic approach such as in (Cîmpan, Oquendo 2000)
was also presented, where again the idea is to
compare a monitored process enactment to a
reference model and take test for conformance. Our
own research presented in (Thompson, Torabi, Joshi
2007) is also aimed at detecting inconsistencies and
deviations where specific values are defined for
process activity attributes and activity transitions
which are tested against reference values as they are
being recorded.
In this research, we consider a “process” to be a
set of one or more activities being smaller, simpler
units or tasks which may be carried out sequentially,
concurrently, simultaneously, overlapping or in
parallel (Huo, Zhang, Jeffery 2006), (Rezgui et al.
127
Thompson S. and Torabi T. (2008).
DETERMINING SEVERITY AND RECOMMENDATIONS IN PROCESS NON-CONFORMANCE INSTANCES.
In Proceedings of the Third International Conference on Software and Data Technologies - ISDM/ABF, pages 127-133
DOI: 10.5220/0001875701270133
Copyright
c
SciTePress

1997). We also assume these activities are assigned
to actors who are responsible for their enactment
(Dowson, Nejmeh, Riddle 1990).
The concepts of deviation and inconsistency we
adopt from (Cugola et al. 1996) where the authors
distinguish between the two. We consider the values
that hold for a given state or activity within a
process to relate to inconsistencies whereas the
conditions that define the rules of transition between
activities/states relate to deviations. These
assertions also hold in our previous research
presented in (Thompson, Torabi, Joshi 2007) which
is the test system we have implemented this research
extension into. When we use these terms, we are
referring to the concept of “non-conformance”
between a process prescription and an instantiation
of its enactment.
When a “deviation” or “inconsistency” is
detected, we are measuring the difference between
an actual system or process variable and its expected
value (Reese, Leveson 1997). The magnitude of this
distance and its likely implications is very useful
knowledge to a process administrator. If we are
fortunate, a deviation may be considered to have
only trivial consequences to the process goal or
conversely even positive consequences. If however,
the consequences are dire, knowing this promptly
can be useful knowledge to have in curtailing the
possible damage.
If we know how severe an instance of non-
conformance is, we can use this information to
provide useful feedback to the appropriate person. If
the degree of non-conformance is minor, perhaps the
responsible actor should be informed incidentally. If
it is critical, a manager in the process or organization
may need to be informed along with possible
remedies urgently.
Predictably, processes which are executed more
frequently are easier to define better boundary
values for. These processes are therefore conducive
to the application of Statistical Process Control
(SPC) in order to implement better constraints and
boundaries upon the process activities, as SPC
requires a large sample of data before SPC can be
adequately applied (Wang et al. 2006). The success
of Statistical Process Control in quality control in
production lines and manufacturing (Card, 1994)
saw its expansion into other areas, such as food,
packaging, electronics and software development
(Cangussu, DeCarlo, Mathur 2003). Back in 1990
Lantzy argued that there was bias toward the
application of SPC to manufacturing processes
which are inherently different to the dynamic nature
and changing parameters involved in the software
process (Lantzy 1992). Nevertheless, SPC has since
been successfully applied to the software process
and has been applied in many worldwide high CMM
level (4 and 5) organizations (Radice 2000).
The three sigma gap from the mean used in
Statistical Process Control provides an excellent
mechanism for detecting out of control values while
triggering very few false alarms (Florac, Carleton
1999; Jalote, Saxena 2002; Florac, Carleton, Barnard
2000). It is also possible when observing out of
control values as deviations, to determine exactly
how far the value has deviated from the control
limit, which gives us an idea of the deviations
severity. The further the value from the control
limit, the higher the severity.
Jalote et al (2002) argues that the key problem of
SPC is to determine the uncommon causes of
variation in a process such that the performance of
the process can otherwise be predicted. The types of
control charts used in processes may vary depending
upon how frequent data points are in the process.
Processes like software processes have infrequent
data points and so a XmR or U chart is more
appropriate than for processes used in manufacturing
where data points are more frequent.
Another methodology to measure the process is
the “six-sigma” methodology aimed at reducing
defects in a given process such that it becomes as
near perfect as possible. A process with six-sigma
quality is a process with no more than 3.4 defects
per 1 million opportunities, where an opportunity is
a chance for the process to not conform (VanHilst,
Garg, Lo 2005; Ferrin, Miller, Muthler 2005).
Investment in improving a process beyond six-sigma
is thought not to be cost-effective (VanHilst, Garg,
Lo 2005).
The approach presented in this paper has two
distinct goals. Firstly, we provide a framework for
how severity may be measured in process
inconsistencies and deviations both for numeric and
non-numeric data types, which appears in section 2.
Secondly in section 3, we show how this information
can be useful in providing appropriate feedback
which can be useful for process administrators.
Section 4 provides an evaluation and conclusion for
this paper.
2 SEVERITY
The notion of “severity” in this research is related to
the effect non-conformance may have on a process.
Therefore, we are concerned with not only the
magnitude of difference between an actual value and
ICSOFT 2008 - International Conference on Software and Data Technologies
128
its expected value, but also the consequences this
anomaly may have on a) its associated activity (if
applicable) and b) the process as a whole. We tackle
this problem by first calculating the margin of
difference in its own right, and then applying
modifiers to the initial severity depending on the
importance of the underlying values within the
process, which is explained in section 2.3.
Given the distinction between the concepts
“inconsistency” and “deviation” cited in (Cugola et
al. 1996), determining severity in each is handled
slightly differently. The initial severity rating of
numeric and non-numeric data must be determined
differently given the nature of the data. The major
problem here is calculating the severity of both data
types in such a way that the resulting severity ratings
are relative to one another within the scope of the
process. Also, as we explained in (Thompson,
Torabi, Joshi 2007), deviation data is always related
to the transition of process activities and therefore
always “non-numeric” in nature. Inconsistency data
however may be numeric in nature and also can
related to the process as a whole, not just specific
activities. Examples of process wide inconsistency
types from (Thompson, Torabi, Joshi 2007) include
instances such as “too many exceptions” or “illegal
activity count”.
In the interests of simplicity, every deviation and
inconsistency detected may be given a simple rating
when first detected, according to the scale portrayed
in figure 1:
Figure 1: Severity Scale.
If for some reason, a deviation or inconsistency is
detected but the severity is indeterminable, we rate it
“NA”. Otherwise we rate it according to the scale
shown in figure 1 with a default rating of “Average”.
The method used in calculating these severity ratings
for both numeric and non numeric data types is
explained in sections 2.1 and 2.2. This first step
differentiates our model from any similar approach
such as in (Cîmpan, Oquendo 2000) where the fuzzy
gap between the instantiated process and the model
is apparent but not explicitly recognized.
2.1 Numeric Data Severity
For numeric oriented data types, it is a simple matter
of placing boundaries and calculating whether or not
an actual value is within them and if not, how far it
is outside. If a large amount of data is available,
Statistical Process Control is an excellent method in
both placing the boundaries and calculating how far
outside actual values might be (Florac, Carleton
1999). If there is not enough data available, we must
set our own boundaries as best we can.
If there is enough data for SPC to be adequately
applied, ascertaining severity of the deviation
becomes a simple matter of measuring how many
standard deviations the actual value returned is from
the boundary. We can then apply an appropriate
severity value based on the scale shown in
previously in figure 1. If there is not an adequate
amount of data to apply SPC, we need to calculate
the level of severity of the out-of-bounds value by
comparing the difference between the actual value
and the boundary.
Care must be taken however, when deciding
whether there is enough data present or not to rely
on boundary values supplied by an SPC calculation.
Our research presented in (Thompson, Torabi 2007)
showed that rather a large amount of data was
necessary before SPC may be adequately applied,
and the point at which this threshold is reached is
not always clear and always dependent on the nature
of the particular process.
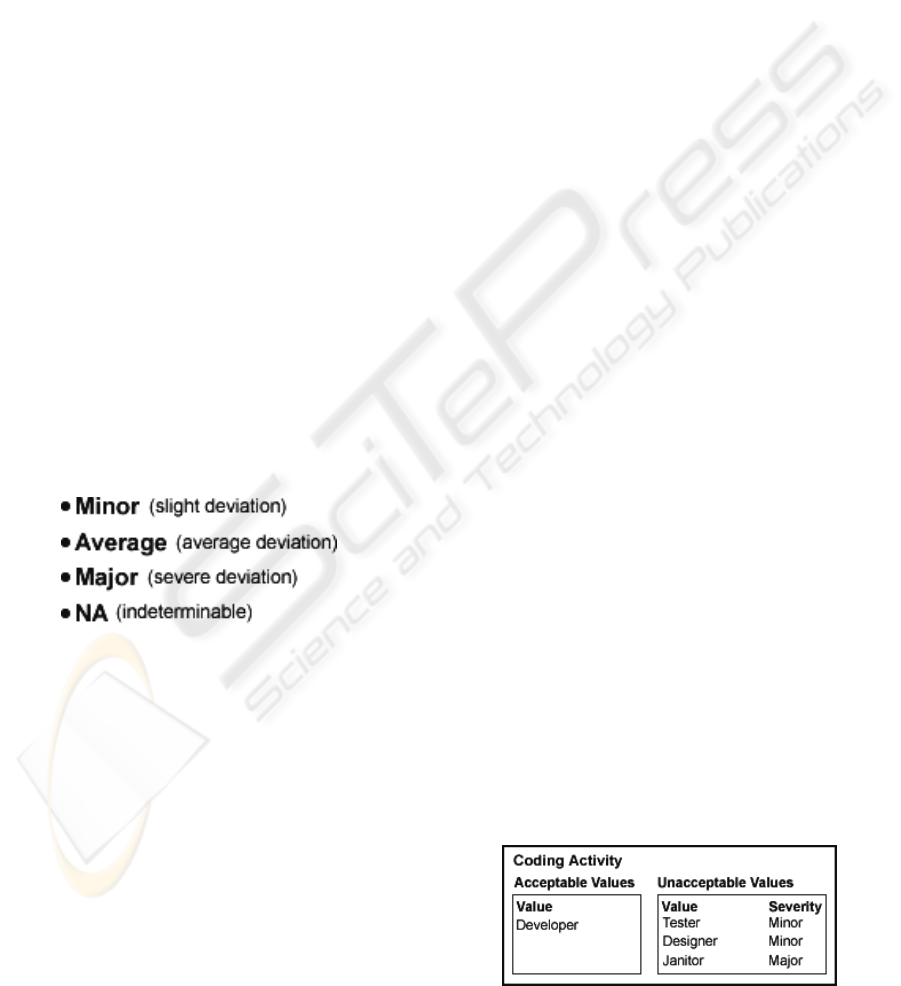
2.2 Non-Numeric Data Severity
In (Thompson, Torabi, Joshi 2007), in order to
determine if an inconsistency had taken place with
non-numeric data, we compared the actual value
against a list of accepted values. If the actual value
did not match any of the values represented in the
accepted values list, an inconsistency was flagged.
To expand on this, for non-numeric list types we
introduce another list of unacceptable return values
and an appropriate severity value for each. An
example of this concept is illustrated in figure 2,
where we are checking for activity actor type
inconsistencies.
Figure 2: Value Lists.
DETERMINING SEVERITY AND RECOMMENDATIONS IN PROCESS NON-CONFORMANCE INSTANCES
129
If a value is returned which is not in either the
“Acceptable” or “Unacceptable” list, a deviation will
still be flagged but with an initial (before modifiers)
severity rating of NA. We can therefore ease the
workload involved in second guessing all
possibilities of unacceptable return values. Any
unexpected “unacceptable” values returned that
initially have the NA severity rating can easily be re-
rated later at the whim of the process administrator.
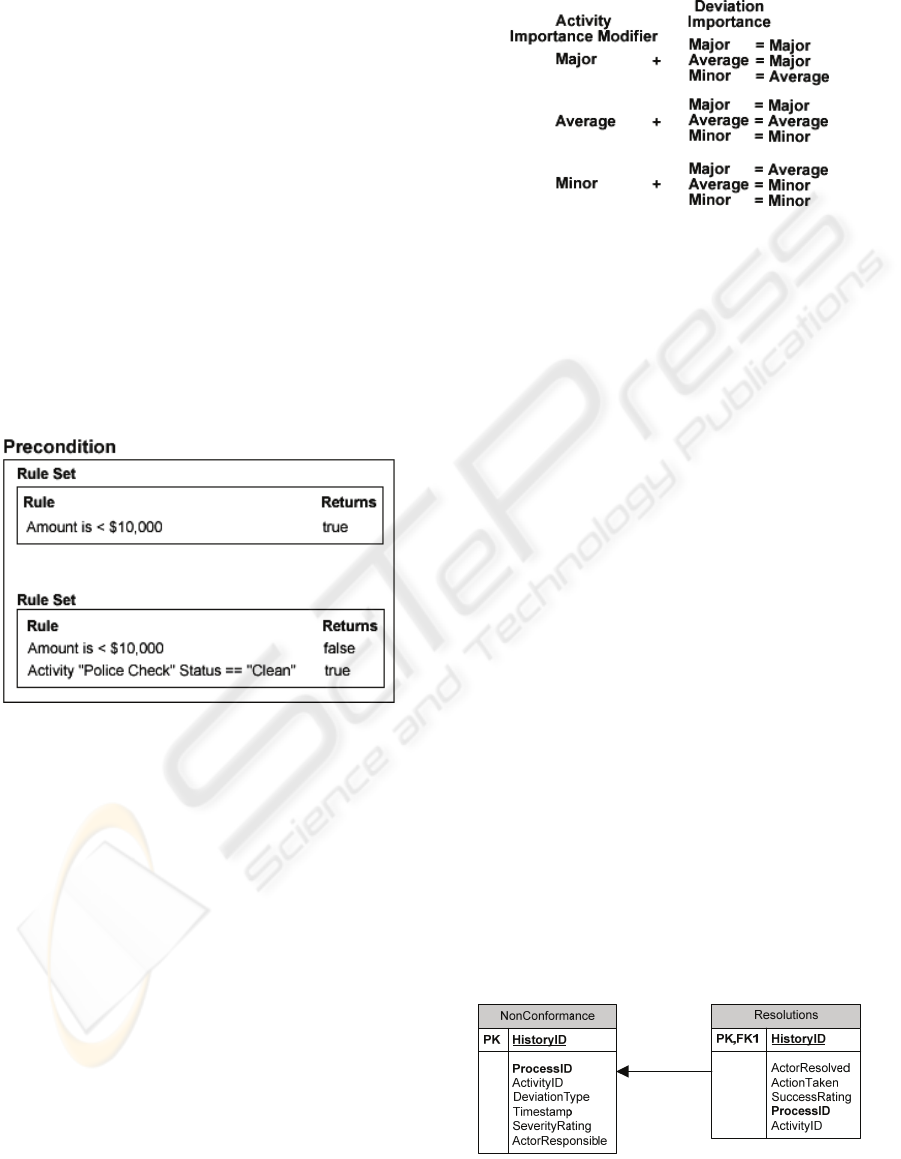
In (Thompson, Torabi, Joshi 2007) conditions
were specified by SQL checks on a relational
database to test whether or not a condition holds.
Deviations were recorded when either a condition
was expected to hold but did not, or a condition was
expected not to hold, but did. These conditions were
sorted into related “condition sets” which specify the
conditions in which a process activity can legally
begin and terminate. An example of a condition set
for the activity of a bank teller approving a bank
deposit is illustrated below in figure 3 (taken from
(Thompson, Torabi, Joshi 2007)).
Figure 3: Condition Set Example.
In terms of severity, a severity rating is simply
included with each condition set. If a deviation
occurs because of one or more condition sets failing
in an activity, then the severity of the deviation
becomes the severity value of the condition set with
the associated highest severity rating.
2.3 Modifiers
Once we have determined the severity of a deviation
or inconsistency in its own right, we must then
determine a) the severity of the impact this may have
on its associated activity and b) the impact this may
have on the process as a whole.
For deviations and inconsistencies relating to
process activities, the illustration shown in figure 4
shows how we can set the importance activities may
hold in the process and how this can modify the
overall severity of the detected deviation or
inconsistency:
Figure 4: Activity Importance Modifiers.
For inconsistency types that hold for the entire
process and are not related to any specific activity,
the Activity Importance Modifier shown in figure 4
may be applied to the inconsistency data to give an
importance rating with respect to the process, as
though it was an activity in itself.
3 RECOMMENDATION
Once we have sufficient information about a
deviation or inconsistency including a) that it has
actually occurred (been detected), b) what part of the
process it occurred in, c) when it occurred and d) the
severity in relation to the process, we can feed this
information to a simple type of “recommender
system” to provide useful feedback to the
administrator(s) or people involved in the enactment
of the process. The actual implemented algorithm
for the recommender system here may be susceptible
to change, as some algorithms will perform better
for different data sets (
Herlocker et al. 2004) and
different processes will return different sets of data.
Our approach incorporates a non-conformance
log which records deviations and inconsistencies and
which serves several purposes. If a process is
enacted and a deviation/inconsistency is detected,
we can record all relevant data in a history log which
is related to a resolutions table which records
information on its resolution. The table is structured
as shown in figure 5:
Figure 5: Non-Conformance Logs.
ICSOFT 2008 - International Conference on Software and Data Technologies
130

This non-conformance log provides several benefits
to the process administrator. Firstly, we can query a
list of unresolved deviations/inconsistencies from
the table for any given process ranked by their
severity for the process administrator to address.
The Resolutions log also provides the capacity to
enter data on how past entries were resolved, who
resolved them and how successful the resolution
was. Using the data in both tables we can
extrapolate possible effective solutions to unresolved
deviations and inconsistencies by matching them
with similar resolved cases which had a high success
rating, an important concept in recommender
systems (
McNee, Riedl, Konstan 2006). Lastly,
because all instances of non-conformance are
logged, it makes it easy to tell if one particular type
of non-conformance or even specific activity or
whole process seems to be experiencing more than
its fair share of entries in the non-conformance table.
In the literature presented so far in this area of
research, a recommendation system of any kind
resulting from detection of an instance of non-
conformance has not been published. Therefore,
comparison with related works in regard to post non-
conformance recommendations is somewhat limited
in this instance.
4 EVALUATION
To evaluate this methodology we have developed an
extension to the implementation used to evaluate the
framework for non-conformance detection presented
in (Thompson, Torabi, Joshi 2007). To test the
compatibility of our two deviation systems, we have
simulated numerous instances of the bank deposit
process also presented in (Thompson, Torabi, Joshi
2007).
4.1 The Test Process
The process we have used to evaluate this model is
the same as we described in (Thompson, Torabi,
Joshi 2007). We have simulated a simple process of
how a person may deposit an arbitrary amount of
cash in their bank account via a bank teller. A run
down of the process is illustrated below in figure 6
which is incidentally also taken from (Thompson,
Torabi, Joshi 2007). This straightforward process is
used to test the methodologies and techniques
described in this paper in a simple setting where the
return data can be easily understood and evaluated in
comparison to our expected results.
Figure 6: The Bank Deposit Process.
The implementation used to simulate and test this
process was developed using a C# .NET engine
which was built to cater for the simulation of generic
processes with generic activities. The example
process was prescribed and constrained in a manner
consistent with our methodology using this engine
and all process data was contained in a relational
database. Although a single database was used, the
related tables within it are structured in three tiers –
one to contain the prescribed reference constraints,
rules and boundaries, another to structure recorded
instances of enacted process data and lastly a log to
record detected instances of non-conformance along
with their severity. Since all relevant data was
stored in a relational database, all comparisons
between reference and actual data were made via
SQL queries. The inter-related tables within the
database are illustrated in figure 7 which depicts the
three tiers of data tables (image is partially modified
from (Thompson, Torabi, Joshi 2007)):
Figure 7: Framework Structure.
DETERMINING SEVERITY AND RECOMMENDATIONS IN PROCESS NON-CONFORMANCE INSTANCES
131
4.2 Results
In terms of the non-numeric data, the return of
expected results is easily identifiable because the
methodology is simply a comparison of actual data
to a list and each entry in the list has a severity value
attached to it. The algorithm implemented was to
check the accepted values list first and look for an
entry identical to the actual return value. If the value
was not found, it then checks the unacceptable
values list. If the actual return value was found in
this list, it returns the associated severity rating and
if not, an inconsistency is still recorded along with a
severity rating of “NA”. This is easily verifiable in
the framework and we succeeded in identifying
examples of both cases.
To simulate numeric data severity instances, such as
time duration values, instead of attaching one
min/max range to the data we attached three range
sets. Further from our discovery reported in
(Thompson, Torabi 2007) of just how large a dataset
is required to adequately apply SPC ranges, each
boundary value in each of the three ranges is user
defined and applied in a manner consistent with
what is shown in figure 8:
Figure 8: Numeric Ranges.
The implemented framework only has to check the
actual numeric return value against the boundary
constraint values specified. If the actual value falls
into a range that is not “acceptable” then it receives
the applicable severity rating and an instance of non-
conformance is recorded. For example, as part of
the simulation twenty runs of the “Fill Out Deposit
Form” were conducted and the time taken to
complete the activity compared against the specified
severity constraints. This data is illustrated in figure
9 below:
Figure 9: Example Simulated Data.
The recommendation engine proved the most
difficult to implement and at present the mining of
the recorded data still needs improvement in our
future work. However, given the structure of the
non-conformance and resolutions log, the simplest
way to find the most effective resolution for an
instance of non conformance is to list all records in
the non-conformance table with the same
ActivityID, ProcessID and DeviationType as the
record we are attempting to find a resolution for.
Then, we match these records against those in the
resolutions table where the resolution success rating
is highest. At present we are rating the success of
resolutions out of 10 in the implementation, so the
recommendations system implemented so far is
limited to a simple query which returns the most
successful related resolution for a given deviation.
4.3 Future Work
The methodology presented here is relatively simple
to implement and test, so the results we wanted and
expected were easy to achieve simulating the test
process. Our immediate future work in this area will
be predominantly in 2 areas: dynamic severity
boundaries and better data mining for the
recommender system.
We would like to examine further the
development of dynamic severity thresholds to the
boundary values of both numeric and non-numeric
data types. This would aid the process administrator
in automatically calculating severity thresholds so he
or she does not have to set them manually. Also, we
believe that given better querying and data mining
methods, the data we are storing in the resolutions
and non-conformance log could lead to better
recommendations being generated when instances of
non-conformance are detected.
5 CONCLUSIONS
In this paper we have presented a practical
framework to ascertain severity in generic processes
along with a basis for providing recommendations
based on the resulting severities and process history.
This framework is aimed at extending the research
presented in detecting process non-conformance and
is implemented as such. This body of work shows
promise in its application to processes across
different domains such as business, software or
manufacturing processes – as long as the process is
structured and there is ample opportunity for
observing the relevant data. With this in mind, it is
ICSOFT 2008 - International Conference on Software and Data Technologies
132

difficult for any kind of process improvement
mechanism to be employed if the process in question
cannot be properly observed. As stated in section 4,
our future research in this field will entail an
improved and more comprehensive mechanism for
recommendation provision and also a
mathematically formal model for severity
determination.
REFERENCES
Cangussu, J.W., DeCarlo, R.A., and Mathur, A.P. 2003.
Monitoring the software test process using statistical
process control: a logarithmic approach. Proceedings
of the 9th European software engineering conference
held jointly with 11th ACM SIGSOFT international
symposium on Foundations of software engineering
ESEC/FSE-11. 28, 5 (September 2003). ACM Press.
Card, D. 1994. Statistical process control for software?
IEEE Software. 11, 3 (May 1994). 95 – 97.
Cîmpan, S., and Oquendo, F. 2000. Dealing with software
process deviations using fuzzy logic based monitoring.
ACM SIGAPP Applied Computing Review. 8, 2
(December 2000). ACM Press.
Cook, J.E., and Wolf, A.L. 1998. Discovering models of
software processes from event-based data. ACM
Transactions on Software Engineering and
Methodology (TOSEM). 7, 3 (July 1998).
Cugola, G., Di Nitto, E., Fuggetta, A., and Ghezzi, C.
1996. A framework for formalizing inconsistencies
and deviations in human-centered systems. ACM
Transactions on Software Engineering and
Methodology (TOSEM). 5, 3 (July 1996). ACM Press.
Dowson, M., Nejmeh, B., and Riddle, W. 1990. Concepts
for Process Definition and Support. Proceedings of the
6
th
International Software Process Workshop
(Hakodate, Japan, October 28-31 1990). IEEE
Computer Society Press.
Ferrin, D.M., Miller, M.J., and Muthler, D. 2005. Six
Sigma and simulation, so what's the correlation?
Proceedings of the 37th conference on Winter
simulation (December 2005). WSC '05. Winter
Simulation Conference.
Florac, W.A., and Carleton, A.D. 1999. Measuring the
Software Process: Statistical Process Control for
Process Improvement, Addison-Wesley.
Florac, W.A., Carleton, A.D., and Barnard, J.R. 2000.
Statistical Process Control: Analyzing a Space Shuttle
Onboard Software Process. IEEE Software. 17, 4
(July/Aug 2000). 97 - 106.
Herlocker, J.L., Konstan, J.A., Terveen, L.G., and Riedl,
J.T. 2004. Evaluating collaborative filtering
recommender systems. ACM Transactions on
Information Systems (TOIS). 22, 1 (January 2004).
ACM Press.
Huo, M., Zhang, H., and Jeffery, R. 2006. An Exploratory
Study of Process Enactment as Input to Software
Process Improvement. Proceedings of the 28th
International Conference on Software Engineering
(Shanghai, China, May 2006). ICSE '06. ACM Press.
Jalote, P., and Saxena, A. 2002. Optimum control limits
for employing statistical process control in software
process. IEEE Transactions on Software Engineering.
28, 12 (Dec. 2002), 1126 – 1134.
Lantzy, M.A. 1992. Application of statistical process
control to the software process. Proceedings of the
ninth Washington Ada symposium on Ada:
Empowering software users and developers (July
1992). ACM Press.
McNee, S.M., Riedl, J., and Konstan, J.A. 2006. Work-in-
progress: Making recommendations better: an analytic
model for human-recommender interaction. Extended
abstracts on Human factors in computing systems
(April 2006). CHI '06. ACM Press.
Radice, R. 2000. Statistical Process Control in Level 4 and
Level 5 Software Organizations Worldwide. The
Twelfth Annual Software Technology Conference, Salt
Lake City, Utah, May 4, 2000.
Reese, J.D., and Leveson, N.G. 1997. Software deviation
analysis. Proceedings of the 19th international
conference on Software engineering (May 1997).
ACM Press.
Rezgui, Y., Marir, F., Cooper, G., Yip, J., and Brandon, P.
1997. A Case-Based Approach to Construction
Process Activity Specification. Intelligent Information
Systems (December 8-10, 1997) IIS '97. 293 – 297.
Rombach, H.D. 1990. Specification of software process
measurement. Proceedings of the 5th international
software process workshop on Experience with
software process models (October 1990). IEEE
Computer Society Press.
Thompson, S., Torabi, T., and Joshi, P. 2007. A
Framework to Detect Deviations during Process
Enactment. 6th IEEE International Conference on
Computer and Information Science (Melbourne,
Australia, July 11–13, 2007). IEEE Computer Society
Press.
Thompson, S., and Torabi, T. 2007. A Process
Improvement Approach to Improve Web Form Design
and Usability. The 3rd Ubiquitous Web Systems and
Intelligence Workshop (Regensburg, Germany,
September 3-7, 2007). UWSI 2007 Colocated with
DEXA 2007.
VanHilst, M., Garg, P.K., and Lo, C. 2005. Repository
mining and Six Sigma for process improvement.
Proceedings of the 2005 international workshop on
Mining software repositories. 30, 4 (May 2005). MSR
'05. ACM Press
Wang, Q., Jiang, N., Gou, L., Liu, X., Li, M., and Wang,
Y. 2006. BSR: a statistic-based approach for
establishing and refining software process
performance baseline. Proceedings of the 28th
International Conference on Software Engineering
(Shanghai, China, May 2006). ICSE '06. ACM Press.
DETERMINING SEVERITY AND RECOMMENDATIONS IN PROCESS NON-CONFORMANCE INSTANCES
133
