
SOFTWARE EFFORT ESTIMATION AS A CLASSIFICATION
PROBLEM
Ayşe Bakır, Burak Turhan and Ayşe Bener
Department of Computer Engineering, Boğaziçi University, 34342 Bebek, Istanbul, Turkey
Keywords: Software effort estimation, Interval prediction, Classification, Cluster analysis, Machine learning.
Abstract: Software cost estimation is still an open challenge. Many researchers have proposed various methods that
usually focus on point estimates. Software cost estimation, up to now, has been treated as a regression
problem. However, in order to prevent over/under estimates, it is more practical to predict the interval of
estimations instead of the exact values. In this paper, we propose an approach that converts cost estimation
into a classification problem and classifies new software projects in one of the effort classes each
corresponding to an effort interval. Our approach integrates cluster analysis with classification methods.
Cluster analysis is used to determine effort intervals while different classification algorithms are used to find
the corresponding effort classes. The proposed approach is applied to seven public data sets. Our
experimental results show that hit rates obtained for effort estimation are around 90%-100%s. For point
estimation, the results are also comparable to those in the literature.
1 INTRODUCTION
Software cost estimation is one of the critical steps
in software development lifecycle (Leung and Fan,
2002; Boehm, 1981). It is the process of predicting
the effort required to develop a software project.
Such predictions assist project managers when they
make important decisions such as bidding, etc.
Although most methods proposed in literature
produce point estimates, Stamelos and Angelis states
that producing interval estimates is safer (Stamelos
and Angelis, 2001). Up to now, interval estimation is
composed of finding either the confidence intervals
for point estimates or the posterior probabilities of
predefined intervals (Angelis and Stamelos, 2000;
Jorgensen, M., 2003; Sentas et al. 2004; Sentas et al.
2003) and then fitting regression-based methods to
these intervals. However, none of these approaches
address cost estimation problem as a pure
classification problem. In this paper, by using
interval estimation as a tool, we aim to convert cost
estimation into a classification problem. By using
cluster analysis, effort classes are determined
dynamically instead of using manually-predefined
intervals. Then, classification methods are applied
on clustered data in order to find the estimated effort
interval.
2 RELATED WORK
Previous work on software cost estimation mostly
produces point estimates by using regression
methods. There is less number of studies that focus
on interval estimation. These studies can be grouped
into two main categories: (1) those which produce
confidence intervals for point estimates and (2) those
which produce the probabilities of predefined
intervals. In (1), interval estimates are generated
during the estimation process (Angelis and
Stamelos, 2000; Jorgensen, M., 2003). In (2) the
intervals are predefined before the estimation
process (Sentas et al. 2004; Sentas et al. 2003). In
contrast to these studies, in this paper, firstly, effort
intervals are not predefined manually; rather, they
are determined by clustering analysis. Secondly,
instead of using regression-based methods, we use
classification algorithms that originate from machine
learning area. Thirdly, point estimates can still be
derived from these intervals; this will be shown in
the following sections.
We also use cluster analysis for grouping similar
projects in this paper as in (Lee et al. 1998; Gallego
et al. 2007). The difference of our research with
these studies is that we combine clustering with
classification methods for effort estimation.
274
Bakır A., Turhan B. and Bener A. (2008).
SOFTWARE EFFORT ESTIMATION AS A CLASSIFICATION PROBLEM.
In Proceedings of the Third International Conference on Software and Data Technologies - SE/GSDCA/MUSE, pages 274-277
DOI: 10.5220/0001877802740277
Copyright
c
SciTePress
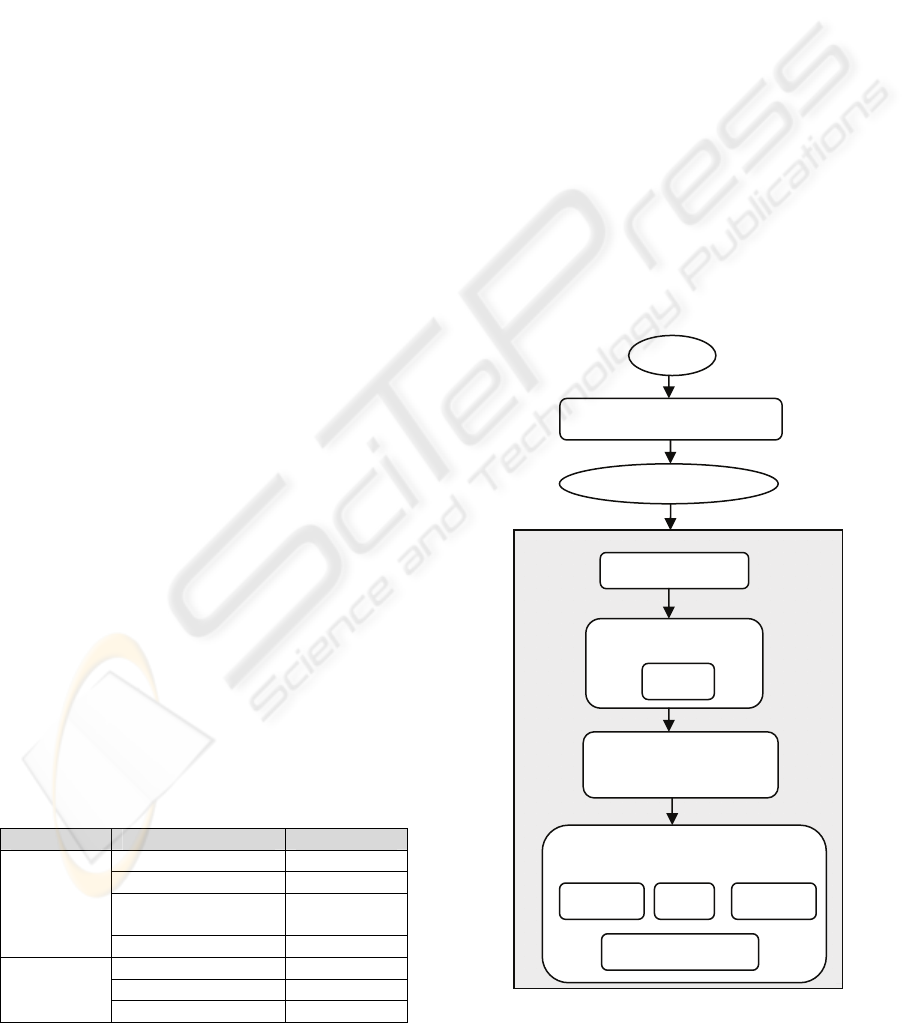
Figure 1: Our proposed model.
On Each Cluster
Data
Min-Max Normalization
Normalized Data
Leader Cluster
Find Effort Intervals
for Each Cluster
10x10 Cross-Validation
K-NN
Calculate Errors
LD DT
PCA
3 THE APPROACH
There are three main steps in our approach: (1)
grouping similar projects together by cluster
analysis, (2) determining the effort intervals for each
cluster and specifying the effort classes, and (3)
classifying new projects into one of the effort
classes. The resulting class shows the effort interval
that contains the new project’s effort value.
In step (1), we use an incremental clustering
algorithm called Leader Cluster (Alpaydin, 2004). In
this algorithm, the number of the clusters is not
predefined; instead, the clusters are generated
incrementally and Euclidean distance is used as
similarity measure (Bakar et al. 2005; Lee et al.
1998).
In step (2), firstly, the minimum and maximum
of the efforts of the projects that reside in the same
cluster are found. Secondly, these minimum and
maximum values are chosen as the upper and lower
bounds of the interval that will represent that cluster.
Finally, each cluster is given a class label which will
be used to classify the new projects into.
In step (3), we use three different classification
algorithms with different complexities. Linear
Discrimination is the simplest one whereas Decision
Tree is the most complex one. K-Nearest Neighbor
has a moderate complexity depending on the training
set size (Alpaydin, 2004; Quinlan, 1993).
4 EXPERIMENTAL STUDY
MATLAB is used for the implementation of the
approach.
4.1 Data Set Description
In our experiments, data from two different sources
are used: Promise Data Repository and Software
Engineering Research Laboratory (SoftLab)
Repository (Boetticher et al., 2007; SoftLab). An
overview of all the datasets used is given in Table 1.
Table 1: An overview of the datasets used.
Data Source Dataset Name # of Projects
cocomonasa_v1 60
coc81 63
desharnais_1_1
(updated version)
77
Promise
nasa93 93
sdr05 25
sdr06 24
SoftLab
sdr07 40
4.2 Model
Our proposed model is shown in Figure 1. Before
applying any method, all of the datasets are
normalized in order to remove scaling effects in
different dimensions by using Min-max
normalization.
Firstly, clustering algorithm is applied to the
normalized data to obtain project groups. Secondly,
with Principal Component Analysis (PCA), each
cluster’s dimensions are reduced individually by
using their own covariance matrices (Alpaydin,
2004). The aim here is to prevent data loss within
clusters while extracting relevant features. Thirdly,
each cluster is assigned a class label and the effort
intervals for each of them are determined. Then, the
effort data containing projects with corresponding
class labels is given to each of the classification
algorithms described in Section 3. Since there are
not separate training and test sets, the classification
process is done in a 10x10 cross-validation loop. In
the cross-validation loop, data is 10 times shuffled
into random order and then divided into 10 bins.
Training set is built from nine of the bins, and the
SOFTWARE EFFORT ESTIMATION AS A CLASSIFICATION PROBLEM
275
0
4
8
12
16
20
coc81 cocomonasa desharnais nasa93 sdr05 sdr06 sdr07
LD
KNN
DT
remaining bin is used as validation set.
Classification algorithms are firstly trained on the
training set and then error calculations are made by
using the validation set. The errors are collected
during 100 cross-validation iterations.
In order to make a comparison with other
studies, at the classification step, point estimates are
calculated for each classification method. For this
process, both mean and median of the effort values
of the projects that belong to the class found by each
classifier are taken (Sentas et al., 2003).
4.3 Accuracy Measures
In our experimental study, there are two types of
accuracy measures: (a) misclassification rate for
classification and (b) MMRE, MedianMRE, and
PRED (25) for point estimates. Misclassification rate
can be thought as the complement of the hit rate that
has been mentioned in interval prediction studies. In
order to say that a model performs well, MdMRE
and MMRE values should be low and PRED (25)
values should be high.
5 RESULTS AND DISCUSSION
The effort clusters created for each dataset and the
minimum and maximum numbers of projects
assigned to a cluster are given in Table 2.
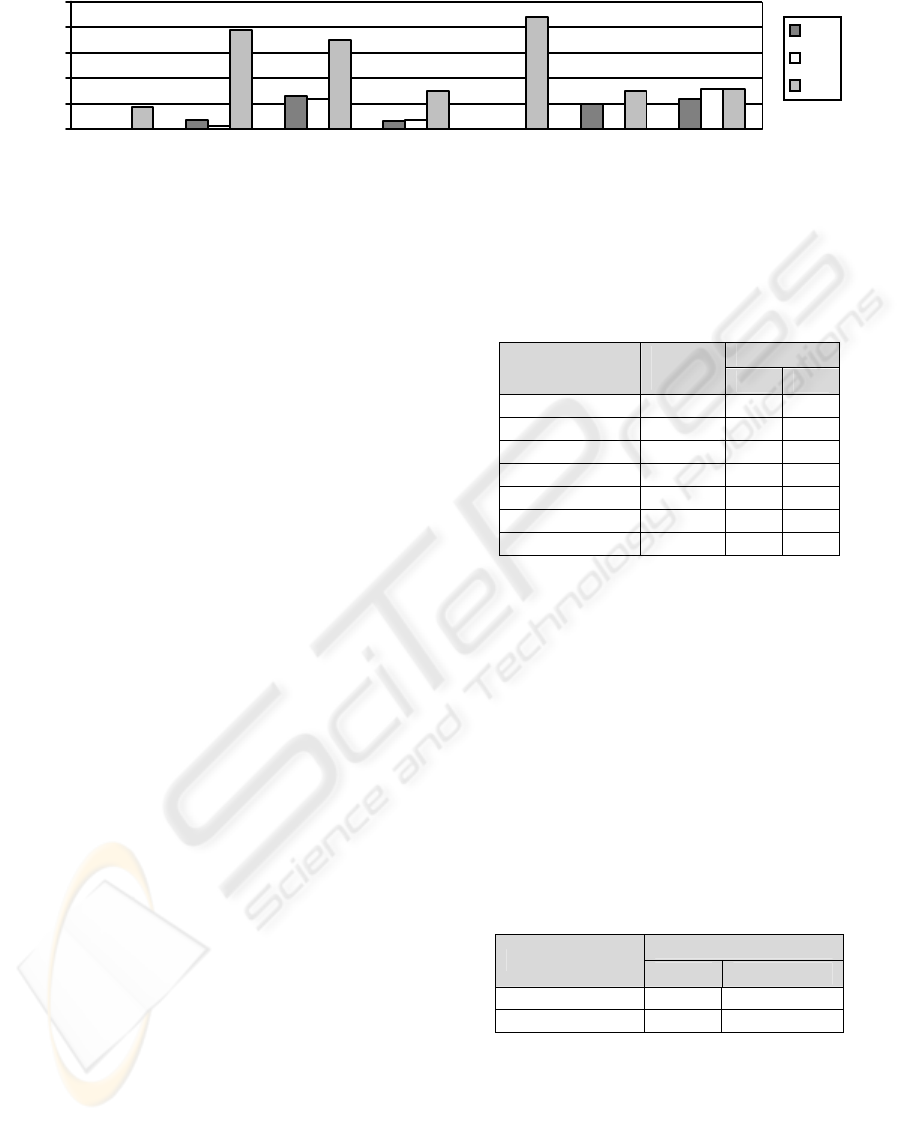
The classification results for effort interval
estimation are given in Figure 2. K-NN and LD
performs similar for coc81, desharnais_1_1, nasa93,
and sdr05. They both give 0% misclassification rate
for coc81 and sdr05. For cocomonasa_v1 and sdr06,
K-NN outperforms the others whereas for sdr07, LD
is the best one. In general, considering classifiers, K-
NN is the best performing one; LD follows it with a
slight difference whereas DT is the worst performing
one. The misclassification rates are 0% for most
cases and around 17% in the worst case.
The most recent study on effort interval
classification is Sentas et al.’s study. In Table 3 we
compare our results with that of Sentas et.al. Note
that the intervals in their study are manually pre-
defined intervals.
Table 2: Effort clusters for each dataset.
# of Projects
Dataset
# of
Clusters
Min Max
coc81
4 2 44
cocomonasa_v1
5 3 36
desharnais_1_1
9 2 21
nasa93
6 3 44
sdr05
3 3 16
sdr06
3 2 12
sdr07
4 6 16
In order to show how our results can be easily
converted to point estimates, in Table 4, we present
the point estimation results found by either taking
the mean or median of the projects’ effort values. K-
NN and LD perform nearly the same and better than
DT for all datasets. All classifiers’ performances
improve for all measures when median is used for
point estimation. MMRE and MdMRE results
decrease down to 13% and PRED results increase up
to 86% for some datasets. Note that an 86 % PRED
value means that 86% of all estimations are within
25% confidence interval, which shows the stability
and robustness of our proposed model.
Table 3: Comparison of the results.
Hit rate (%)
Min Max
Sentas et al.
60.38 79.24
Our model
97 100
6 CONCLUSIONS AND FUTURE
WORK
In this paper, we handle cost estimation as a
classification problem rather than a regression
Figure 2: Effort misclassification rates for each dataset.
ICSOFT 2008 - International Conference on Software and Data Technologies
276

Table 4: Point estimation results (%).
Using the mean of projects Using the median of projects
Dataset Classifier
MMRE MdMRE PRED MMRE MdMRE PRED
LD 189 183 33 131 131 33.6
K-NN 189 183 33 131 131 33.6
coc81
DT 192 190 29.6 134 131 30.2
LD 69 45 42.2 51 32 54.8
K-NN 69 45 42 51 32 54.6
cocomonasa_v1
DT 76 50 26.8 58 40 39.4
LD 13 12 84.14 13 12 86.42
K-NN 13 12 84.14 13 12 86.71
desharnais_1_1
DT 16 15 79 15 15 81.85
LD 70 52 55.5 52 40 57.7
K-NN 69 52 55.5 52 40 57.7
nasa93
DT 72 52 51.2 55 41 53.4
LD 45 28 45.5 37 26 52
K-NN 45 28 45.5 37 26 52
sdr05
DT 59 44 28.5 52 38 35
LD 31 31 50.5 25 23 67
K-NN 30 31 50.5 24 23 67
sdr06
DT 34 36 44.5 27 25 61
LD 14 14 84.66 14 14 79.6
K-NN 14 13 81.33 14 14 76.3
sdr07
DT 14 13 81.33 14 14 76.3
problem and propose an approach that classifies new
software projects in one of the dynamically created
effort classes each corresponding to an effort
interval. In the experiments done, we obtain higher
hit rates than other studies in the literature. For point
estimation results, we can see that MdMRE, MMRE,
and PRED (25) values are comparable to those in the
literature for most of the datasets although we use
simple methods like mean and median regression.
Future work includes using different clustering
techniques to find effort classes and to apply
regression-based models for point estimation.
ACKNOWLEDGEMENTS
This research is supported by Boğaziçi University
research fund under grant number BAP 06HA104
and the Turkish Scientific Research Council
(TUBITAK) under grant number EEEAG 108E014.
REFERENCES
Alpaydin, E., 2004. Introduction to Machine Learning,
MIT Press.
Angelis, L., Stamelos, I., 2000. A Simulation Tool for
Efficient Analogy Based Cost Estimation, Empirical
Software Engineering, 5, 35-68.
Bakar, Z. A., Deris, M. M., Alhadi, A. C., 2005.
Performance Analysis of Partitional and Incremental
Clustering, SNATI 2005.
Boehm B. W., 1981. Software Engineering Economics,
Prentice-Hall.
Boetticher, G., Menzies, T., Ostrand, T., 2007. PROMISE
Repository of Empirical Software Engineering Data,
http://promisedata.org/repository, West Virginia
University, Department of Computer Science.
Gallego, J. J. C., Rodriguez, D., Sicilia, M. A., Rubio, M.
G., Crespo, A. G., 2007. Software Project effort
Estimation Based on Multiple Parametric Models
Generated through Data Clustering, Journal of
Computer Science and Technology, 22 (3), 371-378.
Jorgensen, M., 2003. An Effort Prediction Interval
Approach Based on the Empirical Distribution of
Previous Estimation Accuracy, Information and
Software Technology, 45, 123-126.
Lee, A., Cheng, C. H., Balakrishnan, J., 1998. Software
Development Cost Estimation: Integrating Neural
Network with Cluster analysis, Information &
Management, 34, 1-9.
Leung, H., Fan, Z., 2002. Software Cost Estimation,
Handbook of Software Engineering and Knowledge
Engineering, Vol. 2, World Scientific.
Quinlan, J. R., 1993. C4.5: Programs for Machine
Learning, Morgan Kaufman.
Sentas, P., Angelis, L., Stamelos, I., 2003. Multinominal
Logistic Regression Applied on Software Productivity
Prediction, PCI 2003, 9
th
Panhellenic Conference in
Informatics, Thessaloniki.
Sentas, P., Angelis, L., Stamelos, I., Bleris, G., 2004.
Software Productivity and Effort Prediction with
Ordinal Regression, Information and Software
Technology, 47 (2005), 17-29.
SoftLab, Software Research Laboratory, Department of
Computer Engineering, Bogazici University,
http://softlab.boun.edu.tr
Stamelos, I., Angelis, L., 2001. Managing Uncertainty in
Project Portfolio Cost Estimation, Information and
Software Technology, 43(13), 759-768.
SOFTWARE EFFORT ESTIMATION AS A CLASSIFICATION PROBLEM
277
