
A Mental Health Self-Check System using Nonlinear
Analysis of Pulse Waves
Mayumi Oyama-Higa
1
, Kazuo Satoh
2
, Kazuyoshi Tanaka
3
and Takahiro Miyagi
4
1
Department of Integrated Psychological Science
Kwansei Gakuin University 1-1-155, Ichibancho, Uegahara
Nishinomiya-City, 662-8501, Japan
2
Chaous Technology Research Laboratory
3-1-2401, Ryodocho, Nishinomiya-City
662-0841, Japan
3
Research & Development Center
Hitachi Systems & Services, Ltd. 10-70, 2-Chome, Nanbanaka, Naniwa-ku
Osaka, 556-0011, Japan
4
Department of Computer Science
Shizuoka University, 3-5-1, Jyouhoku, Naka-ku
Hamamatsu-City, 432-8011, Japan
Abstract. Previously, we demonstrated that simple, low-cost measurement of
an individual’s mental health is possible using nonlinear analysis of pulse
waves. Here we introduce a trial system that records and assesses the relation-
ship between mental health and lifestyle habits. Our goal was to develop a sys-
tem that allows individuals to decide which steps to take for recovery when
they develop worrying mental health symptoms, by making comparisons to
their past lifestyle habits. This system also allows records of multiple individu-
als to be entered into a database and analyzed. Such analysis should allow for
the creation of indicators for general levels of mental health that may require
intervention, as well as the creation of more concrete, practical advice to aid re-
covery when worrying symptoms appear.
1 Introduction
In chaotic datasets, attractor plots and ‘divergence’ of attractor trajectories are charac-
terized by Lyapunov exponents. Previously, we focused on the Lyapunov exponent of
pulse waves in research targeting persons of various ages and in various situations [1-
4]. Our results showed that to maintain mental health, it is important that there is
harmony with the appropriate functioning of the sympathetic nervous system, which
is associated with qualities such as the ability to interact with the external environ-
ment and society, flexibility, spontaneity, and cooperation. We also learned that the
values representative of such harmony were associated with the maximum Lyapunov
exponent (MLE) obtained from nonlinear analysis [5, 6]. Essentially, in this research,
Oyama-Higa M., Satoh K., Tanaka K. and Miyagi T. (2008).
A Mental Health Self-Check System using Nonlinear Analysis of Pulse Waves.
In Proceedings of the 2nd International Workshop on e-Health Services and Technologies, pages 7-14
DOI: 10.5220/0001878900070014
Copyright
c
SciTePress

the MLE, which signifies temporal fluctuations in the attractor trajectory, is defined
as ‘divergence’, and while this value is continuously low, i.e., while there is no diver-
gence for a long period, adaptability to external factors in daily life decreases, and
mental health cannot be maintained. Conversely, a value that is continuously high for
a long period represents a continued state of extreme anxiety or stress, and again
mental health cannot be maintained. For humans, a healthy state can be defined as
one in which high and low divergence constantly alternate. Normal human life in-
cludes a wide range of emotions, and it is likely that this is exactly what causes
changes in divergence.
Using nonlinear analysis of pulse waves, an individual’s mental health can be meas-
ured in ~1 minute, i.e., the time it takes to perform a pulse-wave measurement, using
a low-cost pulse-wave sensor. This offers the potential for mental health to be easily
measured every day in the home or at work.
We created a trial version of our system using an easy-to-use self-check system to
regularly assess mental health at home or in the workplace, and to record these meas-
urements in combination with responses to questions on lifestyle habits.
Mental health changes from day to day and hour to hour, and it is most important to
monitor these fluctuations closely and intervene quickly when problematic symptoms
emerge. To this end, we proposed a self-check system using a graph in which the
degree of mental health over time is visualized as a constellation [7]. The system we
developed was designed so that changes could be tracked on the Mental Stress Ana-
lytical System (MSAS) from four perspectives, using constellation graphs and ques-
tionnaire records linked to pulse-wave data. In addition, because the system is in-
tended for use by non-specialists, it was designed so that a new user can use it at a
basic level, and then perform familiarization tasks direc*The preparation of manu-
scripts which are to be reproduced by photo-offset requires special care. Papers sub-
mitted in a technically unsuitable form will be returned for retyping, or canceled if the
volume cannot otherwise be finished on time.
2 System
2.1 Overall Configuration
Figure 1 shows the state to measure the pulse wave of the time series obtained for the
touch of the pulse wave mouse. It measures it for 60 seconds. The gain of the wave
height can be operated. It is displayed and it is possible to measure it again when the
measurement is bad in the gap of the finger etc.
Figure 2 shows the overall configuration of the trial MSAS.
8
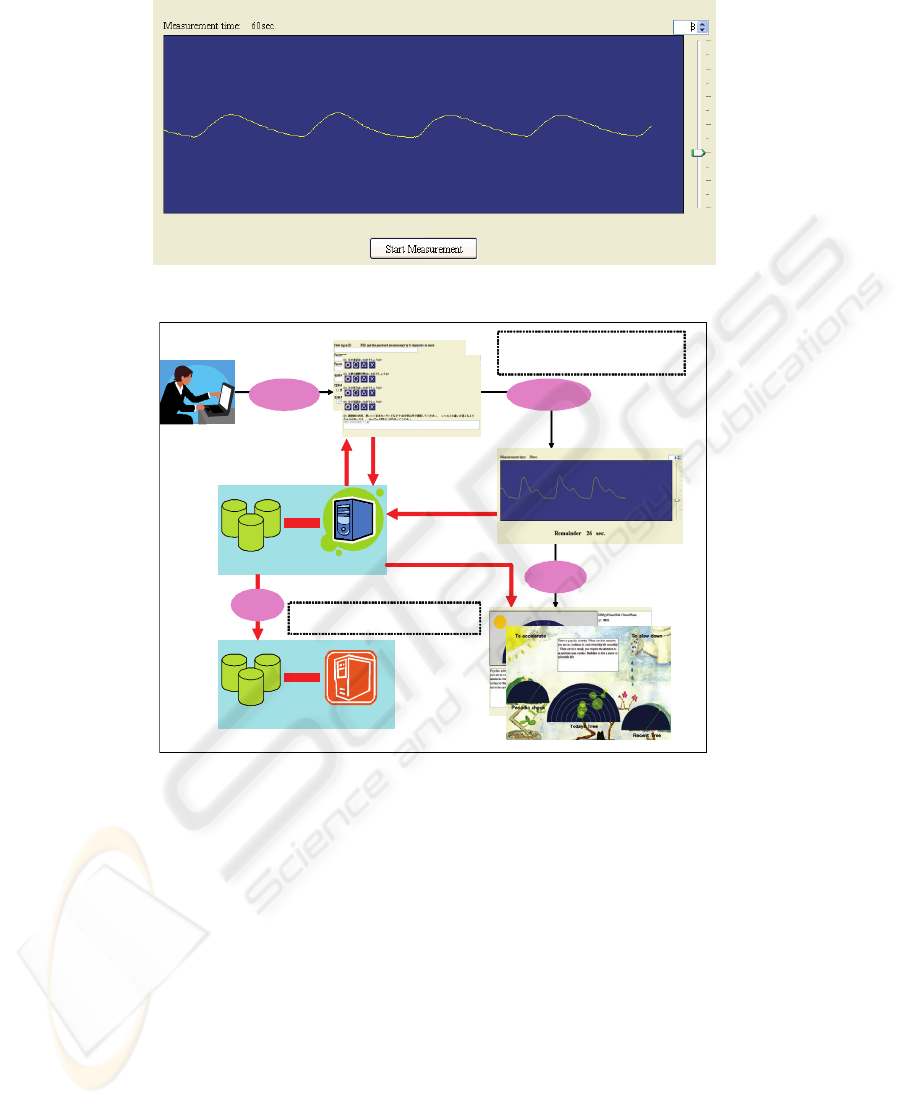
Fig. 1. The state to measure pulse waves using the pulse wave mouse.
1.Checkup
questions
2.Measurement
Research server
Individual PC
Databases
Databases
3.Display
Copies of data stored in PC databases are
sent to research server database
Individual attributes
& checkup questions tables
Responses
Pulse-wave data
Measured pulse-wave data is sent to PC,
Lyapunov exponent is calculated and
stored in database.
Mental health
& checkup questions data
4.Copy
Fig. 2. Overall configuration of the MSAS.
The configuration is explained below in terms of the data flow.
1. When starting the MSAS, a questionnaire specification preloaded on the per-
sonal computer (PC) database is sent to the PC, and based on this specifica-
tion, users are asked questions about their individual attributes, and every
time a pulse-wave measurement is taken, they are asked check-up questions.
The answers are stored in the PC database. The questionnaire can be de-
signed for a sample population, such as the elderly or a specific company.
2. Pulse-wave measurement data are stored in the PC database in advance, and
pulse-wave measurements from a mouse with a pulse-wave sensor attached
are sent to the PC. The PC calculates the Lyapunov exponent value indica-
tive of mental health from the pulse-wave data and, together with the pulse-
9

wave measurement information, sends this to the database where both are
stored.
3. The check-up questions data stored on the internal PC database and the men-
tal health calculation obtained simultaneously are both displayed on the PC
as constellation graphs showing time series data from three perspectives. Us-
ers can also combine and display data freely. Looking at this display, users
can check for any worrying symptoms related to mental health and can plan
their own recovery based on changes in data on past check-up questions. In
addition, with this trial MSAS, the assessment of changes in mental health
can be used to derive basic advice on self-recovery methods for the general
population.
4. Copies of the data in each database are sent to a research server database and
stored. The research database will accumulate data sent from researchers all
over the country, and analysis of these data should enable the creation of in-
dicators for the level of general mental health that may require intervention,
as well as the creation of more specific, practical advice to aid recovery
when worrying symptoms appear.
Although the trial version uses the configuration described above, it can also be im-
plemented as a self-contained PC model without sending duplicate data to the re-
search database, or as an internet-based model that uses a server database directly,
instead of a PC database. A mobile phone or specialist device could be used instead
of a PC, and in anticipation of this, the software was written mainly in Java and de-
signed to be highly adaptable to cross-platform migration.
2.2 Flow of The MSAS System Use
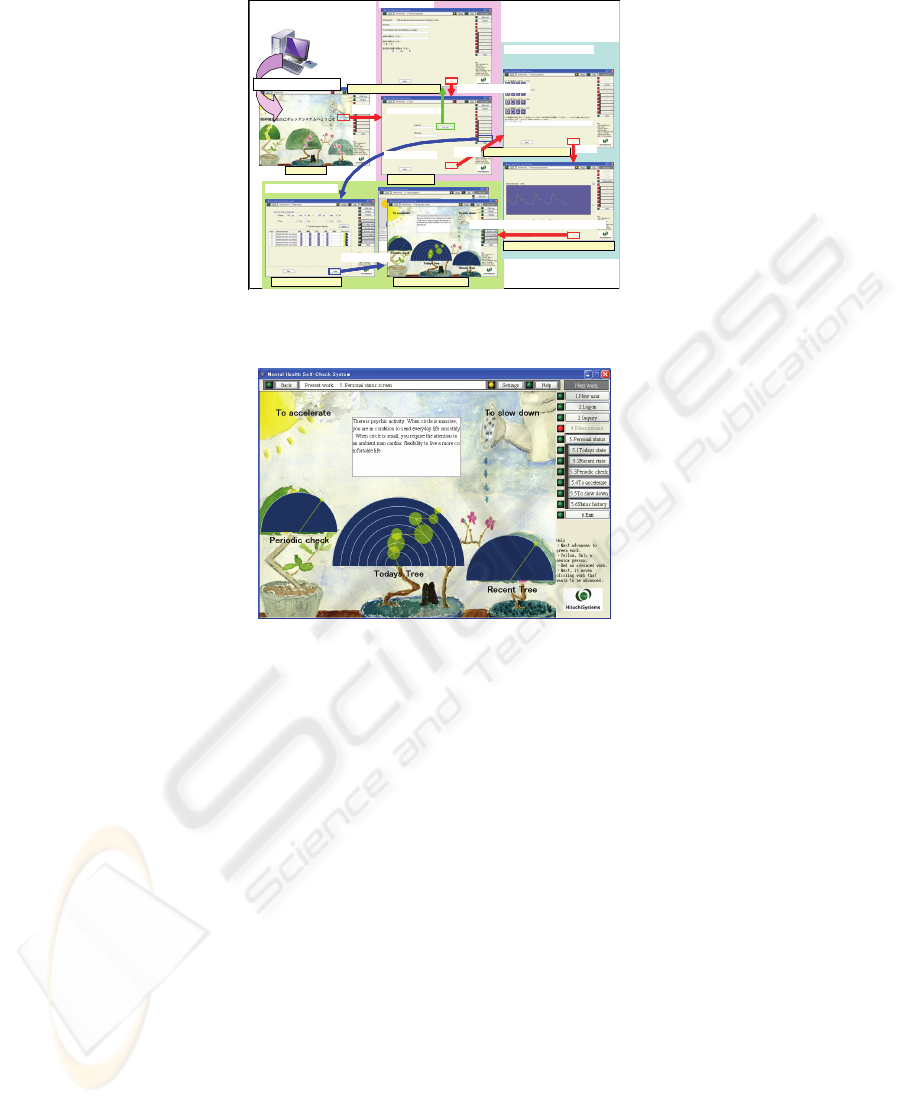
Figure 3 shows the steps followed by a first-time system user. Since the NEXT button
can be clicked to proceed when a process has finished, the design allows a first-time
user to work through the screens simply by pressing NEXT. With increased familiar-
ity, the user can use short-cuts by selecting green items on the menu at the right of
each screen to jump to a new screen directly.
1. As indicated by the red lines in Figure 3, after starting the MSAS and enter-
ing the user ID and password, the check-up questions screen appears, and the
user’s current physical condition or worries can be recorded. Then, the
pulse-wave is measured. When a normal pulse-wave is not measured, such as
when the finger moves, a request to repeat the measurement appears during
the measurement process.
2. This completes the most basic self-check, and the MSAS is normally termi-
nated by clicking the ‘x’ at the top right or the ‘Finish’ menu option on the right.
For advanced users, we have provided convenient advanced features that allow users
to edit information or to change the system parameters for different users by clicking
on settings menus at the top right of each screen. In addition, using the ‘Status His-
tory’ menu, users can freely select up to seven data items from the record of past
measurements and can create a constellation graph. This enables the users to perform
self-checks and self-management from a unique perspective. The blue lines in Figure
3 illustrate these steps.
10
ID management
Pulse-wave measurement
Checkup q uestions screen
First screen
Log-in screen
Pulse-wave measurement screen
Status history screen Personal status screen
Log-in
Graph display
NEXT
After measurement finished, click NEXT
Mental health display
New user registration screen Registration finished
NEXT
MSAS system startup
New registration
History search
First screen
Log-in screen
Pulse-wave measurement screen
Status history screen Personal status screen
Log-in
Graph display
NEXT
After measurement finished, click NEXT
Mental health display
New user registration screen Registration finished
NEXT
MSAS system startup
New registration
History search
Fig. 3. Overview of the MSAS system use from the user’s viewpoint, excluding research work-
flow.
Fig. 4. Individual status screen.
3 Concept
Our objectives in creating the MSAS system are explained below.
1. Our main priority was to enable people to decide for themselves what
steps to take for a more definite self-recovery when worrying mental
health symptoms arise, by referring to their lifestyle habits. If it is possi-
ble to ascertain what kind of day-to-day conditions bring about high and
low divergence, mental health can be maintained.
2. Another important point is that for research purposes, the records of mul-
tiple individuals can be entered into a database and analyzed. Such
analysis should enable the creation of indicators for the level of mental
health in general that may require intervention, as well as the creation of
more specific, practical advice to aid recovery when worrying symptoms
appear.
3. It was important that people wishing to maintain their mental health from
day to day could use the system easily, without the need for an instruc-
tion manual.
11
4. Since many users will be elderly, we wanted to create a system that con-
sidered the needs of the elderly as much as possible.
Regarding objective 1, our approach in developing this system is explained below,
with reference to Fig. 3 and Fig. 4. These figures show three constellation graphs at
the bottom of the screen, represented as bonsai trees. From left to right, these graphs
are the ‘Periodic Check-up Tree,’ ‘Today’s Tree,’ and ‘Recent Tree,’ and together
they show mental health trends over time from three different perspectives: the ‘Peri-
odic Check-up Tree’ shows yearly changes, ‘Today’s Tree’ shows today’s change
over time, and the ‘Recent Tree’ shows daily changes at the same time (specifically,
within 3 hours before or after a specific time) over recent days.
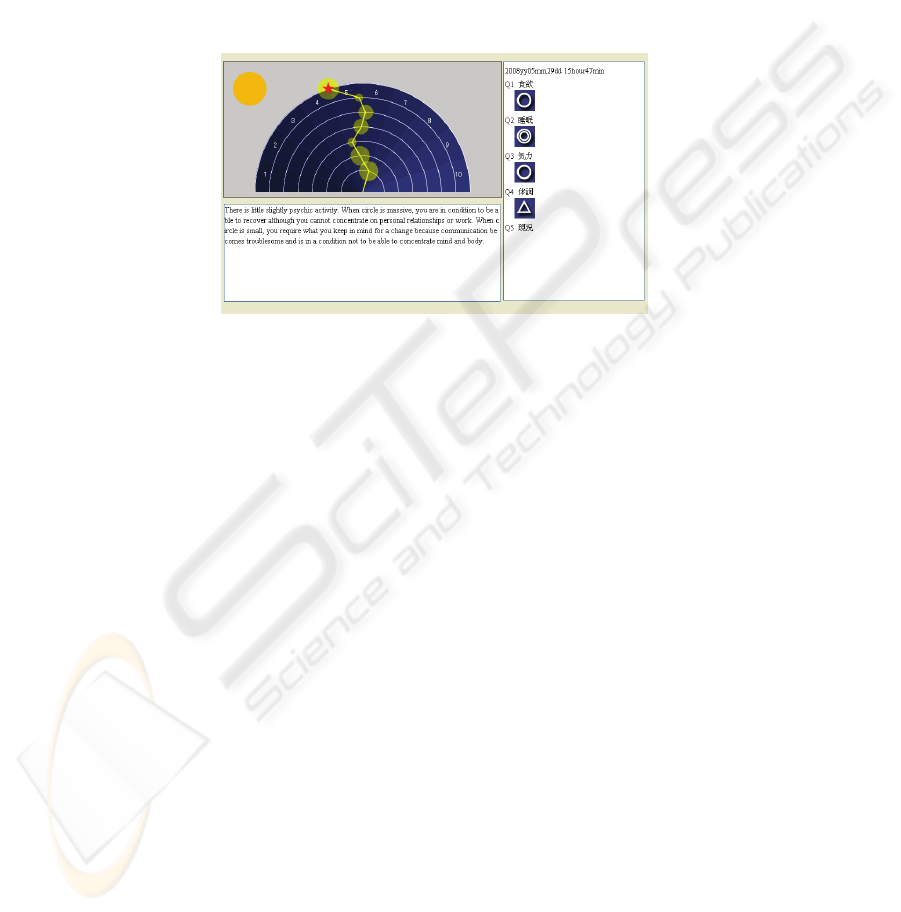
Fig. 5. In the example constellation graph, clockwise movement represents high divergence,
counterclockwise movement represents low divergence. This graph shows seven separate
measurements simultaneously. The small circle represents the standard deviation and when the
cursor is placed in the center, the check-up questions display changes on the right.
The method of creating the constellation graph is explained briefly below. In a pulse-
wave measurement, which lasts 1 minute, the Lyapunov exponent of the time series is
calculated at 43 points. With a maximum Lyapunov exponent value of 10.0 set as 180
degrees and minimum value of 0.0 set as 0 degrees, the average and standard devia-
tion r of these 43 measurements are calculated, converted to respective angles, and
displayed as vectors on the constellation graph. To display measurements from n
occasions, the radius of the main semicircle is first divided into n equal parts. Then,
taking the meeting points between vectors and small circles as origin points, of which
there are n, each with radius r/n, these circles of radius r/n are written, and the
Lyapunov exponent values are converted into angles and drawn as vectors. By con-
necting the vectors and small circles, the pattern shown in Fig.5 is obtained.
For this system, we have also added a circle to the left of the constellation graphs in
Fig.5. This is called the reference circle, and is intended for comparison to the con-
stellation graph circles, to give an idea of what a normal standard deviation should be.
This reference circle is averaged from the standard deviations of many individuals,
and will continue to be revised as more data are accumulated.
Returning to the beginning, in the usage scenario of the constellation graphs shown in
Fig. 4, ‘Today’s Tree’ is used to investigate the best time of day to perform a self-
check. This task will tell users whether they are morning, daytime, or evening persons.
Employed individuals should perform the survey separately for work days and holi-
12

days. This process will inform users of what time of day the check should be per-
formed. Users will continue accumulating data by using the MSAS at the same time
of day every day, and this gradual build-up of data will become visible in the ‘Recent
Tree.’ When worrying symptoms appear, the MSAS issues a warning message, but
this does not constitute a problem if users regain equilibrium in 2 or 3 days. Con-
versely, a lifestyle that habitually offers the experience of well-defined emotions will
lead to large swings to the left and right, but on becoming accustomed to these swings,
recovery of equilibrium will be swift. This is how strong mental health is developed.
On the other hand, in a lifestyle that habitually suppresses the normal range of emo-
tions, recovering from a single swing to one side tends to be rather difficult. Finally,
the ‘Periodic Check-up Tree’ is used once a year to show year-to-year variation.
Regarding objective 2, below we describe an implementation designed for multiple
researchers in different locations. Data on each researcher’s PC is sent to an adminis-
trator located at a research server, who then enters a copy of the data into the research
database. Data in the research database can be accessed only by a specified researcher
with a user ID and password.
Objective 3 is realized by enabling first-time users to follow an extremely simple set
of steps, performing the most basic check simply by pressing NEXT after each screen.
To achieve objective 4, we adopted a large font in the MSAS, as recommended from
the perspective of accessibility.
4 Discussion
Using MSAS, individuals can perform self-checks for mental health and can also self-
manage. If it is possible to ascertain what kind of day-to-day conditions bring about
high and low divergence, mental health can be maintained. We are also confident that
if self-management no longer becomes possible, and the individual consults a coun-
selor or psychiatrist, this system can aid in the early detection of depression or de-
mentia, or prevent further deterioration of mental health. Furthermore, we think the
ability to send and receive data related to mental health indicators across networks
constitutes an unprecedented innovation in communication. However, it is essential to
take great care in data management in light of the issue of confidentiality, which has
become important in recent years. To deal with this issue, the trial version incorpo-
rates two layers of user ID and password control: one at MSAS log-in and one at
database log-in. In the commercial version, we plan to further enhance protection by
using data encryption.
In developing the MSAS for practical use, we hope to make the following improve-
ments, taking advantage of the anticipated accumulation of large amounts of informa-
tion.
4.1 Establishing a More Objective Evaluation Framework
When data have been obtained from a large population, divergences in mental health
(radial angle on the constellation graph) and the amplitude of the standard deviation
13

(reference circle) can be averaged to obtain the normal divergence and normal varia-
tion (standard deviation). In addition, with sufficient data, normal values can be ob-
tained for specific populations, such as those differentiated by age and sex. By com-
paring these normal values to the divergence and standard deviation of the MSAS
user, it should be possible to indicate the presence of worrying symptoms with greater
objectivity on the MSAS.
4.2 Creation of More Practical Advice
When worrying symptoms are detected, self-management will become easier for
users if the MSAS can create practical advice on the best measures to take. With each
pulse-wave measurement, responses to check-up questions are paired with the users’
individual attributes, and the condition of the users at the time of measurement is
included with these answers. Therefore, by analyzing large amounts of accumulated
data, correspondences can be made between pulse-wave measurement data and the
users’ condition across various contexts. Using this information, it should be possible
for the MSAS to offer more practical advice to suit each individual. In addition, we
are confident that the accumulation of large amounts of information will be useful in
the future in various kinds of pulse-wave research.
References
1. Oyama-Higa, M., Miao T., Mizuno-Matsumoto, Y. (2006) Analysis of dementia in aged
subjects through chaos analysis of fingertip pulse waves, 2006 IEEE Conference on
Systems, Man, and Cybernetics 2006, Taipei, Taiwan, 2863-2867.
2. Miao, T., Shimoyama, O., Oyama-Higa, M. (2006) Modelling plethysmogram dynamics
based on baroreflex under higher cerebral influences, 2006 IEEE Conference on Systems,
Man, and Cybernetics 2006, Taipei, Taiwan, 2868-2873.
3. Imanishi, A., Oyama-Higa, M. (2006) The relation between observers’
psychophysiological conditions and human errors during monitoring task, 2006 IEEE
Conference on Systems, Man, and Cybernetics 2006, Taipei, Taiwan, 2035-2039.
4. Oyama-Higa, M., Tsujino, J., Tanabiki, M. (2006) Does a mother’s attachment to her child
affect biological information provided by the child? Chaos analysis of fingertip pulse
waves of children, 2006 IEEE Conference on Systems, Man, and Cybernetics, Taipei,
Taiwan, 2030-2034.
5. Oyama-Higa, M., Miao, T. (2005) Representation of a physio-psychological index through
constellation graphs, ICNC’05-FSKD’05, http://dx.doi.org/10.1007/11539087_109.
6. Oyama-Higa, M., Miao T. (2006) Discovery and application of new index for cognitive
psychology, 2006 IEEE Conference on Systems, Man, and Cybernetics 2006, Taipei,
Taiwan, 2040-2044.
7. Oyama-Higa, M., Miao, T., Sato, K., Tanaka K., Cheng, H. (2007) Development of a self-
check system for mental health using a pulse wave mouse, ICSOFT 2007, The 3
rd
International Conference on Software and Data Technologies.
14
