
USER GUIDANCE OF RESOURCE-ADAPTIVE SYSTEMS
João Pedro Sousa
Computer Science Department, George Mason University, 4400 University Drive, Fairfax VA, U.S.A.
Rajesh Krishna Balan
School of information Systems, Singapore Management University, 80 Stamford Road, Singapore
Vahe Poladian, David Garlan, Mahadev Satyanarayanan
Computer Science Department, Carnegie Mellon University, 5000 Forbes Avenue, Pittsburgh PA, U.S.A.
Keywords: Mobile Computing, Resource Adaptation, Self-adaptive Systems, Software Architecture.
Abstract: This paper presents a framework for engineering resource-adaptive software systems targeted at small
mobile devices. The proposed framework empowers users to control tradeoffs among a rich set of service-
specific aspects of quality of service. After motivating the problem, the paper proposes a model for
capturing user preferences with respect to quality of service, and illustrates prototype user interfaces to elicit
such models. The paper then describes the extensions and integration work made to accommodate the
proposed framework on top of an existing software infrastructure for ubiquitous computing.
The research question addressed here is the feasibility of coordinating resource allocation and adaptation
policies in a way that end-users can understand and control in real time. The evaluation covered both
systems and the usability perspectives, the latter by means of a user study. The contributions of this work
are: first, a set of design guidelines for resource-adaptive systems, including APIs for integrating new
applications; second, a concrete infrastructure that implements the guidelines. And third, a way to model
quality of service tradeoffs based on utility theory, which our research indicates end-users with diverse
backgrounds are able to leverage for guiding the adaptive behaviors towards activity-specific quality goals.
1 INTRODUCTION
Sophisticated software is increasingly being
deployed on small mobile devices, taking advantage
of their growing capabilities and popularity. Media
streaming is already found frequently in PDAs and
high-end cell phones. Soon, applications such as
speech recognition, natural language translation, and
virtual/augmented reality may leap from research
prototypes to widespread commercial use.
While software has enjoyed plentiful and stable
resources in the world of desktops (and to some
extent, of laptops,) resource variation needs to be
taken into account in smaller devices. Despite the
impressive capabilities of today’s mobile devices,
user expectations with respect to performance and
sophistication will continue to be set by the full-size
versions running on powerful desktops and servers.
Research in resource-adaptive applications takes
an important step towards addressing resource
limitation and variation (De Lara, Wallach, &
Zwaenepoel, 2001; Flinn & Satyanarayanan, 1999;
Yuan, Nahrstedt, Adve, Jones, & Kravets, 2006).
However, existing solutions either enforce
predetermined policies, or offer limited mechanisms
to control the application’s policies. In some cases,
the adaptation mechanisms focus strictly on network
conditions, enforcing policies that are established by
system designers before the system is deployed. In
other cases, users are offered limited control over the
policies, typically focusing on a single aspect of
quality of service, such as battery duration.
Unfortunately, those limitations prevent adaptive
systems from addressing two important issues. First,
user goals often entail tradeoffs among different
aspects of quality. For example, in the presence of
limited bandwidth, should a web browser skip
36
Pedro Sousa J., Krishna Balan R., Poladian V., Garlan D. and Satyanarayanan M. (2008).
USER GUIDANCE OF RESOURCE-ADAPTIVE SYSTEMS.
In Proceedings of the Third International Conference on Software and Data Technologies - SE/GSDCA/MUSE, pages 36-44
DOI: 10.5220/0001881500360044
Copyright
c
SciTePress

loading pictures in order to provide faster load
times? For browsing restaurant listings, a user may
prefer dropping images to improve load times; but
for browsing online driving directions, the user may
be willing to wait longer for the full page content.
Second, user activities may involve more than
one application, making it desirable to coordinate
resource usage and adaptation policies across
applications. For example, an activity that involves
simultaneous video streaming and downloading
email attachments may be best served when video
streaming consistently uses 80% of the bandwidth
and email does not attempt to go beyond 20%.
This paper presents a framework for engineering
resource-adaptive systems that: (a) empower users to
control tradeoffs among a rich set of aspects of
quality, and (b) coordinate resource usage among
several applications. To develop such a framework,
important questions need to be answered: how to
represent user preferences in a way that can be used
to guide adaptation policies? How to elicit such
preferences? How to allocate resources among
applications, and how to coordinate their policies?
What APIs must applications expose to be amenable
to such coordination?
In the remainder of this paper, Section 2
proposes a model for capturing user preferences with
respect to quality of service, and illustrates prototype
user interfaces to elicit such models. The
implementation of the proposed framework builds
on an existing infrastructure for ubiquitous
computing (Garlan, Siewiorek, Smailagic, &
Steenkiste, 2002), which is summarized in Section 3.
Section 4 describes the extensions and integra-
tion work we made to accommodate the proposed
framework on top of the existing infrastructure.
Specifically, these extensions include: (a) interaction
protocols for coordinating resource allocation and
adaptation policies; and (b) guidelines for the
integration of adaptive applications into the
proposed framework.
Section 5 summarizes the evaluation of the
proposed solution from a systems perspective, and
describes a preliminary evaluation of usability, by
means of a user study. The results of the study
indicate that end-users with diverse backgrounds can
understand and use the proposed models of quality
of service to control the adaptive behavior of
applications towards specific goals.
Section 6 discusses related work, and Section 7
summarizes the main points of this paper.
2 USER PREFERENCES
Any adaptation or optimization process is guided by
a goal. In the case of adapting to resources in small
mobile devices, the goal is to optimize the quality of
service (QoS) perceived by the user. Work in this
area frequently addresses conserving resources, such
as battery charge, but that is just one way to
optimize for service duration, an aspect of QoS.
The conceptual framework that we adopt takes
into account that:
(1) Users may care about tradeoffs between
different aspects of QoS; e.g., latency vs. accuracy.
(2) Different services may be characterized by
different aspects of QoS. For example, for web
browsing, users may care about load times and
whether the full content is loaded (e.g., pictures); for
automatic translation, users may care about the
response time and accuracy of translation; for
watching a movie, users may care about the frame
rate and image quality.
(3) User preferences for the same service may
depend on the user’s activity. For example, a user
may prefer high frame rate over image quality for
watching a sports event over a network connection
with limited bandwidth, but might prefer the
opposite for watching a show on sculpture.
However, important questions cannot be
answered with this approach: for instance, how short
of a response time will satiate the user? And even if
accuracy is less important, what if it degrades so
much that the translations become unusable?
At the other end of the spectrum, preferences
may be expressed as an arbitrary function between
the multivariate quality space and a utility space
representing user happiness. For instance, the user
might indicate that he would be happy with medium
translation accuracy, as long as latency remains
under 1 second, and that he will be happy to wait 5
seconds for highly accurate translations. Although
fully expressive, designing mechanisms to elicit this
form of preferences from end-users is a hard
problem, and even more so if more than two aspects
of QoS are involved.
The model we propose sits between these two
extremes. User preferences are expressed as
independent utility functions for each aspect, or
dimension, of QoS. Such functions map the possible
quality levels in the dimension to a normalized
utility space U Þ [0,1], where the user is happy with
utility values close to 1, and unhappy with utility
values close to zero.
USER GUIDANCE OF RESOURCE-ADAPTIVE SYSTEMS
37
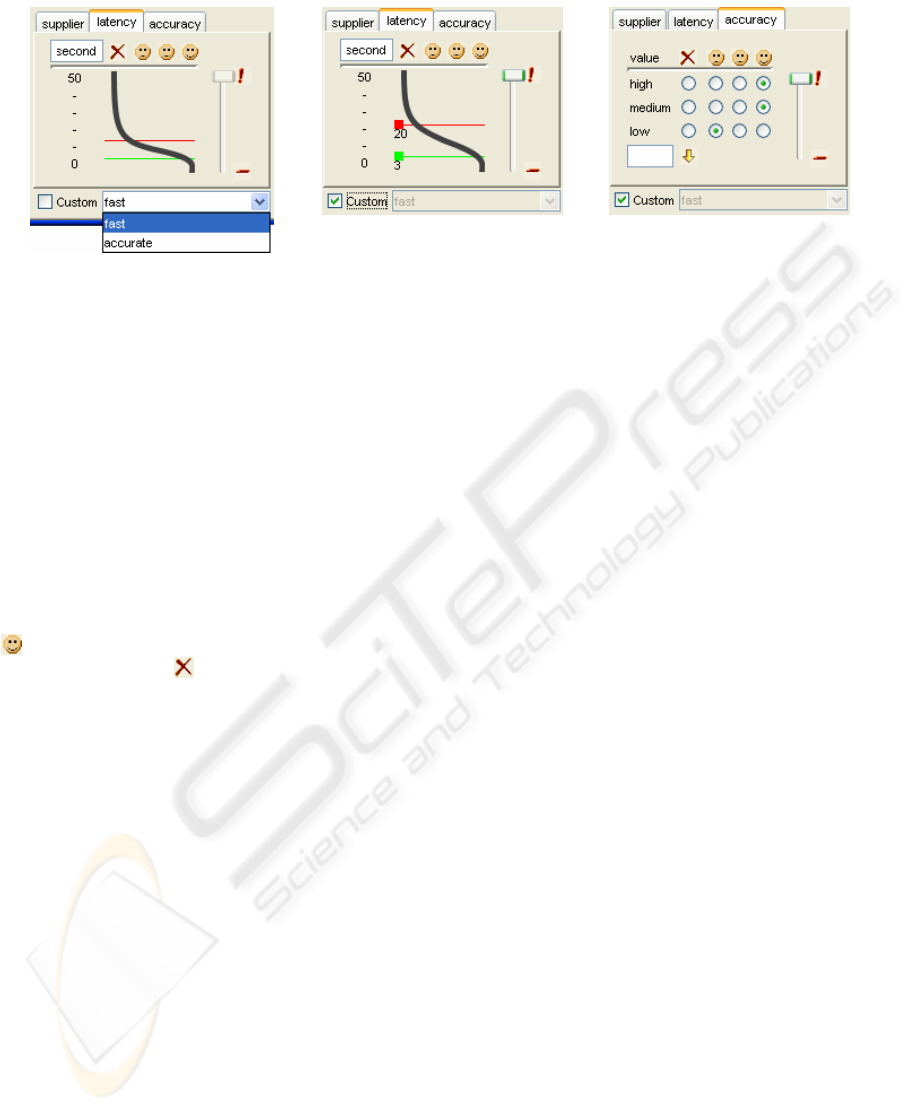
Figure 1: QoS preferences for a language translation service.
For each continuous QoS dimension the user
indicates two values: the thresholds of satiation and
of starvation. For example, the user might be happy
with response times anywhere under 3 second, but
may not accept response times over 20 seconds.
This is illustrated in
Figure 1b, where the thresholds
of satiation and starvation are represented by the
green (lighter) and red (darker) lines, respectively.
Currently, we use sigmoid functions to smoothly
interpolate between these two zones, the thresholds
marking the knees of the sigmoid. The utility
corresponding to each value of latency is indicated
by the scale at the top, ranging from a happy face
(
) for values beyond the satiation threshold, all the
way down to a cross (
), representing rejection, for
values beyond the starvation threshold.
Preferences for discrete QoS dimensions are
represented using a discrete mapping to the utility
space.
Figure 1c shows an example where a table
indicates the utility of each level of accuracy.
The functions for each aspect of QoS are then
combined by multiplication, which corresponds to
an and semantics: a user is happy with the overall
result only if he is happy with the quality along each
and every dimension. Whenever a user task in-
volves more than one service, the overall utility
combines the QoS dimensions for all the services.
The relative importance of each aspect, modeled
as a weight w∈[0,1], is factored into the combined
utility. For example, for two aspects a and b, the
combined utility function is
ba
w
b
w
a
uu .
. These weights
take the value 1 by default, but may be altered using
the slider bars on the right side in
Figure 1a-c.
To make it easier to use this model, we include
the notion of preference templates. This decision is
based on the principle of offering incremental
benefit for incremental effort, also known as gentle
slope systems (Myers, Smith, & Horn, 1992).
Figure
1a shows an example with two templates, fast and
accurate. If a template is selected, the associated
preferences are shown. In case a user wishes to fine-
tune these preferences, he may do so after selecting
the custom checkbox (
Figure 1b-c).
3 ARCHITECTURE BASELINE
The models of preferred QoS tradeoffs described in
Section 2 can be leveraged using two alternative
architectural strategies. Either individual applica-
tions are responsible for capturing and managing the
models, or the features required to do so are factored
out into a common infrastructure.
The latter approach has significant advantages in
terms of reuse. In addition to promoting the reuse
(avoiding replication) of code to support those
features across applications, there is also the reuse of
the knowledge about user preferences. For example,
once the preferred QoS tradeoffs for watching a
specific video stream are elicited from the user, that
knowledge resides with the infrastructure and can be
passed to the streaming application running on the
device that happens to be convenient to the user at
each moment: a cell phone, a laptop, etc.
Therefore, the architectural strategy we adopted
is to define a software infrastructure that: (a)
captures models of QoS tradeoffs, (b) coordinates
the resource usage across the applications supporting
the user’s activity, if more than one is involved, and
(c) enables those applications to dynamically adjust
their adaptation policies based on the QoS models.
Rather than building such an infrastructure from
scratch, we extended an existing infrastructure
developed at Carnegie Mellon’s Project Aura, which
targets user mobility in ubiquitous computing
environments (Sousa, 2005). The remainder of this
(a) (b) (c)
ICSOFT 2008 - International Conference on Software and Data Technologies
38
section summarizes the Aura infrastructure, as well
as an existing library for resource adaptation,
Chroma, also related to Project Aura (Balan, Gergle,
Satyanarayanan, & Herbsleb, 2005).
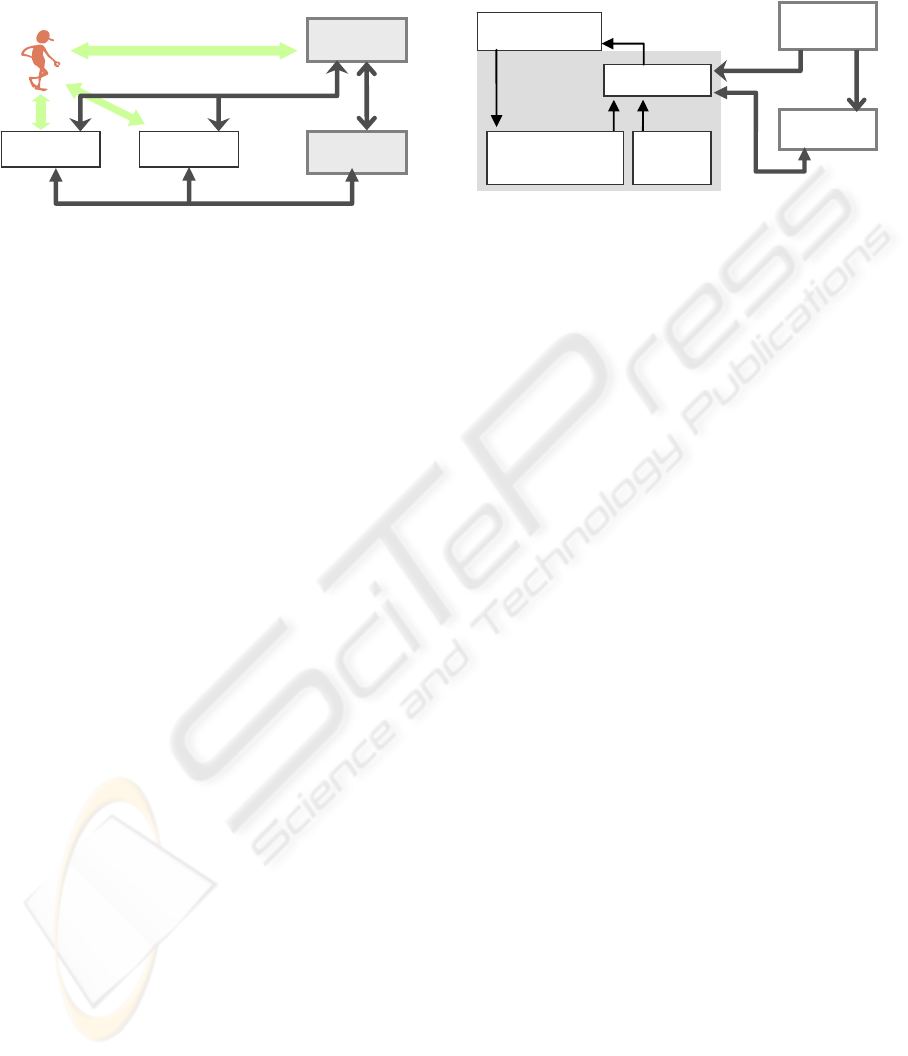
Figure 2: The Aura infrastructure.
Aura supports a high-level notion of user
activities, such as preparing presentations or writing
film reviews. Such tasks may involve several
services. For instance, for preparing a presentation,
a user may edit slides, refer to a couple of papers on
the topic, check previous related presentations, and
browse the web for new developments.
Figure 2 shows a component and connector view
of the Aura infrastructure. The Prism component
captures and maintains models of user activities.
Specifically, each model enumerates the services
required to support the activity, how those services
are interconnected, if at all, preferences with the
respect to the kinds of applications to provide each
service (e.g., Emacs as opposed to vi for editing
text,) and service-specific settings.
The Environment Manager (EM) component
keeps track of the availability of services within an
environment. An environment in Aura refers to the
set of devices, software components and other
resources accessible to a user at a particular location.
Whenever a user indicates that he or she whishes
to start or resume an activity, Prism communicates
the corresponding activity model to the EM using
the service request protocol (SRP), and the two
components negotiate the configuration that best
supports the user’s needs and preferences. Once an
agreement is reached, the EM communicates with
the applications using the service announcement and
activation protocol (SAAP) to activate the services
and make the required interconnections, if any. After
that it passes a model of the concrete configuration
up to Prism (SRP). Prism uses this model to
communicate with the applications using the service
use protocol (SUP) and recover the preferred
settings for the activity; for example, the point at
which the user was previously watching a video.
The Aura connectors (SAAP, SRP, and SUP),
support the asynchronous exchange of XML
messages over TCP/IP. These are peer-to-peer
protocols, where each component may initiate
communication, as needed.
Figure 3: Integration of Chroma.
Figure 3: Integration of Chroma.
Chroma enables conventional applications to be
enhanced for adaptation, provided the applications
can carry out their operations using different tactics.
For example, a speech recognizer may have more
costly algorithms that deliver better results, or
simpler algorithms that demand fewer resources.
Additionally, Chroma supports the partitioning of
applications, shipping and running heavy
computations in remote servers when the available
resources, such as bandwidth, favor that option.
Chroma includes generic, application-independ-
ent parts: a Solver, a resource demand predictor, and
a number of resource monitors. The latter include
history-based monitors of available bandwidth,
battery charge, CPU and memory, both on the local
device and on remote servers (Narayanan, Flinn, &
Satyanarayanan, 2000). The resource demand
predictor forecasts the resource demand of each
tactic based on historical averages of actual demand.
The Solver determines the tactic with the highest
utility, given the available resources, by exhaustive
evaluation of all the tactics defined for the
application. The Solver is invoked by the applica-
tion before carrying out each unit of work; for
example, before recognizing each utterance, in the
case of speech recognition, or before rendering each
frame, in the case of virtual reality applications.
Figure 3 shows these parts and their interactions:
the thin arrows within Chroma represent information
flow as a result of method calls.
4 IMPLEMENTATION
The research in this paper involved extending the
Prism and EM components in Aura, as well as
integrating Chroma with the Aura protocols and with
the QoS models described in Section 2.
Prism
EM
SRP
app 1 app N
SAAP
…
SUP
UI
Chroma
Prism
adaptive app
Solver
rsrc availability rsrc
resource demand
predictor
resource
monitors
EM
rsrc
p
rofiles
/
allocation
QoS models
rsrc usage
settin
g
s
USER GUIDANCE OF RESOURCE-ADAPTIVE SYSTEMS
39

Figure 6: Example resource allocation.
The Aura protocols were also extended to
include the flow of QoS models to the EM, over the
SRP, and to Chroma, over the SUP; as well as the
flow of resource information between the EM and
Chroma, over the SAAP. These flows are
represented as thicker arrows in Figure 3,
corresponding to the protocols in
Figure 2.
Prism is now in charge of capturing and
disseminating QoS models.
Figure 1 illustrates the
interfaces for eliciting user preferences for a service
with two aspects of QoS: latency (response time)
and accuracy. These models are disseminated to
other components in the format illustrated in Figure .
The use of XML as opposed to language-specific
data structures makes the models easier to exchange
between components written in different languages.
Prism creates user interfaces like the one in
Figure 1
dynamically, based on the QoS dimensions and
values in the XML representation of a model.
The EM is now in charge of determining and
disseminating the optimal resource allocations
among the applications supporting the user’s
activity. Figure 6 shows an example of resource
constraints that the EM may send to one application
via the SAAP. To determine those, the EM receives
(a) resource profiles via the SAAP, Figure , relating
the quality levels that each application can operate at
with the corresponding resource demands. (b) QoS
models via the SRP, Figure ; and (c) forecasts of
resource availability, which, unlike fine-grained
forecasts for adaptive applications, contain averages
over a large number of historical samples. Optimal
allocation uses an efficient global optimization
algorithm, which was published as a separate
research result (Anonymous, 2006).
Chroma is in charge of supporting the adaptation
policies within each application. Architecturally,
adaptive applications are built on top of the Chroma
library, and there is one instance of Chroma,
customized with application-specific tactics,
deployed with each application. Integrating such
applications involved wrapping them to mediate
between the Aura protocols and the Chroma APIs.
Since Chroma expects a generic utility function for
the Solver, plugging in a function that interprets the
QoS models passed via the SUP (Figure ) was fairly
straightforward.
5 EVALUATION
The proposed framework was evaluated both from
the systems and from the usability perspectives.
From the systems perspective, we verified that
the proposed solution makes optimal adaptation
decisions, and that it does so efficiently, that is,
quickly and without consuming significant resources
itself. (Balan, Satyanarayanan, Park, & Okoshi,
2003) tested Chroma running language translation
and speech and face recognition applications on a
PDA under a wide range both of available resources
and of user preferences. These tests verified that the
Solver consistently picks the tactic that delivers the
highest utility under the available resources.
In (Anonymous, 2006) we evaluated the
efficiency of EM’s resource allocation running on a
1.6 GHz CPU with 512 MB of RAM. The latency
of finding the optimal allocation is 200 ms on
average (standard deviation 50 ms) for configura-
tions requiring from 1 to 4 services, when 4 to 24
alternative suites of application are available to
provide those services, and when the search space of
combined QoS levels reaches up to 15,000 points.
Reevaluating the resource allocation every 5s, the
<utility combine="product">
<QoSdimension name="latency" type="int">
<function type="sigmoid" weight="1">
<thresholds good="3" bad="20"
unit="second"/>
</function>
</QoSdimension>
<QoSdimension name="accuracy" type="enum">
<function type="table" weight="1">
<entry x="high" f_x="1"/>
<entry x="medium" f_x="1"/>
<entry x="low" f_x="0.3"/>
</function>
</QoSdimension>
</utility>
Figure 4: Representation of the preferences in Figure 1.
<service type="speechRecognition”>
<QoSprofile>
<QoSdim name="latency" type="float"/>
<QoSdim name="accuracy" type="enum"/>
<head>latency accuracy cpu bdwdth</head>
<units>second none % Kbps</units>
<point> 0.05 low 30 250</point>
<point> 0.05 high 80 250</point>
<point> 0.1 low 20 200</point>
<point> 0.1 high 75 200</point>
</QoSprofile>
</service>
Figure 5: Example QoS profile.
<constraints>
<rsrc id="cpu" avg="30" var="10" u="%"/>
<rsrc id="bdwdth" avg="800" var="100"
u="Kbps"/>
</constraints>
ICSOFT 2008 - International Conference on Software and Data Technologies
40
EM uses on average 3% of CPU cycles. The
optimality of decisions was verified analytically.
The remainder of this section focuses on the
evaluation of usability. For that, three criteria were
considered: the expressiveness of the QoS models,
the ease of eliciting them, and the ease of using them
to control adaptation. With respect to expressive-
ness, our experience with multiple examples, some
illustrated in the user study described below,
indicate that the proposed models are expressive
enough for a wide range of practical situations.
A user study investigated whether end-users can
express their preferences and control adaptation
using the proposed QoS models.
This study consists of using a natural language
translator running on a mobile device. The quality
of translation observed by users varies, since the
translator runs either simple algorithms locally, or
more sophisticated ones on a remote server,
depending on the availability of bandwidth and of
capacity in the server. To prevent limitations in the
capabilities of the actual translation application
(limited dictionaries, etc.) from affecting the results
of the study, we replaced a human for the remote
translation server. This technique is well accepted
and known as a Wizard of Oz experiment.
The study focused on answering the following
questions: first, can users understand and use
templates to achieve a goal? Second, can users think
of and manipulate preferences in terms of
thresholds? Third, do they find it easy? And fourth,
can users interpret the effects of specifying different
preferences in the application’s adaptive behavior?
The participants were drawn from a population
with homogeneous education level and age group,
but diverse technical background. Ten students in
the age group 18-29 were drawn among the
respondents to a posting, 5 of which from
computing-related fields (computer science,
electrical and computer engineering, logic) and the
remaining 5 from other fields (business, physics,
literature). Incidentally, 6 were male and 4 female.
Participants individually performed an
experiment that lasted 30 minutes, after being given
a 30 minute introduction to the experiment,
methodology and tools. Participants were asked to
follow the think aloud protocol (Steinberg, 1991),
and their voice and actions on the screen were
recorded using video capturing software
(TechSmith). After the experiment, the participants
completed a short questionnaire.
The scenario for the experiment revolved around
a conversation with a foreign language speaker
(Spanish in this case) aided by translation software.
To prevent serious misunderstandings in a real
situation, users of the translation software would be
able to check the accuracy of translation by having
the Spanish translation translated back to English
and spoken (using speech synthesis) on the user’s
earphones. Users would press a go-ahead button to
synthesize the Spanish translation only if they were
happy with the accuracy of translation.
During the experiment, participants were asked
to input sentences of their own making, listen to the
output of the double translation, and rate the
accuracy. The training included calibrating the
participants' rating of accuracy using the following
scale: high, if the meaning is fully preserved;
medium, if the meaning is roughly preserved; and
low, if the meaning is seriously distorted.
Participants were asked to pursue different QoS
goals during each part of a three-part experiment.
Within each part, we simulated resource variation
and asked the participants to evaluate the changes
both in latency and accuracy of translation. During
the first two parts, the QoS goals could be satisfied
by preference templates. During the third part, the
specific goal could only be achieved by customized
preferences. The participants were not directed as to
whether or not to use templates in any case.
0
2
4
6
8
10
12345
0
2
4
6
8
10
12 3 4 5
(a) Templates (b) Thresholds
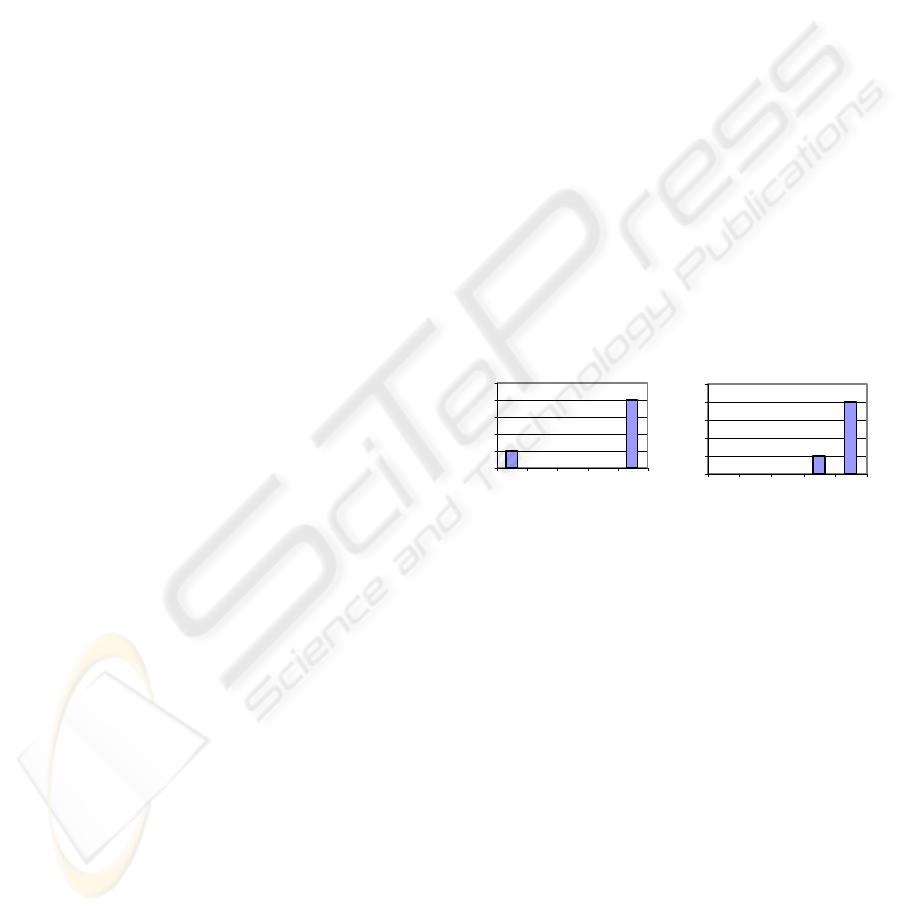
Figure 7: Likert scale evaluation of preferences’
specification (5-fully favorable, to 1-unfavorable).
Whenever the QoS goals could be met by a
template, the participants did use templates in 17 out
of 20 cases. In the remaining 3 instances, the
participants were still able to achieve the goals using
customized preferences. When asked about the
clarity and usefulness of templates, 8 participants
were fully favorable, while 2 didn’t recognize a
benefit in having templates – see Figure 7a.
All 10 participants were able to manipulate the
thresholds in customized preferences for achieving
the required QoS goals. Specifically, the experiment
was set in such a way that the thresholds in one
dimension needed to be made stricter, while relaxing
the other dimension, under penalty of the goal not
being achievable.
When asked about the clarity of using thresholds
to specify preferences, 8 participants were fully
favorable, while 2 thought some alternative strategy
USER GUIDANCE OF RESOURCE-ADAPTIVE SYSTEMS
41

could be preferable – see Figure 7b. One of these
participants suggested that an X-Y representation the
tradeoff might be clearer. However, there are two
reasons why that may not be such a good idea. First,
it would be hard to show and manipulate tradeoffs
with more than two aspects of QoS. Second, the
actual tradeoff changes with the availability of
resources: with plentiful resources, high levels may
be attainable along all aspects; but with low
resources, to privilege one aspect may have a severe
impact on others.
The participants were able to interpret the effects
of different preferences in the application’s adaptive
behavior. To verify this, we tested the hypothesis
that when resources change participants perceive a
change in the QoS, with a greater impact along the
QoS dimension for which the preferences are laxer.
For that, after each translation the participants
evaluated which QoS dimension changed the most
relative to the previous translation: a noticeable
change in accuracy with similar latencies, a
noticeable change in latency with similar accuracies,
no noticeable changes, etc. Participants then related
those changes with the strictness or laxness of the
preferences along each QoS dimension. The
participants were not informed of when or in which
direction resources would change.
Figure 8: Regression performed on experiment data.
Figure 8 shows the results of correlating which
dimension had stricter preferences with which
dimension was perceived to have changed the most.
The correlation coefficient is negative, meaning that
whenever user preferences were stricter along one
dimension, the participants perceived a greater
fluctuation on the other dimension (caused by
underlying resource fluctuations). When asked
about how easy it was to use the interfaces in
Figure
1 to customize preferences, 5 participants were fully
favorable while the other 5 thought the interfaces
could be improved.
This user study demonstrates that end-users can
both define their preferences, and interpret the
results of such definitions in the system’s adaptive
behavior. A control loop is therefore formed,
enabling users to pursue concrete QoS goals. The
practicality of the control loop is confirmed by the
fact that all participants were easily able to achieve
concrete QoS goals.
6 RELATED WORK
Similarly to the proposed framework, others have
leveraged techniques from microeconomics to elicit
utility with respect to multiple attributes. In the
Security Attribute Evaluation Method (SAEM), the
aggregate threat index and the losses from successful
attacks are computed using utility functions (Butler,
2002). The Cost Benefit Analysis Method (CBAM)
uses a multidimensional utility function with respect
to QoS for evaluating software architecture alterna-
tives (Moore, Kazman, Klein, & Asundi, 2003). Our
work is different from SAEM and CBAM in that it
is geared towards mobile computing.
A body of work addressed battery duration in
mobile devices. For example (Yuan et al., 2006),
presented OS extensions that coordinate CPU
operation, OS scheduling, and media rendering, to
optimize device performance, given user preferences
concerning battery duration. The QoS models in our
framework are significantly more expressive, since
they support a rich vocabulary of service-specific
aspects of QoS.
User studies done in mid-to-late 1990s have
demonstrated that stability (e.g., absence of jitter) is
more important than improvement for certain
aspects of QoS (Wijesekera, Varadarajan, Parikh,
Srivastava, & Nerode, 1998). Our framework recog-
nizes the importance of these results and ensures, by
explicit resource allocation, that adequate resources
are available for applications to provide service
while maximizing the overall utility.
Dynamic resolution of resource allocation policy
conflicts involving multiple mobile users is
Correlation Coefficient t-value Significant at 95%
-0.6 -4.27 Yes
How to interpret a correlation: the correlation
coefficient denotes the slope of the line that best fits the
data. A positive/negative coefficient means that an
increase in the x-axis corresponds to an increase/decrease
in the y-axis. If the coefficient is zero, the data cannot be
approximated by a straight line (there is no correlation
between the x values and the y values).
Student's t-test of significance: indicates the
likelihood that the correlation in the data sample
corresponds to a real correlation in the general
population. A commonly accepted threshold is 95%
confidence. Statistics manuals contain tables of t-
statistics for each size of the data sample. The t-test
consists of comparing the t-value calculated for the
correlation with the lookup t-statistic. If the absolute t-
value is larger than the t-statistic, then the correlation is
significant with 95% certainty.
Sample: 40 data points relating two variables (38
degrees of freedom), for which the t-statistic is 2.024 for a
95% confidence.
ICSOFT 2008 - International Conference on Software and Data Technologies
42

addressed in (Capra, Emmerich, & Mascolo, 2003)
using sealed bid auctions. While this work shares
utility-theoretic concepts with our configuration
mechanisms, the problem we solve is different. Our
work has no game-theoretic aspects and addresses
resource contention by multiple applications
working for the same user on a small mobile device.
From an analytical point of view, closest to our
resource allocation algorithm are Q-RAM (Lee,
Lehoczky, Siewiorek, Rajkumar, & Hansen, 1999),
Knapsack algorithms, and winner determination in
combinatorial auctions. By integrating with generic
service discovery mechanisms in the EM, our work
provides an integrated framework for service
discovery, resource allocation and adaptation.
7 CONCLUSIONS
Resource adaptation can play an important role in
improving user satisfaction with respect to running
sophisticated software on small mobile devices.
However, today, many applications implement
limited solutions for resource adaptation, or none at
all. The primary reasons for that are: (a) the cost of
creating ad-hoc adaptation solutions from scratch for
each application; and (b) the difficulty of
coordinating resource usage among the applications.
Because it is hard for an individual application to
even know which other applications are actively
involved in supporting a user activity, individual
applications frequently trample each other in their
quest for resources.
This paper proposes a framework for resource
adaptation where a number of features are factored
out of applications into a common infrastructure.
First, user preferences with respect to overall
QoS tradeoffs are elicited by an infrastructural
component such as Prism. These models are
expressed using a rich vocabulary of service-specific
QoS aspects. Furthermore, a preliminary user study
indicates that end-users can understand and leverage
these models to pursue concrete QoS goals.
Second, resource allocation among applications
is coordinated by another infrastructural component
such as the EM. This component receives QoS
profiles from applications, and efficiently computes
the resource allocations that optimally support the
QoS goals, given forecasts of available resources for
the next few seconds.
Third, adaptation to resource variations at a time
granularity of milliseconds is facilitated by a
common library, such as Chroma. This library saves
application development costs by providing common
mechanisms for (a) monitoring available resources,
(b) profiling the resource demands of alternative
computation tactics, and (c) deciding dynamically
which tactic best supports the QoS goals, given
resource forecasts for the next few milliseconds.
Additionally, this paper clarifies concrete APIs
that adaptive applications need to support for being
integrated into the framework. These APIs are
realized as XML messages, which may be
exchanged within the mobile device, or across the
network, if the infrastructural components are
deployed remotely.
In summary, the proposed framework makes it
easier to develop and integrate applications into
coordinated, resource-adaptive systems.
Furthermore, our research indicates that end-
users with diverse backgrounds are able to control
the behavior of such systems to achieve activity-
specific QoS goals.
REFERENCES
Balan, R. K., Gergle, D., Satyanarayanan, M., & Herbsleb,
J. (2005). Simplifying Cyber Foraging for Mobile
Devices (Tech. Report No. CMU-CS-05-157R).
Pittsburgh, PA: Carnegie Mellon University.
Balan, R. K., Satyanarayanan, M., Park, S., & Okoshi, T.
(2003). Tactics-Based Remote Execution for Mobile
Computing. Paper presented at the USENIX Intl
Conference on Mobile Systems, Applications, and
Services (MobiSys), San Francisco, CA.
Butler, S. (2002). Security Attribute Evaluation Method. A
Cost-Benefit Approach. Paper presented at the Intl
Conf in Software Engineering (ICSE), Orlando, FL.
Capra, L., Emmerich, W., & Mascolo, C. (2003).
CARISMA: Context-Aware Reflective mIddleware
System for Mobile Applications. IEEE Transactions
on Software Engineering, 29(10), 929-945.
De Lara, E., Wallach, D., & Zwaenepoel, W. (2001).
Puppeteer: Component-based Adaptation for Mobile
Computing. Paper presented at the USENIX
Symposium on Internet Technologies and Systems
(USITS), San Francisco, CA.
Flinn, J., & Satyanarayanan, M. (1999). Energy-aware
Adaptation for Mobile Applications. ACM SIGOPS
Operating Systems Review, 33(5), 48-63.
Garlan, D., Siewiorek, D., Smailagic, A., & Steenkiste, P.
(2002). Project Aura: Toward Distraction-Free
Pervasive Computing. IEEE Pervasive Computing,
1(2), 22-31.
Lee, C., Lehoczky, J., Siewiorek, D., Rajkumar, R., &
Hansen, J. (1999). A Scalable Solution to the Multi-
Resource QoS Problem. Paper presented at the IEEE
Real-Time Systems Symposium (RTSS).
Moore, M., Kazman, R., Klein, M., & Asundi, J. (2003).
Quantifying the Value of Architecture Design
USER GUIDANCE OF RESOURCE-ADAPTIVE SYSTEMS
43

Decisions: Lessons from the Field. Paper presented at
the Intl Conf on Software Engineering (ICSE),
Portland, OR.
Myers, B., Smith, D., & Horn, B. (1992). Report of the
‘End-User Programming’ Working Group. In B.
Myers (Ed.), Languages for Developing User
Interfaces (pp. 343-366). Boston, MA: Jones and
Barlett.
Narayanan, D., Flinn, J., & Satyanarayanan, M. (2000).
Using History to Improve Mobile Application
Adaptation. Paper presented at the 3rd IEEE
Workshop on Mobile Computing Systems and
Applications (WMCSA).
Poladian, V., Sousa, J. P., Garlan, D., & Shaw, M. (2004,
May). Dynamic Configuration of Resource-Aware
Services. Paper presented at the 26th International
Conference on Software Engineering, Edinburgh, UK.
Sousa, J. P. (2005). Scaling Task Management in Space
and Time: Reducing User Overhead in Ubiquitous-
Computing Environments (Tech. Report No. CMU-
CS-05-123). Pittsburgh, PA: Carnegie Mellon
University.
Steinberg, E. (Ed.). (1991). Plain language: Principles and
Practice. Detroit, MI: Wayne State University Press.
TechSmith. Camtasia Studio. Retrieved March, 2008,
from www.techsmith.com
Wijesekera, D., Varadarajan, S., Parikh, S., Srivastava, J.,
& Nerode, A. (1998, April). Performance evaluation
of media losses in the Continuous MediaToolkit.
Paper presented at the Intl Workshop on Multimedia
Software Engineering (MSE), Kyoto, Japan.
Yuan, W., Nahrstedt, K., Adve, S., Jones, D., & Kravets,
R. (2006). GRACE-1: Cross-Layer Adaptation for
Multimedia Quality and Battery Energy. IEEE
Transactions on Mobile Computing, 5(7), 799-815.
ICSOFT 2008 - International Conference on Software and Data Technologies
44
