
FORMATIVE USER-CENTERED USABILITY EVALUATION OF
AN AUGMENTED REALITY EDUCATIONAL SYSTEM
Costin Pribeanu, Alexandru Balog and Dragoş Daniel Iordache
ICI Bucharest, Bd. Mareşal Averescu Nro. 8-10, Bucureşti, Romania
Keywords: User-centered design, usability, formative usability evaluation, augmented reality, e-learning.
Abstract: The mix of real and virtual requires appropriate interaction techniques that have to be evaluated with users
in order to avoid usability problems. Formative usability aims at finding usability problems as early as
possible in the development life cycle and is suitable to support the development of novel interactive
systems. This work presents an approach to user-centered evaluation of a Biology scenario developed on an
Augmented Reality educational platform. The evaluation has been carried on during and before a summer
school held within the ARiSE research project. The basic idea was to perform usability evaluation twice. In
this respect, we conducted user testing with a small number of students during a summer school in order to
get a fast feedback from users having good knowledge in Biology. Then, we repeated the user testing in
different conditions and with a relatively larger number of representative users. In this paper we describe
both experiments and compare the usability evaluation results.
1 INTRODUCTION
The development of Augmented Reality (AR)
systems is challenging designers with new
interaction paradigms seeking to take advantage by
the broad range of possibilities in mixing real and
digital environments. Real objects became part of
the interaction space thus being used as versatile
interaction objects which are playing various roles.
Despite the proliferation of AR-based applications
there is still a lack of both specific user-centered
design methods and usability data (Bach & Scapin,
2004; Coutrix and Nigay, 2006).
AR systems are expensive and require a lot of
research and design effort to develop visualization
and rendering software. On another hand, the mix of
real and virtual requires appropriate interaction
techniques. According to Gabbard et al. (2004), AR
interaction components are often poorly designed,
thus reducing the usability of the overall system.
Formative usability testing is performed in an
iterative development cycle and aims at finding and
fixing usability problems as early as possible
(Teofanos and Quesenbery, 2005). The earlier these
problems are identified, the less expensive is the
development effort to fix them. This kind of
usability evaluation is called “formative” in order to
distinguish from “summative” evaluation which is
usually performed after a system or some component
has been developed (Scriven, 1991). Summative
usability evaluation is carried on by testing with a
relatively large number of representative users and
aims at finding strengths and weaknesses as well as
comparing alternative design solutions or similar
systems.
Formative usability evaluation can be carried on
by conducting an expert-based usability evaluation
(sometimes termed as heuristic evaluation) and / or
by conducting user testing with a small number of
users. In this last case, the evaluation is said to be
user-centered, as opposite to expert-based formative
evaluation. As Gabbard et al. (2004) pointed out,
this kind of user-based statistical evaluation can be
especially effective to support the development of
novel systems as they are targeted at a specific part
of the user interface design.
This paper aims at presenting an approach
undertaken to the user-centered formative usability
evaluation of an interaction scenario for AR-based
educational systems developed in the framework of
the ARiSE (Augmented Reality for School
Environments) research project.
The main objective of the ARiSE project is to
test the pedagogical effectiveness of introducing AR
in schools and creating remote collaboration
between classes around AR display systems. ARiSE
will develop a new technology, the Augmented
Reality Teaching Platform (ARTP) in three stages
thus resulting three research prototypes. Each
65
Pribeanu C., Balog A. and Daniel Iordache D. (2008).
FORMATIVE USER-CENTERED USABILITY EVALUATION OF AN AUGMENTED REALITY EDUCATIONAL SYSTEM.
In Proceedings of the Third International Conference on Software and Data Technologies - ISDM/ABF, pages 65-72
DOI: 10.5220/0001883000650072
Copyright
c
SciTePress
prototype is featuring a new application scenario
based on a different interaction paradigm.
The first prototype implemented a Biology
learning scenario for secondary schools. The
implemented paradigm is 3D process visualization
and is targeted at enhancing the students’
understanding and motivation to learn the human
digestive system.
In order to get a fast feedback from both teachers
and students, each prototype is tested with users
during the ARiSE Summer School which is held
yearly. From each school, one teacher and 4 students
(2 boys and 2 girls) are participating that are selected
by the teacher based on their communication skills
including English language speaking, and
knowledge in the target discipline. Given this
selection criteria, they are not so representative for
the user population.
A first version of the Biology scenario has been
developed in 2006 and tested with users during the
1
st
ARiSE Summer School which has been held in
Hamrun, Malta. Since the usability evaluation
results were not satisfactory, the interaction
techniques have been re-designed and tested again
during the 2
nd
ARiSE Summer School in October
2007 which has been held in Bucharest, Romania.
The basic idea of our approach was to conduct
user testing during the summer school in order to get
a fast feedback from users having good knowledge
in Biology and to repeat the user testing in different
conditions and with a relatively larger number of
representative users. This actually means to perform
formative evaluation in two stages and to analyze
and compare results.
During experiments, effectiveness and efficiency
measures have been collected in a log file. Then a
usability questionnaire has been administrated that is
providing with both quantitative and qualitative
measures of the educational and motivational values
of the new learning scenario.
The rest of this paper is organized as follows. In
the next section we present the usability evaluation
results from the 2
nd
ARiSE summer school. Then we
present the results of the usability evaluation which
has been carried on after the summer school with
students from two Romanian classes, each one from
a different school. In the same section, we compare
and discuss the similarities and differences between
the evaluation results of both experiments. The
paper ends with conclusion and future work in
section 4.
2 EVALUATION DURING THE
SUMMER SCHOOL
2.1 Context of Use
The 2
nd
ARiSE summer school has been held in
Bucharest on 24-28 October 2007. Two groups of 4
students and two teachers from German and
Lithuanian partner schools together with three
groups of 4 students accompanied by a total of 4
teachers from 3 general (basic) schools in Bucharest
participated to the summer school.
Testing and debriefing with users has been done
in the morning while the afternoon has been
dedicated for discussion between research partners.
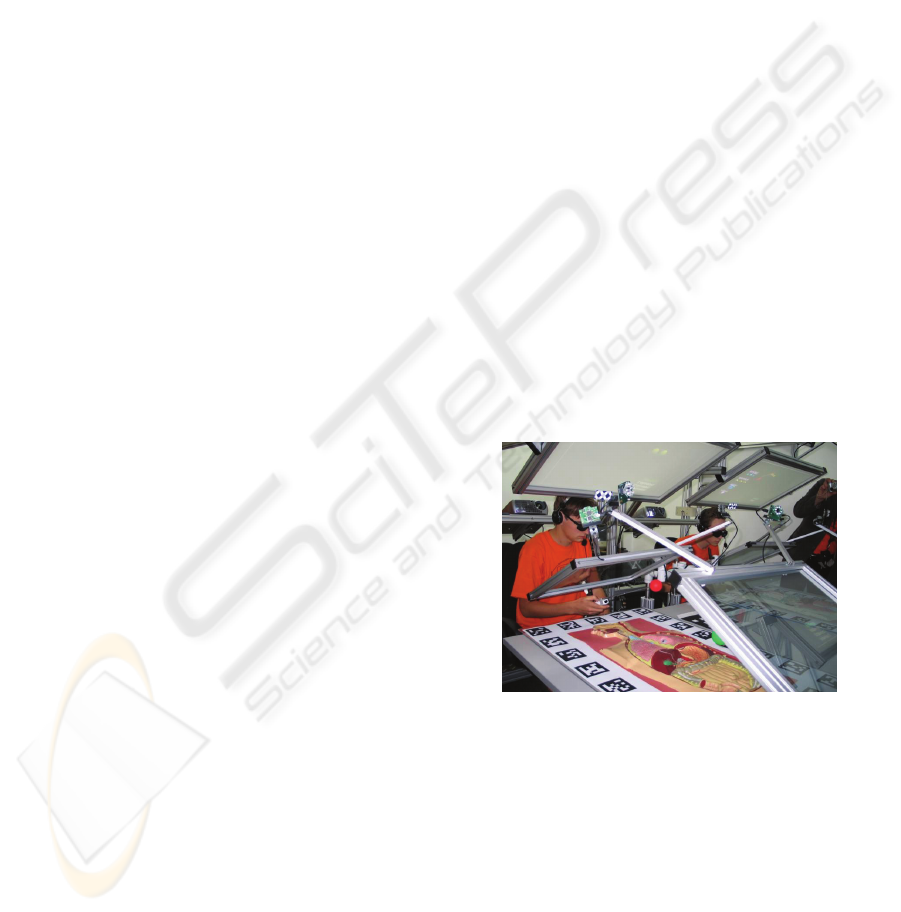
2.1.1 Equipment
ARTP is a “seated” AR environment: users are
looking to a see-through screen where virtual images
are superimposed over the perceived image of a real
object placed on the table (Wind & Bogen, 2007). In
our case, the real object is a flat torso of the human
body showing the digestive system.
The test has been conducted on the platform of
ICI Bucharest. The real object and the pointing
device could be observed in Figure 1. As it could be
observed, two students staying face-to-face are
sharing the same torso.
Figure 1: Students testing the Biology scenario.
A pointing device having a colored ball on the
end of a stick and a remote controller Wii Nintendo
as handler has been used as interaction tool that
serves for three types of interaction: pointing on a
real object, selection of a virtual object and selection
of a menu item.
2.1.2 Participants and Tasks
20 students from which 10 boys and 10 girls tested
the platform. None of the students was familiar with
the AR technology. 12 students were from 8
th
class
ICSOFT 2008 - International Conference on Software and Data Technologies
66
(13-14 years old), 4 from 9
th
class (14-15 years old)
and 4 from 10
th
class (15-16 years old). Students
have different ages because of the differences related
to the curricula in each country.
The participants have been assigned 4 tasks: a
demo program explaining the absorption /
decomposition process of food and three exercises:
the 1
st
exercise asking to indicate the organs of the
digestive system and exercises 2 and 3, asking to
indicate the nutrients absorbed / decomposed in each
organ respectively the organs where a nutrient is
absorbed / decomposed.
The tasks as well as user guidance during the
interaction are presented via a vocal user interface in
the national language of students.
2.2 Method and Procedure
2.2.1 Measuring Usability
The ISO standard 9241-11 (1994) takes a broader
perspective on usability as the extent to which a
product can be used by specified users to achieve
specified goals effectively, efficiently and with
satisfaction in a specified context of use.
In order to meet the ARiSE project goals we
took a broader view on usability evaluation. A well
known model aiming to predict technology
acceptance once users have the opportunity to test
the system is TAM – Technology Acceptance Model
(Davis et al., 1989). TAM theory holds that use is
influenced by user’s attitude towards the technology,
which in turn is influenced by the perceived ease of
use and perceived usefulness. As Dillon & Morris
(1998) pointed out, TAM provides with early and
useful insights on whether users will or will not
accept a new technology.
TAM is nowadays widely used as an information
technology acceptance model. TAM has been tested
to explain or predict behavioral intention on a
variety of information technologies and systems,
such as: word processors, spreadsheet software,
email, graphics software, net conferencing software,
online shopping, online learning, Internet banking
and so on (Venkatesh et al., 2007).
A usability questionnaire has been developed
that is based on existing user satisfaction
questionnaires, usability evaluation approaches and
results from the 1st ARiSE Summer School in 2006.
The questionnaire has 28 closed items (quantitative
measures) and 2 open questions, asking users to
describe the most 3 positive and most 3 negative
aspects (qualitative measures). The closed items are
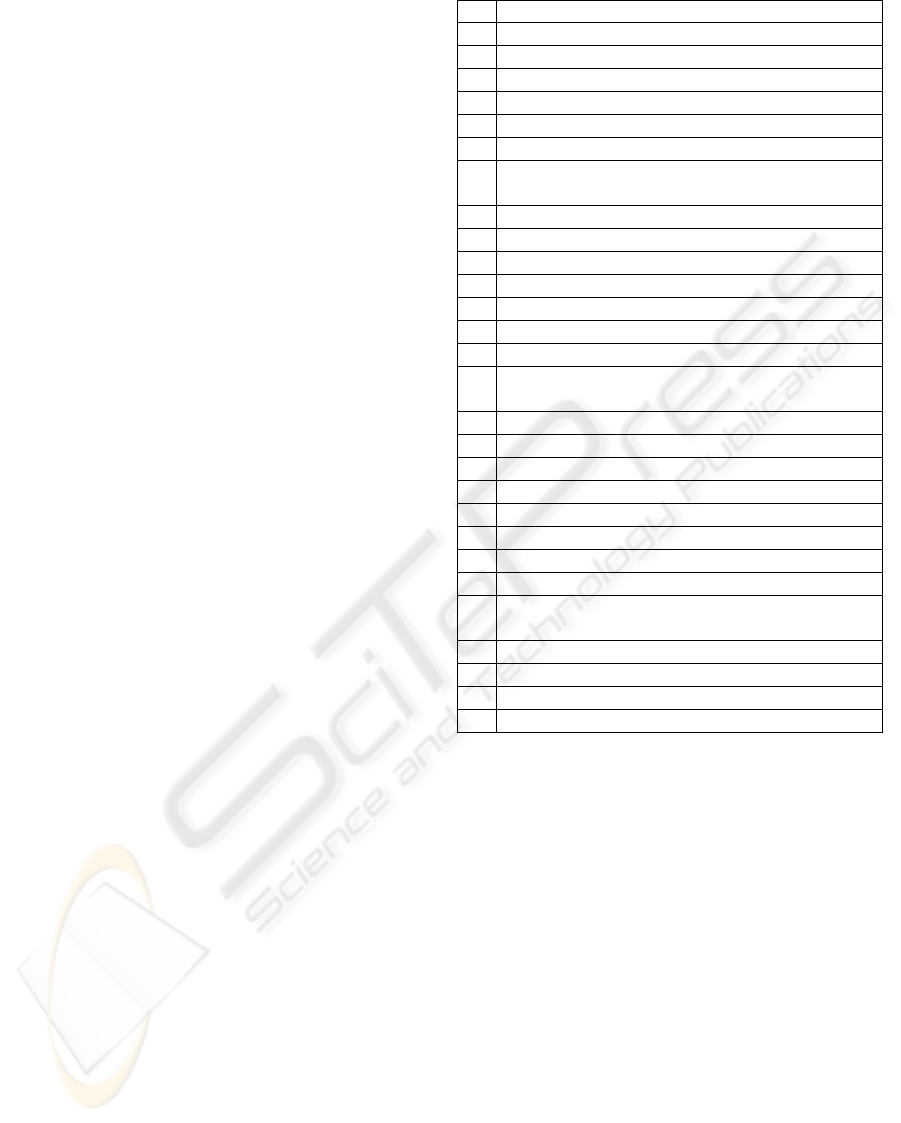
presented in Table 1.
Table 1: The usability questionnaire.
Item
1 Adjusting the "see-through" screen is easy
2 Adjusting the stereo glasses is easy
3 Adjusting the headphones is easy
4 The work place is comfortable
5 Observing through the screen is clear
6 Understanding how to operate with ARTP is easy
7 The superposition between projection and the real
object is clear
8 Learning to operate with ARTP is easy
9 Remembering how to operate with ARTP is easy
10 Understanding the vocal explanations is easy
11 Reading the information on the screen is easy
12 Selecting a menu item is easy
13 Correcting the mistakes is easy
14 Collaborating with colleagues is easy
15 Using ARTP helps to understand the lesson more
quickly
16 After using ARTP I will get better results at tests
17 After using ARTP I will know more on this topic
18 The system makes learning more interesting
19 Working in group with colleagues is stimulating
20 I like interacting with real objects
21 Performing the exercises is captivating
22 I would like to have this system in school
23 I intend to use this system for learning
24 I will recommend to other colleagues to use
ARTP
25 Overall, I find the system easy to use
26 Overall, I find the system useful for learning
27 Overall, I enjoy learning with the system
28 Overall, I find the system exciting
This evaluation instrument provides with a
broader view on usability. In this respect, the first 24
items are targeting various dimensions such as
ergonomics, usability, perceived utility, attitude and
intension to use. The remainder four items are to
assess how the students overall perceived the
platform as being easy to use, useful for learning,
enjoyable to learn with and exciting.
By addressing issues like perceived utility,
attitude and intention to use, usability evaluation
results could be easier integrated with pedagogical
evaluation results.
2.2.2 Procedure
Before testing, a brief introduction to the AR
technology and ARiSE project has been done for all
students. Then, each team tested the ARTP once,
during 1 hour. Students were asked to watch the
demo lesson and then to perform the three exercises
in order.
FORMATIVE USER-CENTERED USABILITY EVALUATION OF AN AUGMENTED REALITY EDUCATIONAL
SYSTEM
67
During testing, effectiveness (binary task
completion and number of errors) and efficiency
(time on task) measures have been collected in a log
file. Measures were collected for all exercises
performed.
After testing, the students were asked to answer
the new usability questionnaire by rating the items
on a 5-point Likert scale (1-strongly disagree, 2-
disagree, 3-neutral, 4-agree, and 5-strongly agree).
Prior to the summer school, the questionnaire has
been translated in the native language of students.
2.3 Results
2.3.1 Answers to the Questionnaire
Reliability of the scale was 0.931 (Cronbach’s
Alpha) which is acceptable. Overall, the results were
acceptable since means are over 3.00 (i.e. neutral).
However, 4 items were scored bellow 3.50 that
are targeting usability issues, including one general
question (Overall, I find the system easy to use).
Other 13 mean values are between 3.50 and 4.00.
These items are targeting various dimensions,
including the last two general questions.
The rest of 11 items were scored over 4.00
(“agree”), from which 4 items have been rated over
4.25:
• Item 4 – the workplace is comfortable.
• Item 10 – usefulness of the multimodal
interaction in AR environments
• Item 18 – motivational value of the ARTP.
• Item 22 – intention to use, denoting an
overall acceptance of the AR technology.
2.3.2 Most Mentioned Positive and Negative
Aspects
The answers to the open questions have been
analyzed in order to extract key words (attributes).
Attributes have been then grouped into categories.
Some students only described 1 or two aspects while
others mentioned several aspects in one sentence
thus yielding a number of 82 positive aspects and 69
negative aspects.
Main categories of most mentioned positive
aspects are summarized in Table 2 in a decreasing
order of their frequency.
Educational support includes aspects like: better
understanding (“you understand better the real
position of the organs”), good for learning (“I learn
easily the place of each organ”), easy to remember
the lesson (“I can better remember the learning
content”), attractive and faster learning (“it is good
for faster learning”). These aspects correspond to
the positive evaluation of items 4 (Using the
application helps to understand the lesson more
quickly) and 26 (Overall, I find the system useful for
learning) in the usability questionnaire.
Table 2: Most mentioned positive aspects.
Category Frequency
Educational support 40
AR and 3D visualization 13
Interesting and motivating 8
Vocal explanation 7
Funny, provocative (alike games) 7
Novel, good experience 4
Easy to use 3
Total 82
Students also liked the AR technology and 3D
interaction (“you learn the topic in 3D”). Students
liked the vocal explanation ("explanations are good
and descriptive"). This is consistent with the positive
evaluation of item 10 (Understanding the vocal
explanation is easy) in the usability questionnaire.
Students also appreciated the AR system as
funny (like games), novel and motivating “the
system motivates to learn such topic”, “the system
makes learning more interesting”). These aspects are
consistent with the positive evaluation of item 18
(The system makes learning more interesting).
Most mentioned negative aspects are
summarized in Table 3 in a decreasing order of their
frequency.
Table 3: Most mentioned negative aspects.
Category Frequency
Selection problems 25
Eye pain and problems with glasses 13
Real object too big 10
Headphones and sound problems 10
Difficult to use 4
Superposition 3
Errors and other technical problems 4
Total 69
Most frequent was the difficulty to reach each
organ with the interaction tool. (“it was often
difficult to point to the right organ”, “even if you
know the right answer, is difficult to select it”).
Selection and superposition problems as well as
difficulties to use the system correspond to the low
rating of items 7 (The superposition between
projection and the real object is clear) and 25
(Overall, I find the system easy to use) in the
usability questionnaire.
Second category of negative aspects was the eye
pain provoked by the wireless glasses (“it was
something wrong with glasses. They were blinking”).
ICSOFT 2008 - International Conference on Software and Data Technologies
68
Many students complained about the fact that the
real object was too big and it was difficult to work in
pairs (“I didn't like the fact that torso has to be
moved“, “every student should have his own torso“).
This correspond to the low rating of item 14
(Collaborating with colleagues is easy) in the
usability questionnaire.
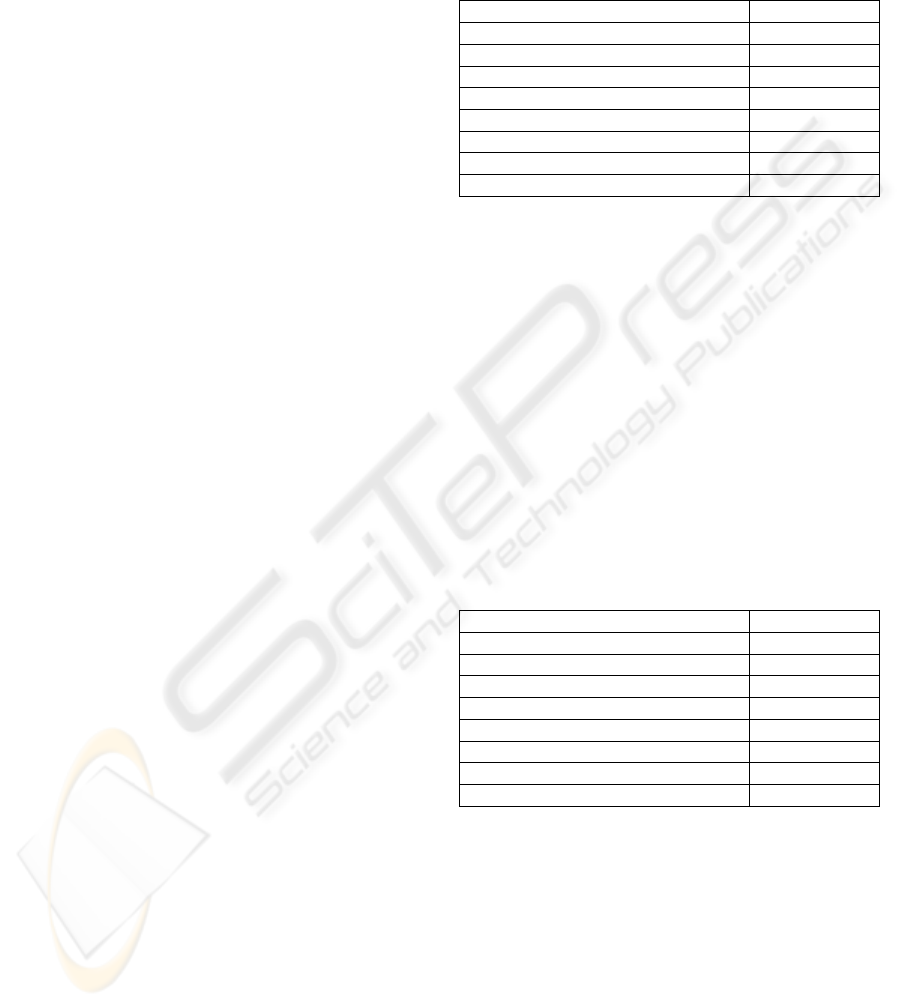
2.3.3 Measures of Effectiveness and
Efficiency
Table 4 shows the measures of effectiveness
(completion rate and number of errors) and
efficiency (mean execution time) for the Biology
scenario.
Table 4: Measures of effectiveness and efficiency.
Task Completion
rate
Mean no.
of errors
Time on
task (sec.)
Exercise 1 100% 4.45 381.8
Exercise 2 90% 4.94 254.9
Exercise 3 80% 13.69 381.6
The first exercise was easier to solve (just to
show organs) but more difficult to use. Errors
(min=0, max=13, SD=3.9) are mainly due to the
difficulties experienced with the selection. However,
all students succeeded to accomplish the task goal.
The execution time varied between 116 sec (2
errors) and 852 sec. (10 errors) with a mean of 381.8
sec (SD=218.1).
The last two exercises were more difficult to
solve (there is a many-to-many relationship between
organs and nutrients). The second exercise was
easier to use since the nutrients are selected with the
remote controller. So we could infer that errors are
mainly due to the lack of knowledge which is an
argument for the pedagogical usefulness of the
scenario.
2 students failed to solve the second exercise.
Only 1 student didn’t make errors and 3 made 10, 11
and 19 errors. The rest of the students made between
1 and 7 errors (mean=4.45, SD=3.89). The execution
time varied between 83 sec. (1 error) and 673 sec.
(19 errors) with a mean of 254.9 sec. (SD=186.1)
4 students failed to solve the third exercise. All
students made errors: 7 students made 1-10 errors, 5
students made 11-20 errors and 4 students made
over 20 errors. In this case, errors are due both to the
lack of knowledge and to the difficulties in selecting
organs. The execution time varied between 95 sec.
(with 1 error) and 727 sec. (with 39 errors) with a
mean execution time of 381.6 sec (SD=178).
Overall, 14 students succeeded to perform all the
exercises in the Biology scenario. The total
execution time varied between 309 sec. (7 errors)
and 1964 sec. (28 errors). The total number of errors
varied between 6 and 56 errors with a mean of 23.3
errors. The total mean execution time was 1060 sec.
i.e. 17.67 min. and is computed for the 14 students
which succeeded to finish all the tasks.
3 EVALUATION AFTER THE
SUMMER SCHOOL
3.1 Participants and Tasks
Two classes (8
th
class), each from a different school
in Bucharest participated at user testing in the period
1-15 November 2007. The total number of
participants was 42 students from which 19 boys and
23 girls. None of the students was familiar with the
AR technology.
Students came in groups of 6-8 accompanied by
a teacher, so testing has been organized in 2
sessions. The test has been conducted on the
platform of ICI Bucharest.
The students have been assigned 3 tasks: a demo
lesson, the 1
st
exercise and one of the exercises 2 or
3. The number of tasks assigned to a student has
been reduced to 3, because of time limitations. After
finishing the assigned exercises, students were free
to perform the third exercise or to repeat an assigned
one.
3.2 Results and Comparison
3.2.1 Answers to the Questionnaire
Overall, the results were acceptable since means are
over 3.00 (i.e. neutral). Reliability of the scale was
0.948 (Cronbach’s Alpha) which is acceptable.
However, 4 items were scored bellow 3.50 that
are targeting usability issues, including one general
question (Overall, I find the system easy to use).
Other 13 mean values are between 3.50 and 4.00.
These items are targeting various dimensions,
including the last two general questions.
The rest of 11 items were scored over 4.00
(“agree”), from which 4 items have been rated over
4.25:
• Item 3 – ease of using headphones
• Item 4 – the workplace is comfortable.
• Item 10 – usefulness of the multimodal
interaction in AR environments
• Item 18 – motivational value of the ARTP.
• Item 22 – intention to use, denoting an
overall acceptance of the AR technology.
FORMATIVE USER-CENTERED USABILITY EVALUATION OF AN AUGMENTED REALITY EDUCATIONAL
SYSTEM
69
0.00
1.00
2.00
3.00
4.00
5.00
Ro schools
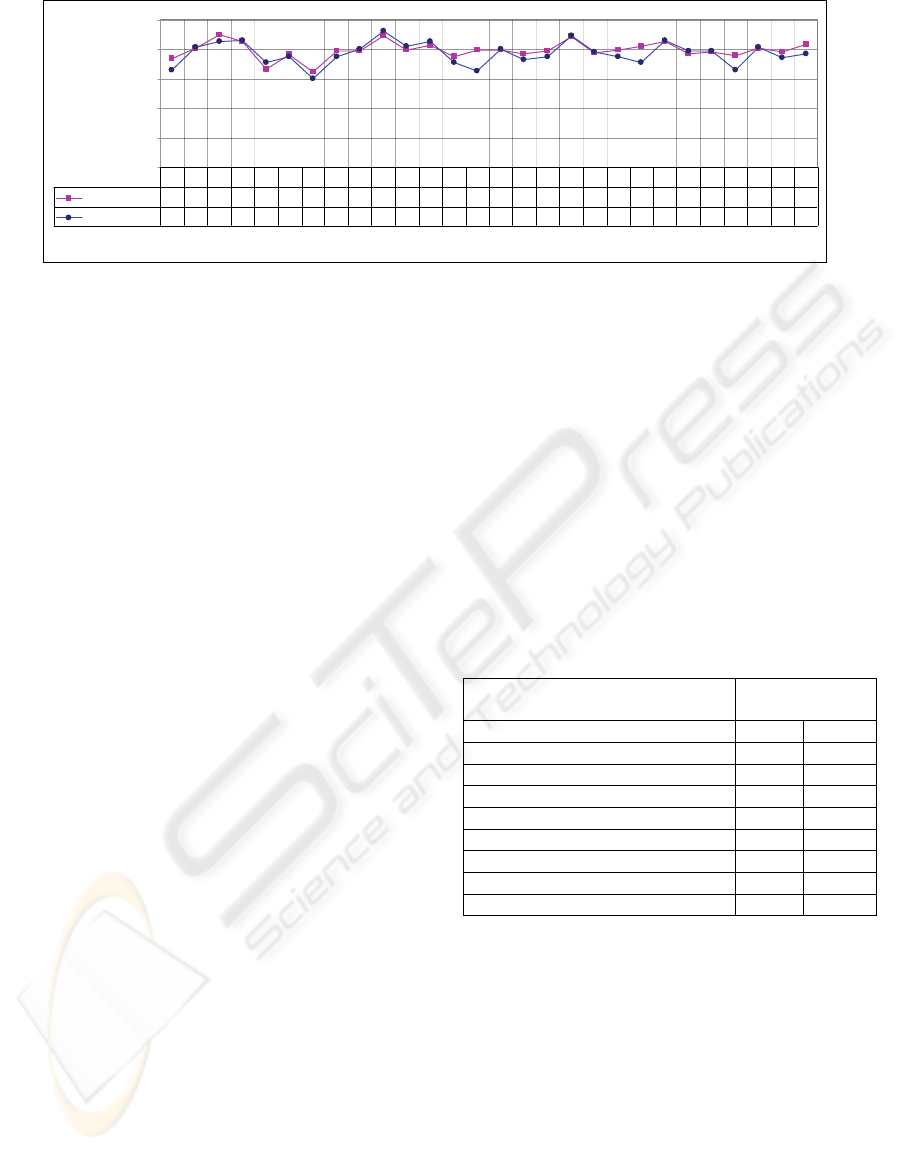
3.67 4.02 4.48 4.26 3.33 3.81 3.21 3.93 3.93 4.45 3.98 4.12 3.74 3.95 3.98 3.83 3.93 4.40 3.86 3.98 4.10 4.26 3.83 3.90 3.79 4.05 3.90 4.17
Summer school
3.30 4.05 4.25 4.30 3.55 3.75 3.00 3.75 4.00 4.60 4.10 4.25 3.55 3.25 4.00 3.65 3.75 4.45 3.90 3.75 3.55 4.30 3.95 3.95 3.30 4.05 3.70 3.85
1 2 3 4 5 6 7 8 9 10111213141516171819202122232425262728
Figure 1: Comparison with summer school results.
A comparison with the summer school
evaluation results is presented in Figure 2. The
general pattern is similar, in that items which were
scored low at the summer school were also scored
low by the students from the Romanian schools. In
general, students participating to the summer school
scored lower than students from the Romanian
schools (general mean of 3.85 vs. 3.96).
For the three items below, the differences are
relatively high (over 0.40) and showing deviations
from the general pattern:
• Item 14 (Collaborating with colleagues is
easy)
• Item 21 (Performing the exercises is
captivating)
• Item 25 (Overall I find the system easy to
use)
An independent samples t-test revealed that
differences are statistically significant (α=0.05,
DF=60) only for the items: 14 (t=-2.164, p=0.034),
and 21 (t=-2.231, p=0.029).
3.2.2 Most Mentioned Positive and Negative
Aspects
The most mentioned positive aspects are
summarized in Table 5 in a decreasing order of their
frequency.
Educational support includes aspects like: better
understanding (“the system help to better understand
the lesson”, “it helps you to understand where and
how are the organs placed”), good for learning (“the
system helps me to learn better”), and exercises
themselves (“very good exercises”).
Students liked the vocal explanation ("I
understood well the explanations"). They also
appreciated the AR system as funny (“it was
beautiful, like a game”), and motivating (“it was
interesting and captivating”).
These aspects correspond to the positive
evaluation of items 4 (Working on the chair is
comfortable), 10 (Understanding the vocal
explanation is easy), 18 (The system makes learning
more interesting) and 26 (Overall, I find the system
useful for learning) in the usability questionnaire.
Educational support includes aspects like: better
understanding (“the system help to better understand
the lesson”, “it helps you to understand where and
how are the organs placed”), good for learning (“the
system helps me to learn better”), and exercises
themselves (“very good exercises”).
Table 5: Most mentioned positive aspects and comparison
with summer school results.
Category after / during
summer school
Educational support 33 40
AR and 3D visualization 15 13
Comfortable workplace 11 -
Interesting and motivating 8 8
Vocal explanation 8 7
Funny, provocative (alike games) 7 7
Novel, good experience - 4
Easy to use 3 3
Total 85 82
Students liked the vocal explanation ("I
understood well the explanations"). They also
appreciated the AR system as funny (“it was
beautiful, like a game”), and motivating (“it was
interesting and captivating”).
These aspects correspond to the positive
evaluation of items 4 (Working on the chair is
comfortable), 10 (Understanding the vocal
explanation is easy), 18 (The system makes learning
more interesting) and 26 (Overall, I find the system
useful for learning) in the usability questionnaire.
The comparison with summer school results is
showing many similarities and small differences.
ICSOFT 2008 - International Conference on Software and Data Technologies
70
Most mentioned negative aspects are
summarized in Table 6 in a decreasing order of their
frequency.
Table 6: Most mentioned negative aspects and comparison
with summer school results.
Category after / during
summer school
Selection problems 25 25
Eye pain and problems with glasses 18 13
Real object too big 15 10
Headphones and sound problems 10 10
Superposition 7 4
Difficult to use 4 3
Other problems 10 4
Total 79 69
Most frequent was the difficulty to reach each
organ with the interaction tool. (“the pointer didn’t
select organs and sometimes didn’t work”).
Selection and superposition problems as well as
difficulties to use the system correspond to items 7
(The superposition between projection and the real
object is clear) and 25 (Overall, I find the system
easy to use) in the usability questionnaire.
Second category of negative aspects was the eye
pain provoked by the wireless glasses (“the glasses
were blinking”, “after exercises we feel a pain in the
eyes”).
Many students complained about the fact that the
real object was too big and it was difficult to work in
pairs (“I didn't like to move the torso with my
colleague“). This correspond to the low score of
item 14 (Collaborating with colleagues is easy) in
the usability questionnaire.
Again, the comparison with summer school
results shows similar usability problems.
3.2.3 Measures of Effectiveness and
Efficiency
Table 7 shows the measures of effectiveness
(completion rate and number of errors) and
efficiency (mean execution time). The number of
observations is varying because not all tasks have
been assigned and for one student it was not possible
to perform the exercises because of technical
problems.
The first exercise was easier to solve (just to
show organs) but more difficult to use. Errors
(min=0, max=19, SD=4.83) are mainly due to the
difficulties experienced with the selection. However,
all students succeeded to accomplish the task goal.
The execution time varied between 188 sec (1 error)
and 870 sec. (19 errors) with a mean of 455.8 sec
(SD=193.7).
Table 7: Measures of effectiveness and efficiency.
Task Completion
rate
Mean no.
of errors
Time on
task (sec.)
1 80% 6.88 455.8
2 91% 6.28 318.4
3 94% 15.90 401.4
3 students from 35 failed to solve the second
exercise. All students made errors and 4 students
made over 10 errors. The rest of the students made
between 1 and 9 errors (mean=6.28, SD=3.15). The
execution time varied between 121 sec. (5 errors)
and 932 sec. (6 errors) with a mean of 318.4 sec.
(SD=220.1)
1 student from 17 failed to solve the third
exercise. All students made errors and 7 students
made over 20 errors. In this case, errors are due to
the lack of knowledge and to the difficulties in
selecting organs. The execution time varied between
174 sec. (with 3 errors) and 917 sec. (with 21 errors)
with a mean execution time of 401.8 sec
(SD=226.8).
Overall, 32 students (78%) succeeded to perform
all assigned exercises from which 11 students
additionally performed a third exercise (not
assigned). 6 students performed only one exercise
while 3 students failed to perform any exercise.
The total execution time for the 11 students
performing all assigned exercises varied between
705 sec. (with 22 errors) and 1972 sec. (with 10
errors). The total number of errors varied between 8
and 50 with a mean of 20.73 errors (SD=12.73). The
total mean time on task was 1207.8 sec. i.e. 20.1 min
(SD=8.75).
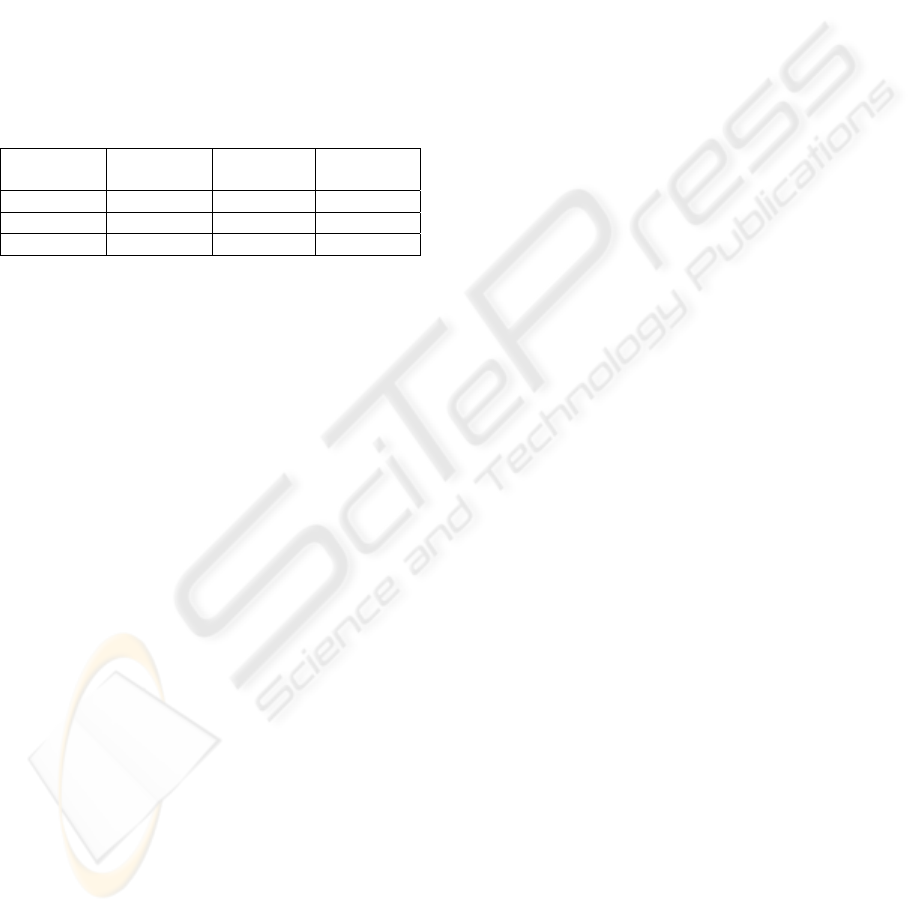
A comparison between effectiveness and
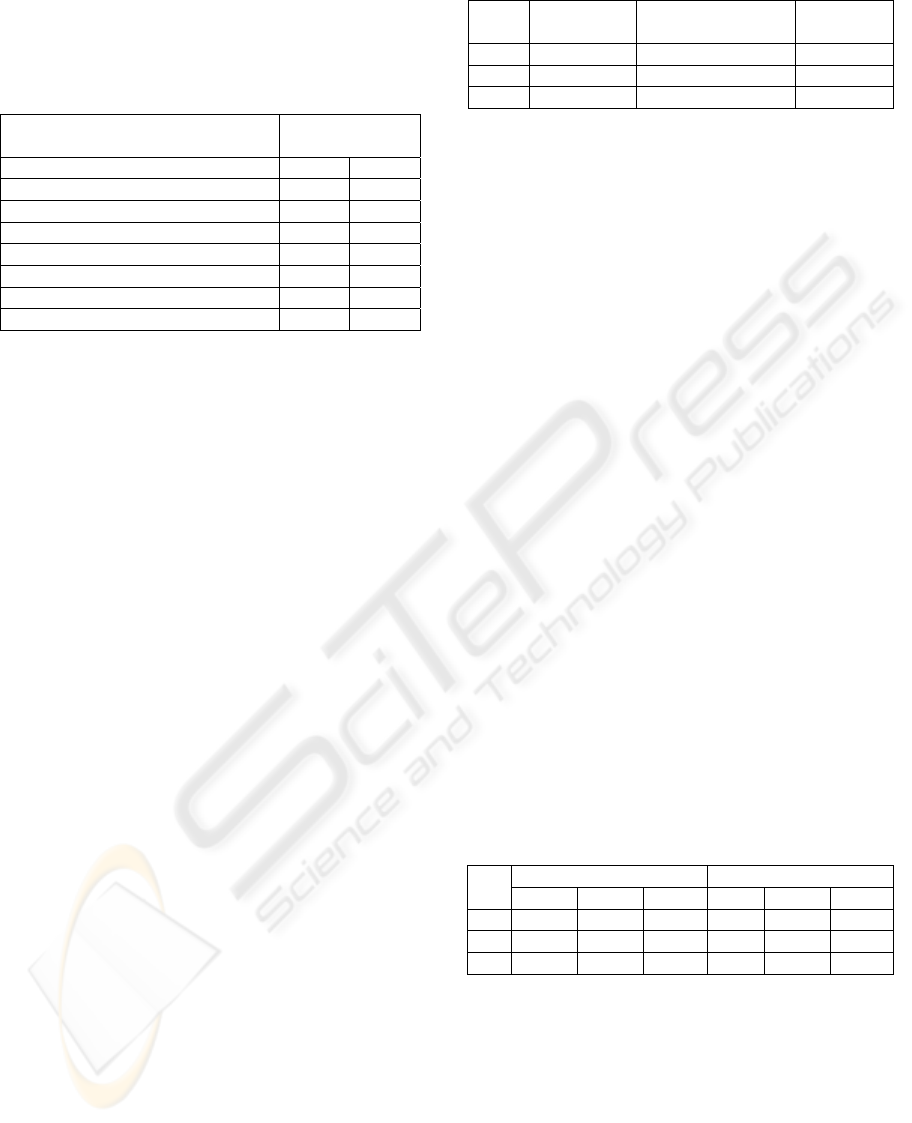
efficiency measures is presented in Table 8.
Table 8: Effectiveness and efficiency measures –
comparison with summer school results.
During summer school After summer school
No
Rate Errors Time Rate Errors Time
1 100% 4.45 381.8 80% 6.88 455.8
2 90% 4.94 254.9 91% 6.28 318.4
3 80% 13.69 381.6 94% 15.90 401.4
Differences exist between the completion rates at
the first and third exercise. Participants at the
summer school made fewer errors. However, in both
cases the third exercise was finished with many
errors.
Differences exist for the number of errors and
time on task between the two samples. An
explanation is the fact that during summer school the
participants had nothing else to do and the event
itself was providing with an extra motivation (and
some sense of competition) while students from
FORMATIVE USER-CENTERED USABILITY EVALUATION OF AN AUGMENTED REALITY EDUCATIONAL
SYSTEM
71

Romanian schools came to user testing in the
afternoon, after classes (they are learning in the
morning) so they were already tired.
4 CONCLUSIONS AND FUTURE
WORK
The evaluation of subjective measures of user
satisfactions based on both quantitative and
qualitative data collected with the usability
questionnaire reveals several positive aspects.
ARTP has educational value: the system is good
for understanding, good for learning, good for
testing, and makes it easier to remember the lesson.
The system makes learning faster. ARTP is
increasing the students’ motivation to learn: the
system is attractive, stimulating and exciting,
exercises are captivating and the system makes
learning less boring. The students liked the
interaction with 3D objects using AR techniques as
well as the vocal explanation guiding them
throughout the learning process.
Overall, user acceptance of ARTP is good:
students appreciated ARTP as useful for learning
and expressed the interest to use it in the future.
Several usability problems exist that have been
identified by both questionnaire data and log file
analysis. The clarity of visual perception should be
improved as well as the overall ease of use. Many
students complained about eye pain provoked by the
wireless stereo glasses. Therefore it is strongly
recommended to replace them with wired stereo
glasses and to include this requirement into the
technical specification of the AR platform.
Formative evaluation proved to be a useful aid to
designers and a new version of the scenario has been
recently released. By taking repeated measures on
the same system version but with different user
populations is both reliable for evaluators and
convincing for designers.
The usability questionnaire is intended to
support both formative and summative usability
evaluation. In this respect, user testing performed
after the summer school is also a first step to a
summative evaluation of the Biology scenario. In
order to gather enough data we restarted user testing
in 2008, on an improved version of ARTP.
ACKNOWLEDGEMENTS
We gratefully acknowledge the support of the
ARiSE research project, funded by the EC under
FP6-027039.
REFERENCES
Bach, C., Scapin, D., 2004. Obstacles and perspectives for
Evaluating mixed Reality Eystems Usability. In. Mixer
workshop, Proceedings of IUI-CADUI Conference
2004, pp. 72-79. ACM Press.
Bowman, D., Gabbard, J., and Hix, D. “A Survey of
Usability Evaluation in Virtual Environments:
Classification and Comparison of Methods”.
Presence: Teleoperators and Virtual Environments,
vol. 11, no. 4, 2002. 404-424.
Coutrix, C., Nigay, L., 2006. Mixed Reality: A Model of
Mixed Interaction. In Proceedings of Advanced Visual
Interfaces, Venezia, pp. 59-64. ACM Press
Davis, F.D., Bagozzi, R.P., Warshaw, P.R., 1989. User
Acceptance of Computer Technology: A Comparison
of Two Theoretical Models, Management Science,
Vol. 35, No. 8, pp. 982-1003.
Dillon, A. and Morris, M., 1998. From "can they?" to "will
they?": extending usability evaluation to address
acceptance. AIS Conference Paper, Baltimore, August
1998.
Gabbard, J., Hix, D., Swan, E., Livingston, M., Herer, T.,
Julier, S., Baillot, Y. & Brown, D., 2004. A Cost-
Effective Usability Evaluation Progression for Novel
Interactive Systems. In Proceedings of Hawaii
International Conference on Systems Sciences, Track
9, p. 90276c, IEEE.
Kaufmann, H., Dunser, A., 2007. Summary of Usability
Evaluation of an Educational Augmented Reality
Application. In. R. Shumaker (ed.) Virtual Reality,
Human-Computer Interaction International
Conference (HCII), LNCS 4563, pp. 660-669.
Springer, Berlin.
ISO/DIS 9241-11:1994 Information Technology –
Ergonomic requirements for office work with visual
display terminal (VDTs) - Guidance on usability.
Scriven, M., 1991. Evaluation thesaurus. 4th ed. Newbury
Park, CA: Sage Publications.
Theofanos, M. & Quesenbery, W., 2005. Towards the
Design of Effective Formative Test Reports. In
Journal of Usability Studies, Issue 1, Vol.1. pp. 27-45.
Venkatesh, V., Davis, F.D., Morris, M.G., 2007. Dead Or
Alive? The Development, Trajectory And Future Of
Technology Adoption Research. Journal of the AIS,
Vol. 8, Issue 4, pp. 267-286.
Wind, J., Riege, K., Bogen M., 2007. Spinnstube®: A
Seated Augmented Reality Display System, In Virtual
Environments, Proceedings of IPT-EGVE – EG/ACM
Symposium, pp. 17-23., Eurographics.
ICSOFT 2008 - International Conference on Software and Data Technologies
72
