
PREDICTING DEFECTS IN A LARGE TELECOMMUNICATION
SYSTEM
Gözde Koçak, Burak Turhan and Ayşe Bener
Department of Computer Engineering, Boğaziçi University, 34342 Bebek, Istanbul, Turkey
Keywords: Software testing, Defect Prediction, Call Graph, Empirical Analysis.
Abstract: In a large software system knowing which files are most likely to be fault-prone is valuable information for
project managers. However, our experience shows that it is difficult to collect and analyze fine-grained test
defects in a large and complex software system. On the other hand, previous research has shown that
companies can safely use cross company data with nearest neighbor sampling to predict their defects in case
they are unable to collect local data. In this study we analyzed 25 projects of a large telecommunication
system. To predict defect proneness of modules we learned from NASA MDP data. We used static call
graph based ranking (CGBR) as well as nearest neighbor sampling for constructing method level defect
predictors. Our results suggest that, for the analyzed projects, at least 70% of the defects can be detected by
inspecting only i) 6% of the code using a Naïve Bayes model, ii) 3% of the code using CGBR framework.
1 INTRODUCTION
Software testing is one of the most critical and costly
phases in software development. Project managers
need to know “when to stop testing?” and “which
parts of the code to test?”. The answers to these
questions would directly affect defect rates and
product quality as well as resource allocation and the
cost.
As the size and complexity of software increases,
manual inspection of software becomes a harder
task. In this context, defect predictors have been
effective secondary tools to help test teams locate
potential defects accurately (Menzies et.al., 2007a).
In this paper, we share our experience for
building defect predictors in a large
telecommunication system and present our initial
results. We have been working with the largest GSM
operator (~70% market share) in Turkey, Turkcell,
to improve code quality and to predict defects before
the testing phase. Turkcell is a global company
whose stocks are traded in NYSE and operates in
Turkey, Azerbaijan, Kazakhstan, Georgia, Northern
Cyprus and Ukraine with a customer base of 53,4
million. The underlying system is standard 3-tier
architecture, with presentation, application and data
layers. Our analysis focuses on the presentation and
application layers. However, the content in these
layers cannot be separated as distinct projects. We
were able to identify 25 critical components, which
we will refer to as project throughout this paper.
We used a defect prediction model that is based
on static code attributes. Some researchers have
argued that the information content of the static code
attributes is very limited (Fenton, 1999). However,
static code attributes are easy to collect, interpret and
many recent research have successfully used them to
build defect predictors (Menzies et.al., 2007a,
2007b; Turhan and Bener 2007, 2008). Furthermore,
the information content of these attributes can be
increased i.e. using call graphs (Kocak et.al. 2008).
Kocak et.al shows that integrating call graph
information in defect predictors decreases their false
positive rates while preserving their detection rates.
The collection of static code metrics and call
graphs can be easily carried out using automated
tools (Menzies et.al. 2007; Turhan and Bener 2008).
However, matching these measurements to software
components is the most critical factor for building
defect predictors. Unfortunately, in our case, it was
not possible to match past defects with the software
components in the desired granularity, module level,
where we mean the smallest unit of functionality
(i.e. java methods, c functions). Previous research in
such large systems use either component or file level
code churn metrics to predict defects (Nagappan and
Ball, 2006; Zimmermann and Nagappan, 2006;
Ostrand and Weyuker, 2002; Ostrand et al. 2004;
284
Koçak G., Turhan B. and Bener A. (2008).
PREDICTING DEFECTS IN A LARGE TELECOMMUNICATION SYSTEM.
In Proceedings of the Third International Conference on Software and Data Technologies - SE/GSDCA/MUSE, pages 284-288
DOI: 10.5220/0001887502840288
Copyright
c
SciTePress
Ostrand et al. 2005; Bell et al. 2006; Ostrand et al.
2007). The reason is that file level is the smallest
granularity level that can be achieved. However,
defect predictors become more precise as the
measurements are gathered from smaller units
(Ostrand et al. 2007).
Therefore, we decided to use module level cross
company data to predict defects for Turkcell projects
(Menzies et al. 2007b). Specifically, we have used
module level defect information from NASA MDP
projects to train defect predictors and then obtained
predictions for Turkcell projects. Previous research
have shown that cross company data gives stable
results and using nearest neighbor sampling
techniques further improves the prediction
performance when cross company data is used
(Menzies et al. 2007; Turhan and Bener, 2008). Our
experiment results with cross-company data on
Turkcell projects, estimate that we can detect 70% of
the defects with a 6% LOC investigation effort.
In order to decrease false alarm rates, we
included the CGBR framework in our analysis based
on our previous research (Kocak et al. 2008). Using
CGBR framework improved our estimated results
such that the LOC investigation effort decreased
from 6% to 3%.
The rest of the paper is organized as follows: In
section 2 we briefly review the related literature, in
section 3 we explain the project data. Section 4
explains our rule-based analysis. Learning based
model analysis is discussed in section 5. The last
section gives conclusion and future direction.
2 RELATED WORK
Ostrand and Weyuker have been performing similar
research for AT&T and they also report that it is
hard to conduct an empirical study in large systems
due to difficulty in finding the relevant personnel
and the high cost of collecting and analyzing data
(Ostrand and Weyuker, 2002).
Fenton and Ohlsson presented results of an
empirical study on two versions of a large-scale
industrial software, which showed that the
distribution of the faults and failures in a software
system can be modeled by Pareto principle (Fenton
and Ohlsson, 2000). They claimed that neither size
nor complexity explain the number of faults in a
software system. Other researchers found interesting
results showing that small modules are more fault -
prone than larger ones (Koru and Liu, 2005; Koru
and Liu, Dec. 2005; Malaiya and Denton, 2000;
Zhang 2008). Our results will also show evidence in
favor of this fact.
As mentioned, Ostrand, Weyuker and Bell
predicted fault-prone files of the large software
system in AT&T by using a negative binominal
regression model (Ostrand and Weyuker, 2002;
Ostrand et al. 2004; Ostrand et al. 2005; Bell et al.
2006; Ostrand et al. 2007). They report that their
model can detect 20% of the files that contain 80%
of all faults. Similarly, Nagappan, Ball and
Zimmermann analyzed several Microsoft software
components using static code and code churn
metrics to predict post-release defects. They
observed that different systems could be best
characterized by different sets of metrics (Nagappan
and Ball, 2006: Zimmermann and Nagappan, 2006).
Our work differs at a large extent from previous
work. Ostrand, Weyuker and Bell carried out the
most similar work to this research, where they used
file level measurements as a basic component.
However, we prefer using modules, since modules
provide finer granularity. They have collected data
from various releases of projects and predict post-
release defects, whereas we have data from single
release of 25 projects and we try to predict pre-
release defects.
3 DATA
In this research we analyzed 25 ‘Trcll’ projects. All
projects are implemented in Java and we have
gathered 29 static code metrics from each. In total,
there are approximately 48,000 modules spanning
763,000 lines of code.
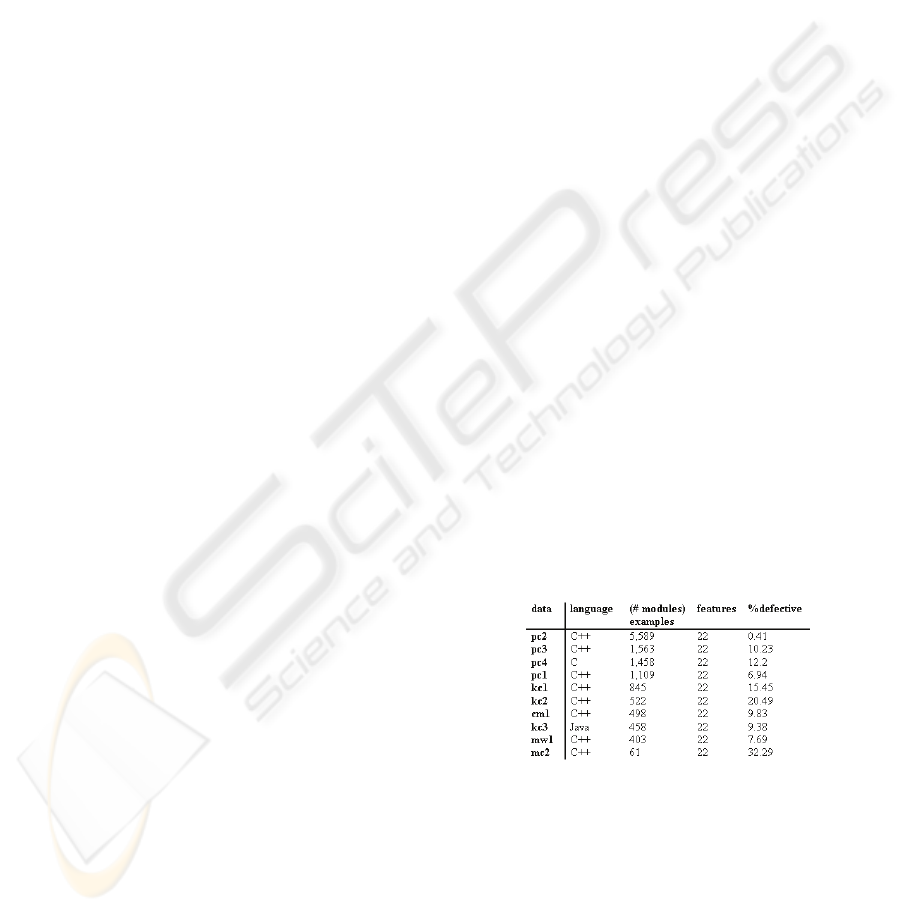
Figure 1: NASA datasets used in this study.
We used cross company data from NASA MDP
that are available online in the PROMISE repository
(Boetticher et al. 2007; NASA). Figure 1 shows the
characteristics of NASA projects. Each NASA
dataset has 22 static code attributes. In our analysis,
we have used only the common attributes (there are
17 of them) that are available in both data sources.
PREDICTING DEFECTS IN A LARGE TELECOMMUNICATION SYSTEM
285

4 DATA ANALYSIS
4.1 Average-case Analysis
Figure 2 shows the average values of 17 static code
metrics collected from the 25 telecom datasets. It
also shows the recommended intervals based on
statistics from NASA MDP projects, when
applicable. Cells marked with gray color correspond
to metrics that are out of the recommended intervals.
There are two clear observations in Figure 2.
Developers do not write comments throughout the
source code and low number of operands and
operators indicate small, modular methods.
Figure 2: Average-case analysis about Turkcell datasets.
4.2 Rule-based Analysis
Based on the recommended intervals in Figure 2, we
have defined simple rules for each metric. These
rules fire, if a module’s metric is not in the specified
interval, indicating the manual inspection of the
module. Figure 3 shows the 17 basic rules and
corresponding metrics, along with 2 derived rules.
The first derived rule, Rule 18, define a disjunction
among 17 basic rules. That is Rule 18 fires if any
basic rule fires. Note that, the gray colored rules in
Figure 3 fire too frequently that cause rule 18 to fire
all the time. The reason is that the corresponding
comment and Halstead metrics’ related intervals do
not fit Turkcell’s code characteristics.
In order to overcome this problem we have
defined Rule 19 that fires if all basic rules, but the
Halstead fire. This reduces the firing frequency of
the disjunction rule. However, Rule 19 states that
6484 modules (14%) corresponding to 341,655 LOC
(45%) should be inspected in order to detect
potential defects.
Inspection of 45% of total LOC is impractical.
On the other hand, learning based model will be
shown to be far more effective. We have designed
two types of analysis using the learning based
model. Analysis #1 uses the cross-company
predictor with k-Nearest Neighbor sampling for
predicting fault-prone modules. Analysis #2
incorporates CGBR framework into static code
attributes and than apply the model of Analysis #1.
Figure 3: Rule-based analysis.
5 ANALYSIS
5.1 Analysis #1
In this analysis we used the Naïve Bayes data miner
that achieves significantly better results than many
other mining algorithms for defect prediction
(Menzies et.al., 2007a). We selected a random 90%
subset of cross-company NASA data to train the
model. From this subset, we have selected similar
projects that are similar to Trcll in terms of
Euclidean distance in the 17 dimensional metric
spaces. The nearest neighbors in the random subset
are used to train a predictor, which then made
predictions on the Trcll data. We repeated this
procedure 20 times and raised a flag for modules
that are estimated as defective at least in 10 trials.
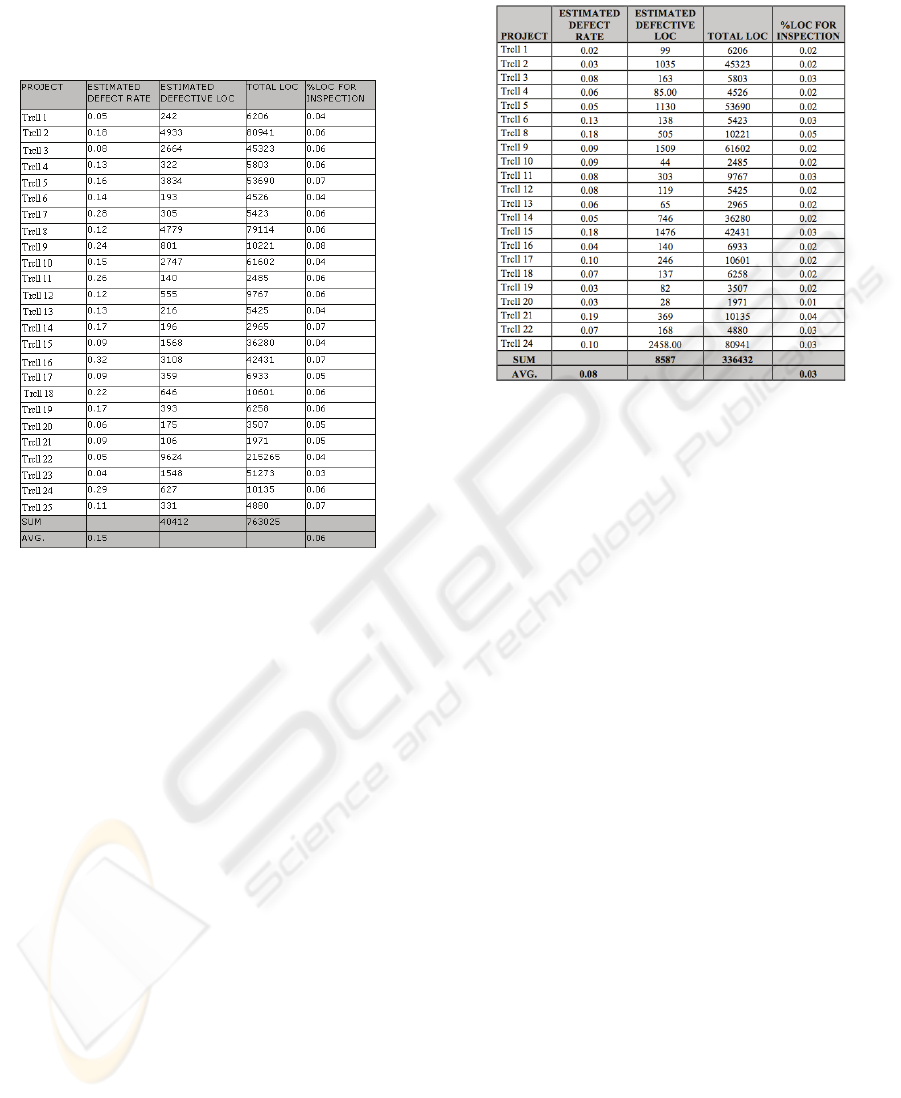
Figure 4 shows the results from the first analysis.
The estimated defect rate is %15 that is consistent
with the rule-based model’s estimation. However,
there is a major difference between the two models
in terms of their practical implications. For the rule-
based model, estimated defective LOC corresponds
to 45% of the whole code, while module level defect
rate is 14% on the other hand; for the learning-based
model, estimated defective LOC corresponds to only
6% of the code, where module level defect rate is
still estimated as 15%.
This significant difference is occurred because
rule base model makes decisions based on individual
ICSOFT 2008 - International Conference on Software and Data Technologies
286
metrics and it has a bias towards more complex and
larger modules. On the other hand learning based
model combines all ‘signals’ from each metric and
estimates that defects are located in smaller
modules.
Figure 4: Analysis #1 results.
5.2 Analysis #2
We argue that module interactions play an important
role in determining the complexity of the overall
system rather than assessing modules individually.
Therefore in a previous research (Kocak et.al. 2008)
a model is proposed to investigate the module
interactions with static call graphs. Kocak et.al.
proposed the call graph based ranking (CGBR)
framework that is applicable to any static code
metrics based defect prediction model.
To implement CGBR framework we created
NxN matrix for building the call graphs where N is
the number of modules. In this matrix, rows contain
the information whether a module calls the others or
not. Columns contain how many times a module is
called by other modules. Inspired from the web page
ranking methods, we treated each caller-to-callee
relation in the call graph as hyperlinks from a web
page to another. We then assigned equal initial ranks
(i.e. 1) to all modules and iteratively calculated
module ranks using PageRank algorithm.
In this study we analyzed the static call graph
matrices for only 22 projects, since the other 3
projects were so large that their call graph analysis
were not completed at the time of writing this paper,
due to high memory requirements.
Figure 5: Analysis #2 results.
In analysis #2, we have calculated CGBR values,
quantized them into 10 bins and assigned each bin, a
weight value from 0.1 to 1 considering their
complexity levels. Then, we have adjusted the static
code attributes by multiplying each raw in the data
table with corresponding weights, before we trained
our model as in Analysis #1.
Figure 5 shows the results of analysis #2. In
order to catch 70% of the defects, the second model
proposes to investigate only 3% proportion of the all
code.
6 CONCLUSIONS
In this study we investigate how to predict fault-
prone modules in a large software system. We have
performed an average case analysis for the 25
projects. This analysis shows that the software
modules were written using relatively low number of
operands and operators to increase modularity and to
decrease maintenance effort. However, we have also
observed that the code base was purely commented,
which makes maintenance a difficult task.
Our initial data analysis revealed that a simple
rule-based model based on recommended standards
on static code attributes estimates a defect rate of
15% and requires 45% of the code to be inspected.
This is an impractical outcome considering the scope
of the system. Thus, we have constructed learning
based defect predictors and performed further
analysis. We have used a cross-company NASA data
PREDICTING DEFECTS IN A LARGE TELECOMMUNICATION SYSTEM
287

to learn defect predictors, due to lack of local
module level defect data.
The first analysis confirms that the average
defect rate of all projects was 15%. While the simple
rule based module requires inspection of 45% of the
code, the learning based model suggested that we
needed to inspect only 6% of the code. This is from
the fact that rule based model has a bias towards
more complex and larger modules, whereas learning
based model predicts that smaller modules contain
most of the defects.
Our second analysis results employed data
adjusted with CGBR framework and improved the
estimations further and suggested that 70% of the
defects could be detected by inspecting only 3% of
the code.
Our future work consists of collecting local
module level defects to be able to build within-
company predictors for this large telecommunication
system. We also plan to use file level code churn
metrics in order to predict production defects
between successive versions of the software.
ACKNOWLEDGEMENTS
This research is supported by Boğaziçi University
research fund under grant number BAP 06HA104,
the Turkish Scientific Research Council
(TUBITAK) under grant number EEEAG 108E014
and Turkcell A.Ş.
REFERENCES
Bell, R.M., Ostrand, T.J., Weyuker, E.J., July 2006.
Looking for Bugs in All the Right Places. Proc.
ACM/International Symposium on Software Testing
and Analysis (ISSTA2006), Portland, Maine, pp. 61-
71.
Boetticher, G., Menzies, T., Ostrand, T., 2007. PROMISE
Repository of empirical software engineering data
http://promisedata.org/repository, West Virginia
University, Department of Computer Science.
Fenton N.E. and Neil M., A critique of software defect
prediction models. IEEE Transactions On Software
Engineering (1999) vol. 25 pp. 675-689
Fenton, N.E., Ohlsson, N., Aug 2000. Quantitative
Analysis of Faults and Failures in a Complex Software
System. IEEE Trans. on Software Engineering, Vol
26, No 8, pp.797-814.
Kocak, G., Turhan, B., Bener, A., 2008. Software Defect
Prediction Using Call Graph Based Ranking (CGBR)
Framework, to appear in Proceedings of
EUROMICRO SPPI (2008), Parma, Italy.
Koru, A. G., Liu, H., 2005. An Investigation of the Effect
of Module Size on Defect Prediction Using Static
Measures. Proceeding of PROMISE 2005, St. Louis,
Missouri, pp. 1-6.
Koru, A. G., Liu, H., Nov.-Dec. 2005. Building effective
defect-prediction models in practice Software, IEEE,
vol. 22, Issue 6, pp. 23 – 29.
Malaiya, Y. K., Denton, J., 2000. Module Size
Distribution and Defect Density, ISSRE 2000, pp. 62-
71.
Menzies, T., Greenwald, J., Frank, A., 2007. Data Mining
Static Code Attributes to Learn Defect Predictors,
IEEE Transactions on Software Engineering, 33, no.1,
2-13.
Menzies, T., Turhan, B., Bener, A., Distefano, J., 2007.
“Cross- vs within-company defect prediction studies”,
Technical report, Computer Science, West Virginia
University.
NASA, “WVU IV&V facility metrics data program.”
[Online]. Available: http://mdp.ivv.nasa.gov
Ostrand, T.J., Weyuker., E.J., July 2002. The Distribution
of Faults in a Large Industrial Software System. Proc.
ACM/International Symposium on Software Testing
and Analysis (ISSTA2002), Rome, Italy, pp. 55-64.
Ostrand, T.J., Weyuker, E.J., Bell, R.M., July 2004.
Where the Bugs Are. Proc. ACM/International
Symposium on Software Testing and Analysis
(ISSTA2004), Boston, MA.
Ostrand, T.J., Weyuker, E.J., Bell, R.M., April 2005.
Predicting the Location and Number of Faults in Large
Software Systems. IEEE Trans. on Software
Engineering, Vol 31, No 4.
Ostrand, T.J., Weyuker, E.J., Bell, R.M., July 2007.
Automating Algorithms for the Identification of Fault-
Prone Files. Proc. ACM/International Symposium on
Software Testing and Analysis (ISSTA07), London,
England.
Turhan, B., Bener, A., 2008. Data Sampling for Cross
Company Defect Predictors, Technical Report,
Computer Engineering, Bogazici University.
Turhan , B., Bener, A., A Multivariate Analysis of Static
Code Attributes for Defect Prediction. Quality
Software, 2007. QSIC '07. Seventh International
Conference on (2007) pp. 231 - 237
Nagappan, N. and Ball T., Explaining failures using
software dependences and churn metrics. Technical
Report, Microsoft Research (2006)
Zhang, H., On the Distribution of Software Faults.
Software Engineering, IEEE Transactions on (2008)
vol. 34 (2) pp. 301-302
Zimmermann, T., Nagappan, N. Predicting Subsystem
Failures using Dependency Graph Complexities.
Technical Report, Microsoft Research (2006).
ICSOFT 2008 - International Conference on Software and Data Technologies
288
