
HYBRID SYSTEM FOR DATA CLASSIFICATION OF DNA
MICROARRAYS WITH GA AND SVM
Mónica Miguélez
1
, Juan Luis Pérez
2
1
Department of Information and Communication Technologies, University of Coruña
Campus de Elviña, La Coruña, Spain
2
Department of ConstructionTechnology, University of Coruña, Campus de Elviña, La Coruña, Spain
Juan R. Rabuñal, Julián Dorado
Department of Information and Communication Technologies, University of Coruña
Campus de Elviña, La Coruña, Spain
Keywords: Microarrays, Support Vector Machine (SVM), Genetic Algorithms (GA).
Abstract: This paper proposes a Genetic Algorithm (GA) combined with Support Vector Machine (SVM) for
selecting and classifying data from DNA microarrays, with the aim of differentiate healthy from cancerous
tissue samples. The proposed GA, by using a SVM fitness function, enables the selection of a group of
genes that represent the absence or the presence of cancerous tissue. The proposed method is tested with a
group data related to a widely known cancer disease, the breast cancer. The comparison shows that the
results obtained with these combined techniques are better than other techniques.
1 INTRODUCTION
The DNA Microarrays technology enables the
simultaneous measurement of expression level of
thousands of genes from tissue samples. Multiple
works were performed during the last years aiming
for classification methods that could enable the
recognition of healthy and cancerous tissues by
means of microarray data analysis (Huang, 2003).
Several viewpoints have been successfully
applied for the analysis of microarrays data during
the last years, more specifically several Genetic
Algorithms (GA) and Support Vector Machine
(SVM) (Nahar, 2007; Bonilla, 2006; Roberts, 2005).
The goal of the present work is the selection and
classification of DNA microarray data in order to
achieve the differentiation between samples of
cancerous tissues and healthy ones. A hybrid model
that uses a combined GA, of variable length, with
SVM, as fitness function, is proposed in order to
achieve this.
2 DATA SET
Currently it is known that the tumour invasion of the
Axilary lymph nodes is a key factor in breast cancer
prognosis. During the last years the best method for
patient classification into seriousness subgroups was
the pathological study of biopsy samples of
lymphatic nodes (highly inaccurate invasive
method).
The obtaining of data related to gene expression
might add a predictive value to the current clinic
indicators, as they can provide new information that
is thought to be important for tumour classification.
Huang et al (Huang, 2003) obtained a small
number of “metagenes”, from which they developed
a prediction model for patient status identification
(suffering or not cancer disease). Later, a group of
researchers (Roberts, 2005) started from the
previously described study and used the GA for
selecting a subset of genes highly predictive of
lymphatic node status. The data set used can be
found on “http://www.matworks.com/company/
newsletters /digest/2005/nov/genalgo.zip”.
304
Miguélez M., Luis Pérez J., R. Rabuñal J. and Dorado J. (2008).
HYBRID SYSTEM FOR DATA CLASSIFICATION OF DNA MICROARRAYS WITH GA AND SVM.
In Proceedings of the Third International Conference on Software and Data Technologies - ISDM/ABF, pages 304-307
DOI: 10.5220/0001890803040307
Copyright
c
SciTePress

The paper complements the GA developed in
(Roberts, 2005) by using the SVM as fitness
function.
3 STATE OF THE ART
The selection or extraction of characteristics is
currently a very active research subject, as numerous
research areas handle data involving thousands of
variables (Guyon, 2003). Given its importance, a
high number of methods have been developed for
achieving a solution. The existing methods can be
classified in three main groups (Bonilla, 2006): the
filter approach (Furey, 2000), the wrapper approach
(Reddy, 2003) and the embedded approach (Guyon,
2002).
More recently is has been proved that the
learning based on the SVM statistical method is an
efficient, as well as robust, method for cancer
disease classification by using DNA data
microarrays (Nahar, 2007). Brown et al explained
firstly that SVMs are capable of precisely classifying
genes into functional categories; these will be based
on data expression from hybridisation experiments
performed with DNA microarrays. The comparative
study concluded that the SVM than uses a radial
basis function as kernel provides the best
performance (Brown, 1999). Furey et al have
developed a new method for analysing these data
classes by using SVM. These authors proved the
robustness of the SVM method by analysing two
data sets from different cells or tissues (Furey,
2000). Lee et al use SVM for classifying breast
cancer patients into three groups with well
differentiated life spans and they concluded that the
SVM is an efficient algorithm for this task (Lee,
2000).
3.1 GA Proposed by Roberts et al.
The GA described in (Roberts, 2005) uses a fitness
function that uses the classify tool from Matlab
Statistics Toolbox for discriminating two groups
(positive and negative lymph node status) together
with the variables subset that are being assessed. The
error rate of the generated classification model is
calculated by using the 10 fold cross-validation, and
the objective is minimise it (used as GA fitness
function).
The application of this GA results into a subset
of genes that, with a certain size (10), predicts the
status of the lymphatic nodes. According to
(Roberts, 2005), these genes (having 0.0225 error
rate) are the ones located as follows:
1149; 868; 929; 920; 1170;
792; 1050; 556; 680; 458
That means this 10 genes predict the status of the
lymphatic nodes of the patients with only a 2.25%
error rate (97.75% success).
4 PROPOSED METHOD
The method proposed here is a hybrid model that
combines GA with SVM. In contrast to the GA
described in (Roberts, 2005), the GA proposed here
is a variable length algorithm that enables the
obtaining of a minimum number of genes capable of
correctly performing the classification; instead using
the cross-validation, as Roberts et al indicated, it is
proposed to use SVM as GA fitness function. The
SVM used is WinSVM, whose implementation was
carried out by using the WinSVM source code
performed by Martin Sewell (Sewell, 2006).
The first test carried out, reaching not
completely satisfactory results, was the case of SVM
algorithm (without GA) on the whole existing genes
of the database (see Table 1). The specialisation that
occurs in the training cases is patently obvious.
Table 1: Confusion matrix for training data and Confusion
matrix for test data.
+ -
+ 33 0 (true pos)
- 0 46 (true neg)
+ -
+ 0 3 (true pos)
- 0 7 (true neg)
In order to achieve the desired results, a
complement was carried out: on one hand the GA is
used for obtaining the most representative genes for
classification (healthy or cancerous), whereas the
SVM is used as the fitness function to be minimised
in order to reach an optimal number of required
genes (see Figure 1).
Figure 1: Diagram of the proposed method.
Once the method to be followed has been
established, the following step is the search of SVM
Variable
Lenght GA
INPUT
12625 genes
OUTPUT
Cancer (yes/no)
- MINIMUM GENES NUMBER
- POSITIONS OF THE GENES
SVM
(fitness)
# genes
TRAINING
TRAINING
& TEST
N
er
of errors
HYBRID SYSTEM FOR DATA CLASSIFICATION OF DNA MICROARRAYS WITH GA AND SVM
305
optimal parameters (these parameters will be kept
invariables during the application of the GA and the
fitness assessment of the individuals by means of
SVM) by using the results obtained and showed in
(Roberts, 2005). Basing on genes that Roberts et al,
identified as optimum, several test were performed
with different kernels and varying, not only the C
and epsilon parameter values, but also the selected
kernel ones. The tests were carried out by using 79
inputs for training and the remaining 10 ones for
testing. The results corroborated the statement of
Brown et al (Brown, 1999), who indicated the SVM
that uses a radial basis function as kernel provides
better performances. According the remaining
parameters, it was concluded that the optimal ones
are the following:
Kernel: RBF-radial with gamma = 1.3
C=3 epsilon= 0.00001
The fitness function of the variable length-GA
will be, therefore, the SVM with the parameters
estimated as optimum.
Among the several GA parameter configurations
that were tested, the following is the one that
performs better:
Crossover rate: 90%
Mutation rate: 10%
Selection algorithm: Roulette
Population size: 1000
The results obtained with these parameters can
be observed in the following confusion matrix
(Table 2). The algorithm carries out a correct
learning and classifies with accuracy 100% the 79
training data.
During the testing, the SVM classifies correctly
8 of the 10 testing data. These results fully match
with those obtained by Roberts et al, who reported
that 2 of the 89 patients of the study were wrongly
classified.
Table 2: Confusion matrix for training data and Confusion
matrix for test data.
+ -
+ 33 0 (true pos)
- 0 46 (true neg)
+ -
+ 1 2 (true pos)
- 0 7 (true neg)
The following pseudocode describes how the
fitness function is calculated.
Find classification errors (fitness)
for i = 1 to N
input_svm_trainfile = empty
for j = 1 to genes_number_indv[i]
input_svm_trainfile (1-79) =
add Æ gene values of position
gene[j]
input_svm_testfile (80-89) =
add Æ gene values of
position gene[j]
end for
end for
Run SVM(parameters,input_svm_trainfile,
output_svm_trainfile,
input_svm_testfile,
output_svm_testfile)
% P = Number of genes. P is the penalty
% value of the individual according its
% length aiming for result improvement
% with the minimal number of genes
FITNESS = SVM_MSE_Train +
SVM_MSE_Test + P
Figure 2: GA fitness function.
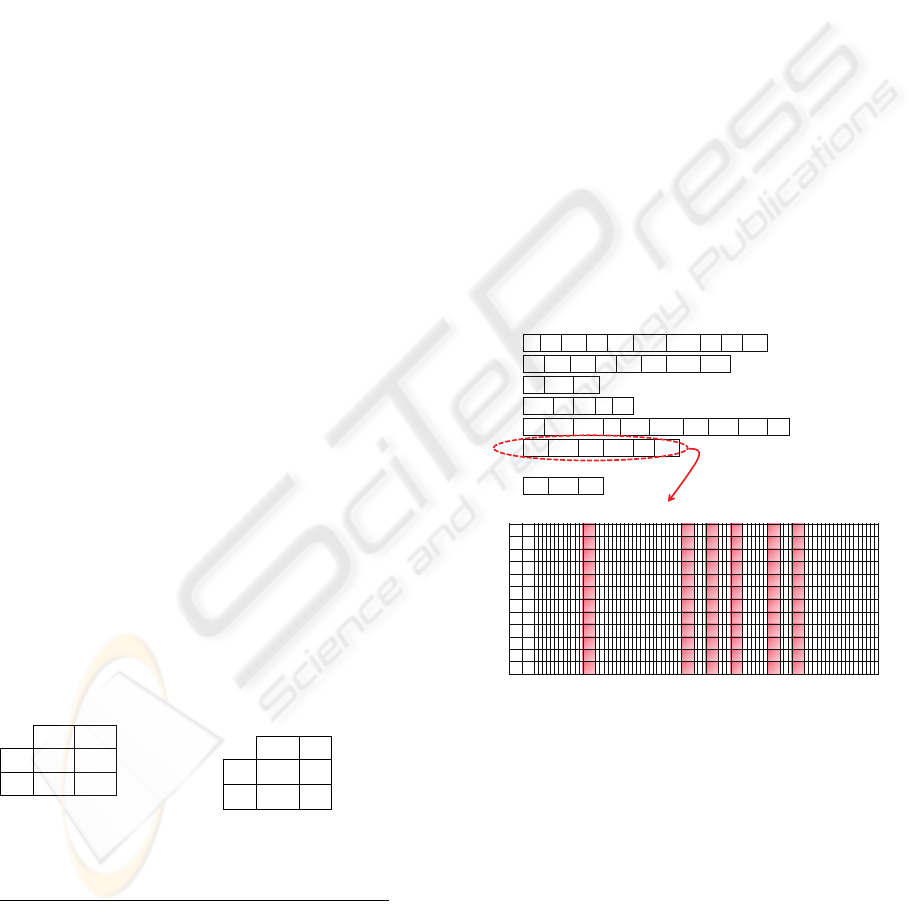
Firstly, it is selected a random number of genes
in every one of the N individuals of the population.
Once the initial population has been created, the
execution of the proposed GA can start. The GA will
create the SVM training file by selecting, within the
total number of genes (12625) and for each
individual, the locations that chromosome indicates,
as it shown in Figure 3.
4 89 368 39 279 11357 12567 26 71 489
58 379 629 90 280 290 10457 9356
71 5896 268
6527 8948139
47 3468 8937 2 1694 10278 279 3269 1111 47
955 1149 920 1168 71 903
…
973 2784 389
Ind .[1]
Ind .[2]
Ind .[5]
Ind .[4]
Ind .[6]
Ind .[3]
Ind .[N]
1 2 71 903 920 955 1149 1168 12625
……
…… … … …
Pat. 1
Pat. 2
Pat. 89
…
Figure 3: Evaluation of Individual (Huang et al., 2003).
5 RESULTS
The first test carried out was the application of the
developed GA to breast cancer data, following the
information provided by Roberts et al. The training
set contained 79 cases and the remaining 10 cases
were used for the testing set. The 10 optimal
locations indicated by Roberts et al were selected in
both sets.
After performing certain number of iterations,
the GA obtained a data set that, not only reduces the
ICSOFT 2008 - International Conference on Software and Data Technologies
306

number of required genes, but also improves the
success % obtained. These genes, located as
following indicated, are able to carry out the
classification with 2 errors on 10 cases of the testing
set.
868; 929; 920; 1170; 792; 1050; 556; 680; 458
The final GA result obtains only one failure on
10 testing cases and 7 optimal genes, therefore the
classification has improved: 3 genes less and lower
error rate. The 7 optimal genes are located as
follows:
929; 920; 792; 1050; 556; 680; 458
Once the proposed GA was tested with the data
reported by Roberts et al, this algorithm was applied
establishing 100 as maximum number of genes
(maximum length of the individual). In this way, the
GA will randomly select for each individual n
positions (genes) among the existing 12625 by
using, as it was during the previous case, 79 cases
for training and 10 for testing.
The final result obtained by the proposed GA is a
group of 6 genes that achieve 100% accuracy during
training and testing (Table 3).
Table 3: Testing confusion matrix.
+ -
+ 3 0 (true pos)
- 0 7 (true neg)
These genes are located as follows:
955; 1149; 920; 1168; 71; 903
6 CONCLUSIONS
This paper shows a general outline for the selection
and classification of genes obtained from data of
DNA microarrays. The proposed GA-SVM in this
paper starting with individuals of the GA provided
by Roberts et al achieves better predictive
capability, 90% success rate with 7 genes, that the
method proposed by Roberts, who achieved 80%
success rate with 10 genes. The results prove that is
a method capable of achieving highly precise
classifications. More specifically, in the case showed
here, the success rate has been 100% using only 6
genes (see Table 3).
ACKNOWLEDGEMENTS
This work was partially supported by the Spanish
Ministry of Education and Culture (Ref TIN2006-
13274) and the European Regional Development
Funds (ERDF), grant (Ref. PIO52048 and
RD07/0067/0005) funded by the Carlos III Health
Institute, grant (Ref. PGIDIT 05 SIN 10501PR) and
(Ref. PGIDIT 07 TMT011CT) from the General
Directorate of Research of the Xunta de Galicia and
grant (File 2006/60) from the General Directorate of
Scintific and Technologic Promotion of the Galician
University System of the Xunta de Galicia. The
work of Juan L. Pérez is supported by an FPI grant
(Ref. BES-2006-13535) from the Spanish Ministry
of Education and Science.
REFERENCES
Bonilla, D., Duval, B., Hao, J., 2006. A Hybrid GA/SVM
Approach for Gene Selection and Classification of
Microarray Data. In EvoWorkshops, LNCS 3907: 34-
44.
Brown, M., Grundy, W., Lin, D., Cristianini, N., Sugnet,
C., Ares, M., Haussler, D., 1999. Support vector
machine classification of microarray gene expression
data. University of California, Santa Cruz, Technical
Report: Ucsc-Crl-99-09.
Furey, T.S., Cristianini, N., Duffy, N., Bednarski, D.W.,
Schummer, M., Haussler, D., 2000. Support vector
machine classification and validation of cancer tissue
samples using microarray expression data.
Bioinformatics, 16(10):906-914.
Guyon, I., Elisseeff, A., 2003. An introduction to variable
and feature selection. In Journal of Machine Learning
Research, 3:1157-1182.
Guyon, I., Weston, J., Barnhill, S., Vapnik, V., 2002. Gene
selection for cancer classification using support vector
machines. Machine Learning, 46(1-3): 389-422.
Huang, E., Cheng, SH., Dressman, H., Pittman, J., Tsou,
MH., Horng, CF., Bild, A., Iversen, ES., Liao, M.,
Chen, CM., West, M., Nevins, JR., Huang, AT., 2003.
Gene Expression Predictors of Breast Cancer
Outcomes. Lancet, 361(9369): 1590-1596.
Lee, Y-J., Mangasarian, O.L., Wolberg, W.H., 2000.
Breast cancer survival and chemotherapy: a support
vector machine analysis. Dimacs Series In Discrete
Mathematics and Theoretical Computer Science, vol
55:1-10.
Nahar, J., Phoebe, Y., Shawkat, ABM., 2007. Microarray
classification and rule based cancer identification. In
International Conference on Information and
Communication Technology. Bangladesh.
Reddy, A.R., Deb, K., 2003. Classification of two-class
cancer data reliably using evolutionary algorithms.
Technical Report. DanGAL.
Roberts. S., 2005. Using Genetic Algorithms to Select a
Subset of Predictive Variables from a High-
Dimensional Microarray Dataset. Matlab Digest.
Sewell M., 2008. Martin Sewell web site.
http://martinsewell.com/
HYBRID SYSTEM FOR DATA CLASSIFICATION OF DNA MICROARRAYS WITH GA AND SVM
307
