
A PERFORMANCE EVALUATION OF AN ULTRA-THIN
CLIENT SYSTEM
Colin Pattinson and Tahir Siddiqui
Innovation North, Faculty of Information and Engineering Systems, Leeds Metropolitan University, Leeds LS6 3QS, U.K.
Keywords: Low-energy networking, ultra thin client, simulation.
Abstract: Power consumption of individual devices is often ignored in the development of computer networks. The
traditional approach to a local areas network, such as might be deployed in a cyber-café or classroom
environment, has a number of workstations attached to a server, where the workstations have very similar
specifications (and hence power demands) to the server. Intuitively, this means there is significant over
specification of the workstation, and that much of the capability of the device is not used, with
consequential wasted energy. Alternative topologies exist, particularly those which make use of thin client
technology, and are meeting with success particularly in developing countries, where cost and power
consumption take on a much greater importance. One such design is the ndiyo project, which is delivering
thin-client based network solutions to a number of nations, allowing IT support to be deployed in places
where it would not have otherwise been achievable. In this paper, we report our work in developing a
simulation model to allow us to study the behaviour and operation of ndiyo, offering us the opportunity to
carry out some “what if” analyses of the behaviour of such systems under differing network loads.
1 INTRODUCTION
The typical workstation / server approach to the
provision of networked IT, in which a number of
“workstations”, each of which is actually a stand-
alone computer system, are networked to a “server”
which acts as a central repository of files and as a
gateway to the wider network (the Internet) is very
well established. However, this design, whatever its
advantages, appears inefficient from the perspective
of resource utilisation. In particular, in situations
such as the typical cyber café, and also in classroom
situations where web browsing is the prevalent
activity, workstations are effectively little more than
smart terminals. The use as workstations of devices
similar in power to the server, suggests that
significant resource capacity may not be being used.
While this may be acceptable from the perspective
of resource use, since the machines are relatively
easily available; from the viewpoint of energy use,
different arguments can be made. In situations where
energy and other resources are at a premium, it
makes sense to seek out other mechanisms to deliver
the required processing power.
One alternative to the widespread deployment of
full-specification systems uses thin client
technology, taking advantage of the fact that most of
the processing can be carried out by the server, so
the client’s power can be reduced accordingly.
2 THIN CLIENT NETWORKS
2.1 Introduction
Thin client Networks have a long history; the
development of terminal servers is one area which
has a long association with thin client networks .
A Thin client (sometimes also called a lean
client) is that part of client-server architecture
networks which depends primarily on the central
server for processing activities, and mainly focuses
on conveying input and output between the user and
the remote server. In contrast, a thick or fat client
does as much processing as possible and passes only
data for communications and storage to the server.
Many thin client devices run only web browsers
or remote desktop software, meaning that all
significant processing occurs on the server.
However, recent devices marketed as thin clients
can run complete operating systems such as Debian
5
Pattinson C. and Siddiqui T. (2008).
A PERFORMANCE EVALUATION OF AN ULTRA-THIN CLIENT SYSTEM.
In Proceedings of the International Conference on e-Business, pages 5-11
DOI: 10.5220/0001904200050011
Copyright
c
SciTePress

GNU/Linux, qualifying them as diskless nodes or
hybrid clients (Wikipedia, 2007). The emphasis of
this paper is on such thin client networks, In fact the
devices discussed and tested in this paper are
referred as Ultra-thin client devices. (Nidyo, 2006)
2.2 Related Work
Previous work in the field has addressed a variety of
topics which have direct impact upon the operation
of thin client systems. Kelly (2002) reports on the
need to gather appropriate behavioural data to use as
input into a simulation system. Tolia et. al. (2006)
make reference to the fact that “adequacy of thin-
client computing is highly variable and depends on
both the application and the available network
quality”. The increasing deployment of wireless and
hand-held (battery powered) devices has led to
consideration of whether thin-client technology is
appropriate for such technologies, and
measurements have been conducted by Yang et. al.
(2003) reporting that such systems can operate
successfully even with the relatively high packet loss
rates which can be experienced with wireless
networks, and by Lai et. al, (2004) reporting lower
bandwidth requirements and hence better user
experience for thin client systems.
In light of these and other papers, we determined to
conduct a simulation-based experiment using a
particular thin-client implementation, in part to
explore the performance of such a thin-client
system, but also to determine the adequacy of
simulation methods in this application.
3 NDIYO PROJECT
This paper is focused on Nivo devices which are
ultra thin client devices developed for the Ndiyo
Project by Displaylink. Ndiyo is a not for profit
Cambridge based project which aims to provide
affordable and sustainable IT networks to the world.
The following section is an extract from the ndiyo
website (Ndiyo 2006).
3.1 “Nivo” Ultra Thin Client
A device called a Nivo (Network In, Video Out) is a
highly optimized piece of electronics, dedicated to
the purpose of displaying an interactive computer
desktop over a network. The server simply sends to
the nivo - over the network using a simple
compression scheme - the pixels that need to be
displayed on the user's screen. Modern wired
Ethernet networks (100Mbit or higher) are fast
enough for this approach to keep the user's screen up
to date. Nivo simply has an Ethernet (network)
socket, a low voltage power socket, sockets for
keyboard and mouse, and a VGA (monitor) socket.
This box replaces the entire PC in a conventional
computer workstation (Ndiyo, 2006).
3.2 The Network
We were given the task to test the performance of a
nivo network with between 2 to 30 nivo devices
attached to a single server. Below are the major
aspects of the nivo device’s network topology and
their operations:
• The Nivo network generally runs on a switched
100 Mb/s LAN, as Nivo devices usually
supports 100 Mb/s.
• In Nivo networks the transmitting packets have
areas of pixels, compressed in a lossless way,
transmitted over a simple transport layer which
provides very basic reliability - much simpler
than TCP. An approach of VNC transmitted
over UDP is best approximate for this situation.
• An update sent out from the server can be as
large as a whole screen refresh – perhaps 5MB –
or as small as a few bytes. The big updates will
be split into chunks of approximately1500 bytes
when carried in an Ethernet UDP packet.
Keystroke and mouse events coming back are
usually small, mouse event reports are around
10 bytes and reported at most about 50 times per
second.
3.3 Prerequisite
The major focus of this study was to predict the real
network bandwidth usage or at least some
reasonable approximations. However the aim of the
study is not only the network bandwidth usage but
other characteristics as well, in addition we wish to
measure those characteristics in different scenarios.
Some recommended scenarios are:
1. Large number of users using voice conversation
and web applications.
2. Large number of users using video and web
applications.
3. Large number of users using only web
applications.
ICE-B 2008 - International Conference on e-Business
6
LAN 100/85 Mb/s
10 bytes 2ms UDP
1500 bytes
2 ms UDP
W.S
2
W.S
3
W.S
1
W.S
5
W.S
4
Server
Switch.
ns2 object
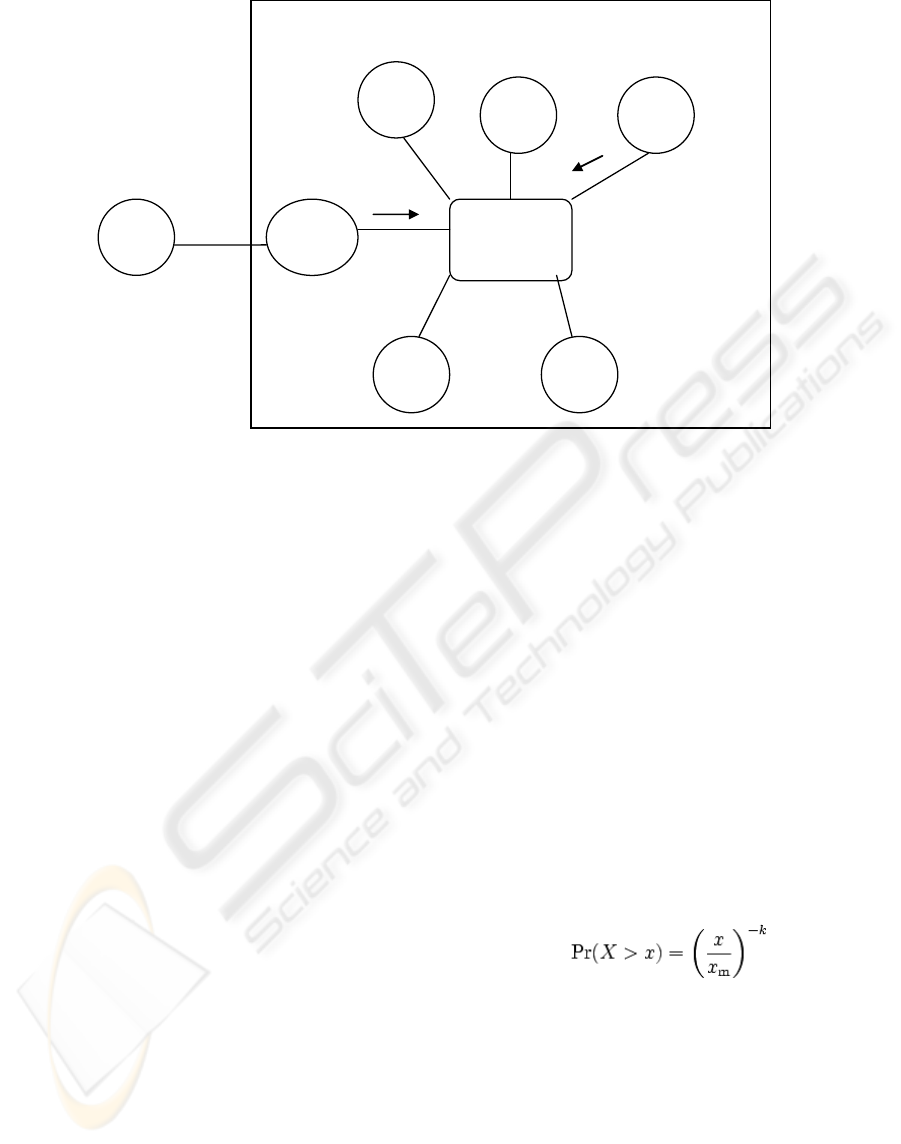
Figure 1: The simulation model.
4 SIMULATION MODEL
On the basis of the above defined structure of nivo
networks we have developed a simulation model in
to predict the usage of network bandwidth in
different scenarios. The details of the simulator and
the model developed are discussed further.
4.1 NS-2
All the simulations in this project are developed with
the help of Network Simulator 2 (NS-2). The latest
version of NS-2 i.e. NS-2.30 was used.
NS-2 is an event driven network simulator
developed by UC Berkeley. NS-2 implements traffic
behaviours, network protocols, routing, etc. for
simulation. Because it is open source software,
during the development many contributions have
been included from other researchers. NS-2 has
become a common tool for network researchers to
simulate and evaluate network related project.
Through the OTcl language interface users can
define a particular network topology, the protocols
and applications that they want to simulate and the
form of the output that they want to obtain from the
simulator quickly and clearly as a script. (Zhao and
Wu, 2006).
4.2 Thin Client Simulation Model
The available information about the network clearly
states that the Server should be sending a reasonable
amount of data at different intervals towards its
client on their requests, so the transmission of data is
duplex and in intervals from both sides.
The simulation model was designed in two
stages. First the topology of the network was
developed and tested (Figure 1). It is obvious from
the diagram that the topology here is that of a
switched LAN. The ideal bandwidth for an Ethernet
LAN is 100 Mb/s but generally performance is
nearer to 85 Mb/s due to different losses. After
selecting User datagram Protocol (UDP) packets as
the major traffic on the network some suitable traffic
generators were attached to both entities i.e. The
Server and the Workstations. As the data generated
from both sides is in intervals a Pareto traffic
generator is used, generating traffic using a
probability density function i.e.
This is sufficient to generate traffic at random
intervals but can be associated with other intervals
by its time interval parameters. The packet sizes are
designated according to the given information i.e.
1500 bytes size generated from the server and 10
bytes size generated from the workstations. The rate
at which these packets are generated depends upon
applications used by the users at the server.
Transmiting Node
A PERFORMANCE EVALUATION OF AN ULTRA-THIN CLIENT SYSTEM
7

5 OPERATION
5.1 Overview
In order to describe the operation reference is again
made to Figure 1. As soon as a workstation sends a
request to the server while running or initiating an
application the server starts responding by sending a
large amount of data in chunks of 1500 bytes with
assigned intervals i.e. with a delay of 200ms or
according to the application. There is a separate
traffic generator for each user therefore the volume
of data generated increases with the number of users.
Another major aspect in Traffic Generation is the
profile with which the generator is generating data.
This option is easily available in Pareto & CBR
traffic generators within NS-2.
The workstations are connected with the server
through an Ethernet switch hence the network
monitoring is performed at this point. In order to do
so we have used a perl script, this script calculates
the throughput at our preferred node at given time
intervals. The node selected here as mentioned
earlier is our network switch because all of the
network data will be flowing through it and the time
intervals of granularity at which the throughput of
switch was calculated is 1 sec.
5.2 Test Bed
Before developing our simulation according to the
Ndiyo scenario we created a test bed within our lab.
We wanted to compare our simulation data rates
along with the data rates of that traffic which was
generated while using VNC (Virtual Network
Computing) software. This utility is widely used in
order to achieve remote desktop facility over
different platforms i.e. it is platform independent.
The operation of VNC is almost the same as that of
the software used by the Ndiyo project, although
VNC provides a sophisticated connection setup and
delivery of data while using TCP. This differs from
the Ndiyo project which uses a VNC over UDP
approach in their software development. However,
for the purpose of exploring the activity of VNC,
this variation is not important, since we are not
measuring the relative performance or reliability.
We used Fedora Core4 and VNC packages
downloaded from www.Realvnc.com. VNC
provides a VNCVIEWER used at the user side and
the VNCSERVER to be run at the server.
VNCVIEWER provides an X11 session transmitted
from the server.
Different sessions of testing within our lab
provided us some more useful information such as if
the server is not able to support a large amount of
multiprocessing, this creates delay and a bottleneck
type situation. However this is not caused by the
lack of network bandwidth but to the low power of
the server (a Pentium4). In order to monitor traffic
Ethereal was used at the server but we were able to
monitor only that traffic associated to the server and
connected users.
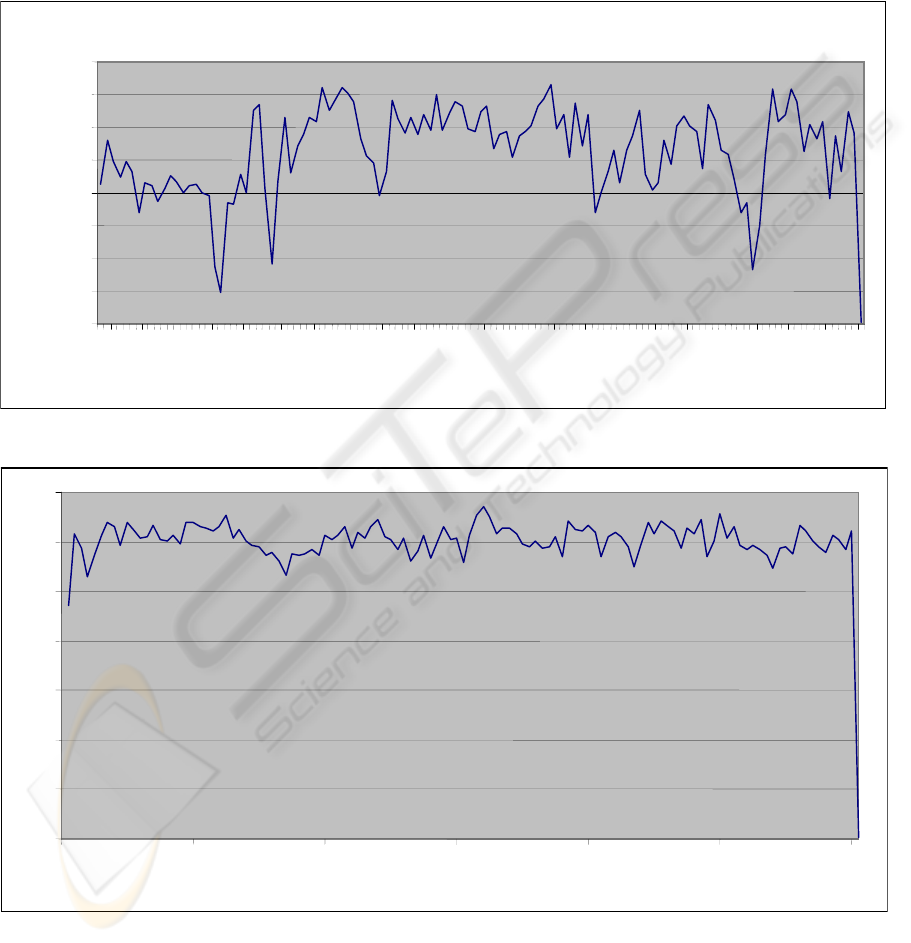
6 RESULTS
The data rates were recorded during our traffic
generation, which was mainly HTTP traffic, but
including some web streaming as well. These data
rates were used while producing the simulation
according to our test bed as the Lab Network is
almost same as our simulation model. Figure 2
shows that there are packet losses ranging from 2 to
almost 3 Mbits in short time intervals. The highest
peak achieved is just more than 3.5 Mbits which is
well within the actual network bandwidth of around
85Mb (eliminating different network losses from a
typical 100Mb LAN), but the processing of the
systems is taken error free as a default in these
simulations. With little difference the results from
the simulation compare with our measured
outcomes.
When the same data rate was used for 30 users in
our simulation model the output that was achieved is
depicted in Figure 3. The throughput was almost ten
times the 2 user throughput but yet again never
exceeded any problematic threshold. Another
interesting aspect of Figure 3 is that there were no
major packet or throughput drops during the
simulation. We believe that the small number of
applications used in our test bed meant the data rates
were at an average level.
As mentioned earlier, our simulations were
developed using data rates procured from our test
bed and with minimal applications used in order to
extend the data patterns using run length encoding to
create our own scenarios. Doing this, we developed
a simulation which produced a throughput as
depicted in Figure 3. These steps were taken in order
to create simulations which were directly related to a
practical scenario.
However in order to evaluate the bottleneck
situations it was necessary to create some
hypothetical scenarios where a number of
applications are used with each one having high data
generation rates. At this point it should be
ICE-B 2008 - International Conference on e-Business
8

understood that as NIVO devices are in their test
phase and are not produced in large quantities, we
were unable to get our hands on NIVOs. To collect
such of data rates we used another network
monitoring tool OBSERVER, which provided us the
facility to record data rates for different applications
while using Remote Desktop Control. Data rates for
different applications are shown in Table 1; however
as these data rates were collected while using
Remote Desktop Control the amount of TCP packets
is also included.
Table 1: Data rates used.
Remote
Video file
Remote Web
Streaming
Remote
HTTP
Traffic
500-2450
Kb/s
(25 fps)
727-900 Kb/s 97-150 Kb/s
These rates were obtained while using a single
user, in order to create scenarios for large number of
user the traffic generator we can easily run-length-
encode these rates. Also the data generation rates
depend on the nature of the file or web page, if the
data set is too rich then more pixel data has to be
sent over the network and this could cause an
increase in the data rates. Therefore different type of
video files, streams or web pages could generate
different amount of data. Hence the above examples
can be best described as samples for such type of
traffic. To create such a scenario where users are
using different applications at the same time, in
order to evaluate when a bottleneck situation occurs,
we developed simulations with combination of the
above data rates.
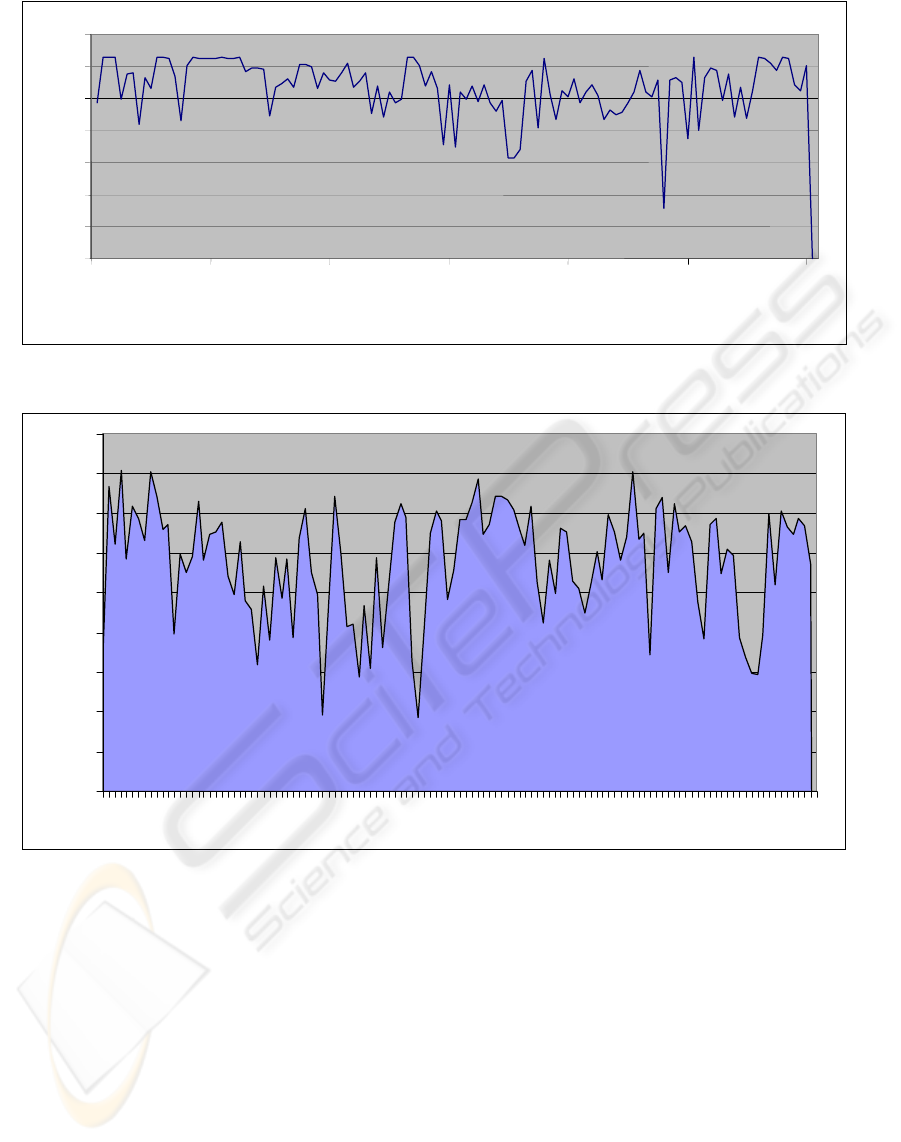
Figure 4 depicts a condition where only 2 users
are using the network. The amount of throughput is
almost double that recorded in previous simulations.
Whereas Figure 5 shows the situation where 30
users at a time are connected to the network and
utilizing different services.
It can be easily noticed that due to the increased
volume of data there is a significant amount of
packet drop; Figure 5 shows that there are packet
drops from around 6 Mbits to more than 10 Mbits
with in a very small period of time. However, it is
obvious that with a small number of users, the
available bandwidth is sufficient to support all of
them. The packet drops which are noticed at
different intervals during the simulation mainly
affect video file transmission, and could result in
jerks in a multimedia file. These packet drops can
also be a result of reduced processing capability at
the server as the number of applications used
increases.
7 CONCLUSIONS
A comparison of the four graphs reveals some very
obvious but important points:
• A LAN network can easily deliver multimedia
services to its users, but in case of Nivo devices
all of the processing is carried at the server end
and therefore data sent to the user from the
server is larger. Clearly, in the case of a video
file being executed by a user while using
network neighborhood facility all the processing
is done at the user end while only the file data is
being taken from the remote location, whereas
in our scenarios the whole processed screen is
sent over the network which ultimately results
in large amount of data transmission over the
network.
• Relating to our previous argument, if we
evaluate our thin client networks then it is
obvious that large number of user could be
accommodated by the network but only if we
execute those applications which generate lower
data rates. Multimedia applications can only be
executed if there is a small number of users (5-
10).Referring to our test bed results, web
streaming can be achieved but not if a large
number of users are using it simultaneously.
• Thin client networks such as Ndiyo can provide
affordable network solutions to those areas
where a user’s requirements are more related to
HTTP traffic rather than multimedia
applications.
REFERENCES
Haichuan Zhao, Jianqiu Wu. 2005. Implementation and
simulation of HSDPA functionality with ns-2. Master
Thesis in Division of Automatic Control, Department
of Electrical Engineering at Linköping Institute of
Technology.
Kelly, T. 2002. Thin-client Web access patterns:
Measurements from a cache-busting proxy. Computer
Communications Vol 25, Issue 1, March 2002, pp
357-366.
Lai, A.M, Nieh, J., Bohra, B.,Nandikonda, V., Surana,
A.P, Varshneya, S. 2004. Improving Web Browsing
on Wireless PDAs Using Thin-Client Computing in
Proc. 13
th
International Conference on World Wide
Web, New York pp. 143-154
A PERFORMANCE EVALUATION OF AN ULTRA-THIN CLIENT SYSTEM
9
The Ndiyo Project. 2006 http://www.ndiyo.org/systems
<last accessed 08/04/08>
Tolia, N. Andersen, D. Satyanarayanan 2006. Qualifying
Interactive User Experience on Thin Clients IEEE
Computer Vol 39, No. 3 March 2006. pp 46 -52.
Wikipedia definition of Thin client. From Wikipedia,
2007. http://en.wikipedia.org/wiki/Thin_client <last
accessed 08/04/08>
Pareto Distribution. .From wikipedia
http://en.wikipedia.org/wiki/Pareto_distribution <last
accessed 08/04/08>
Yang, S.J., Nieh J., Krishnappa, S., Mohla, A., Sajjadpour,
M. 2003, Web Browsing Performance of Wireless
Thin-Client Computing Proceedings of 12
th
International World Wide Web Conference Budapest,
pp. 68-79.
2 users (streaming)
0
0.5
1
1.5
2
2.5
3
3.5
4
1
7
13
19
25
31
37
43 49 55 61 67 73 79 85 91 97
103
109
115 121
Time (s)
Figure 2: Data for two simultaneous streaming users.
0
5
10
15
20
25
30
35
0 20 40 60 80 100 120
Time (s)
Figure 3: Data for 30 simultaneous streaming users.
ICE-B 2008 - International Conference on e-Business
10
2 users
0
1
2
3
4
5
6
7
0
20
40 60 80 100
120
Time (s)
Figure 4: Data for two simultaneous video users.
30 users
60
62
64
66
68
70
72
74
76
78
1 7 13 19 25 31 37 43 49 55 61 67 73 79 85 91 97 103 109 115 121
Time (s)
Throughput (Mbits/s)
Figure 5: Data for 30 simultaneous video users.
A PERFORMANCE EVALUATION OF AN ULTRA-THIN CLIENT SYSTEM
11
