
USING CO-OCCURRENCE TO CLASSIFY UNSTRUCTURED DATA
IN TELECOMMUNICATION SERVICES
Motoi Iwashita, Ken Nishimatsu and Shinsuke Shimogawa
NTT Service Integration Laboratories, Midori-cho 3-9-11 Musashino, Tokyo, Japan
Keywords:
Co-occurrence, Correspondence analysis, Telecom operation, Text mining.
Abstract:
A variety of services have recently been provided according to the highly-developed networks and personal
equipment. Connecting this equipment becomes more complicated with advancement of these day by day.
Because software is often updated to keep up with advancements in services or security, problems such as
no-connection increase and determining the cause become difficult in some cases. Telecom operators must
understand the situation and act as quickly as possible when they receive customer enquiries. In this paper,
we propose one method for analyzing and classifying customer enquiries that enables quick and efficient
responses. Because customer enquiries are generally stored as unstructured textual data, this method is based
upon a co-occurrence technique to enable classification of a large amount of unstructured data into patterns.
1 INTRODUCTION
A conventional fixed telephone service is simply pro-
vided by a telephone network. Because the net-
work structure is simple, it is easy to determine the
cause of service problems. Furthermore, telecom
operators with long-accumulated know-how can act
quickly. Recently, broadband infrastructures with
Asymmetric Digital Subscriber Line (ADSL) and op-
tical fibers have penetrated the telecommunications
industry. This trend has induced the expansion of
a variety of services, such as the exponential use of
the Internet, the provision of Voice over Internet Pro-
tocol (VoIP) and video distribution services, and se-
curity software countermeasures against virus attacks
on PCs. Therefore, the end-to-end network structure
has become complicated, considering the connection
of home equipment, such as a modem, and the setup
of its software. As a result, discovering the cause of
problems is difficult. Connecting service equipment
will continue to become more complicated in the near
future, if we consider the drive forwards ubiquitous
services.
Customer satisfaction decreases when a long time
is spent on restoration because discovering the cause
is difficult. Therefore, it is necessary to understand
the features of the problem first to resolve the situa-
tion by data classification.
The saved information is not classified as struc-
tured data, i.e., it is an unstructured data. Let us take
a customer phone enquiry about no-connection as an
example. There are several causes, such as failure of
the optical fiber, modem, or application. Both nor-
mal and strange situations are included in text such as
gthe connection to the Internet is OK, but e-mail can-
not be senth. Therefore, it is important to classify the
unstructured textual data with accuracy.
A text mining technique, such as morphological
analysis, syntax analysis, co-occurrence relation, etc.,
is effective (Ohsumi, 2006),(Sato et al., 2007),(Sulli-
van, 2001),(Toda et al., 2005). This technique is ap-
plicable to customer questionnaire analyses in prod-
uct development, word searches in portal sites such
as Google and Yahoo, term frequency analyses in
web logs (blogs) or customer generated media, article
classification by keyword in news articles, and eval-
uation indexes of a company’s image. Mainly mor-
phological analysis is applied in these areas to sur-
vey trends by analyzing the frequency of terms in se-
lected text. A keyword is extracted as a topic of a
sentence in terms of the features of the network struc-
ture (Masuo et al., 2001),(Ohsawa et al., 1997),(Cut-
ting et al., 1992),(Ho et al., 2001),(Leuski, 2001).
Clustering and co-occurrence related methods have
been proposed classify keywords and relate them to
synonymous terms, different words having the same
meaning, and synonyms, which have similar mean-
ings (Uejima et al., 2004), (Rodoriguezd et al., 1998).
12
Iwashita M., Nishimatsu K. and Shimogawa S. (2008).
USING CO-OCCURRENCE TO CLASSIFY UNSTRUCTURED DATA IN TELECOMMUNICATION SERVICES.
In Proceedings of the International Conference on e-Business, pages 12-17
DOI: 10.5220/0001905500120017
Copyright
c
SciTePress
An improved method was proposed for synonymous
term classification in fuzzy searches for the aim of
failure analysis (Naganuma et al., 2005). Simply
understanding failure trends and noting customer re-
quirements when analyzing an enquiry then analyzing
the word trends is not always effective. Understand-
ing the meaning of sentences is essential. There are
no effective methods to semantically analyze text that
are applicable to telecom management.
A text classification method from a semantic point
of view that considers the features of telecom services
and the co-occurrence of terms for classifying and an-
alyzing a large amount of unstructured data consisting
of customer enquiries is proposed. The difficulties in
analyzing textual data in telecom services when con-
ventional techniques are used is explained in Sec. 2.
Section 3 describes the features of telecom services.
Our classification method is proposed in Sec. 4, and
the results are discussed in Sec. 5.
2 DATA ANALYSIS IN TELECOM
OPERATIONS
2.1 Necessities of Data Classification
and Text Mining
In general, the telecom operator saves the customer
enquiry and the coping process as information. The
aim of this is to enable the finding of similar prob-
lems by searching with related keywords and to en-
able quick action when such problems occur. These
coping processes are effective for sharing the knowl-
edge among assigned telecom operators and for im-
proving their skills. Therefore, this method is useful
when problems happen. However, the drawback of
this method is that it is impossible to get an overview
of all the possible patterns of a problem and to es-
tablish coping processes for more complex problems
in advance. Therefore, it is necessary to establish an
effective coping process for customer enquiries, as-
sign optimal operators due to advance classification
of customer enquiries and survey the failure trend.
Information generally consists of text. It takes a
long time to analyze text word by word and to clas-
sify large amounts of textual data. Therefore, an ef-
fective method based on a text mining technique, such
as term frequency analysis, number of synonymous
words determination and related terms extraction is
needed.
2.2 Limitations of Morphological
Analysis
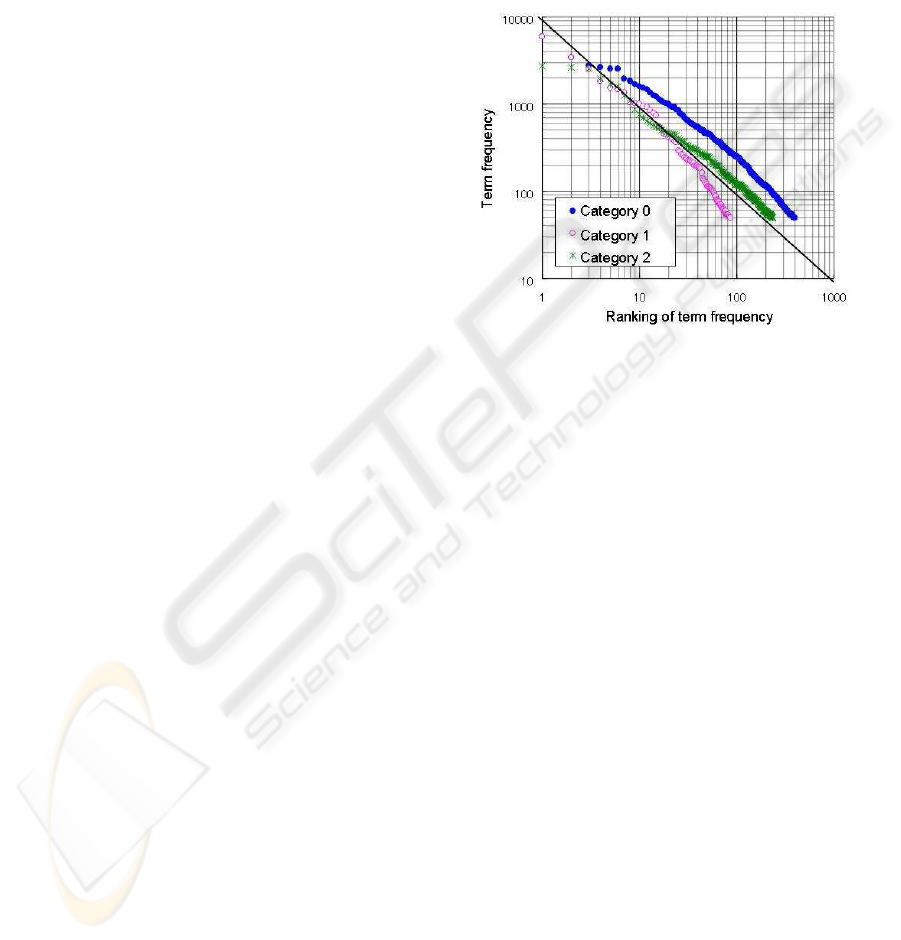
Figure 1 shows the relationship between term fre-
quency and its ranking for 10,000 customer enquiries
about telecom services. The terms were classified and
counted by morphological analysis, and those that ap-
pear more than 50 times are shown in Fig. 1.
Figure 1: Relationship between term frequency and its rank-
ing.
”Category 1” is text relating to equipment, such as
a modem, PC, telephone, etc., whereas ”Category 2”
is text relating to a failure phenomenon, such as setup
trouble, no-connection, cable breakdown, etc. ”Cat-
egory 0” means terms analyzed without considering
categories.
All the patterns show a n/1 feature, so they fol-
low a power law (Newman, 2005), (Zipf, 1949), as
is normal in general sentences. A power law implies
that there are many kinds of terms in the textual data
and means that there are many types of customer en-
quiries. Since the slope of Category 1 is steeper than
the other two, the terms used in that textual data are
limited compared with the terms in the other cate-
gories. On the other hand, the slope of Category 2
is gradual, which shows the variety of failure phe-
nomenon terms. These results show that it is possible
to only survey the terms with high frequency, such as
PC, telephone, internet, etc. However, it is necessary
to understand the relationships among the terms.
2.3 Limitations of Correspondence
Analysis
To classify into groups by term features, correspon-
dence analysis (Benzecri, 1992), (Hayashi, 1993),
(Takahashi, 1996) is applied. The terms with fre-
quency rankings higher than 400 were selected from
USING CO-OCCURRENCE TO CLASSIFY UNSTRUCTURED DATA IN TELECOMMUNICATION SERVICES
13
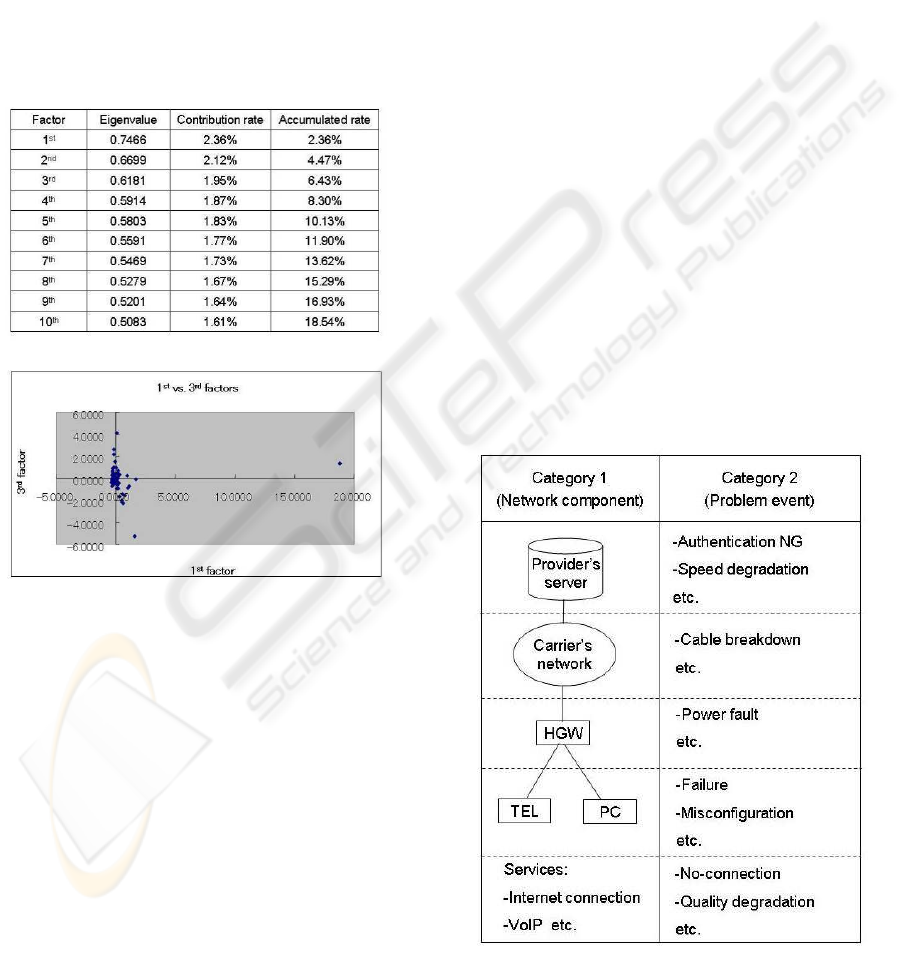
10,000 customer enquiries. The analysis of up to the
10th factor is shown in Table 1, and a graph of the 1st
and 3rd factors is shown in Fig. 2.
i-th contribution rate, r
i
, is calculated as follows.
r
i
= (Eigenvalue(i))/Σ
j
(Eigenvalue( j)) (1)
These results show the difficulty of describing the
features. This is because the accumulated contribu-
tion rate is under 20%, even considering the 10th fac-
tor, and most of the information is gathered in a small
area. Therefore, it is clear that we need some prepa-
ration before classification.
Table 1: Correspondence analysis.
Figure 2: Relationship between 1st and 3rd factors.
3 FEATURES OF TEXTUAL DATA
IN TELECOM SERVICES
The features of textual data in telecom services are
explained in this section. An operator writes down in-
formation about a customer enquiry. Therefore, the
style of the description deeply depends on the op-
erator. That is, the description style is not ordered.
There may be abbreviations of terms, wording that
only the specified operator can understand, and so
on. Moreover, there are many synonymous terms.
Taking service specifications of optical fibers as an
example, there are descriptions using general names
(e.g. optical service, Fiber-To-The-Home (FTTH)),
and special/abbreviated names for customer enquiries
(e.g. description of product name, abbreviation). Let
us consider a situation where optical and telephone
services are provided to a customer. It is difficult
to determine whether the cause of a problem is an
optical cable, modem failure, or application prob-
lem in the case of a phone call from a customer
about no-connection. Moreover, associated factors
that complicate the situation include partial trouble,
e.g. the Internet works whereas e-mail does not, or
no-connection because of software compatibility.
To summarize, it is difficult to apply a text mining
technique directly to raw textual data in telecom man-
agement for semantic/structural classification. There-
fore, we need a modification to distinguish the fea-
tures of telecommunication services. Telecommuni-
cation service such as internet connection, VoIP, is
generally provided by an end-to-end network con-
sisting of a telephone, PC, the carrier’s network, the
provider’s server, etc. Fig. 3. There is clearly an
event feature for each component of the network. We
can predict that the component, such as the service,
telephone, PC, and network, is strongly related to the
problem, such as failure, misconfigurated of set-up,
and cable breakdown, respectively. Therefore, by des-
ignating the network factor as one event and the prob-
lem as the other event, we can construct a semantic
representation. Moreover, if a problem occurs in one
piece of equipment in a network, it is expected to lead
to problems in the other component or to other events.
Figure 3: Telecom features categorization.
ICE-B 2008 - International Conference on e-Business
14
4 CLASSIFICATION METHOD
BASED ON CO-OCCURRENCE
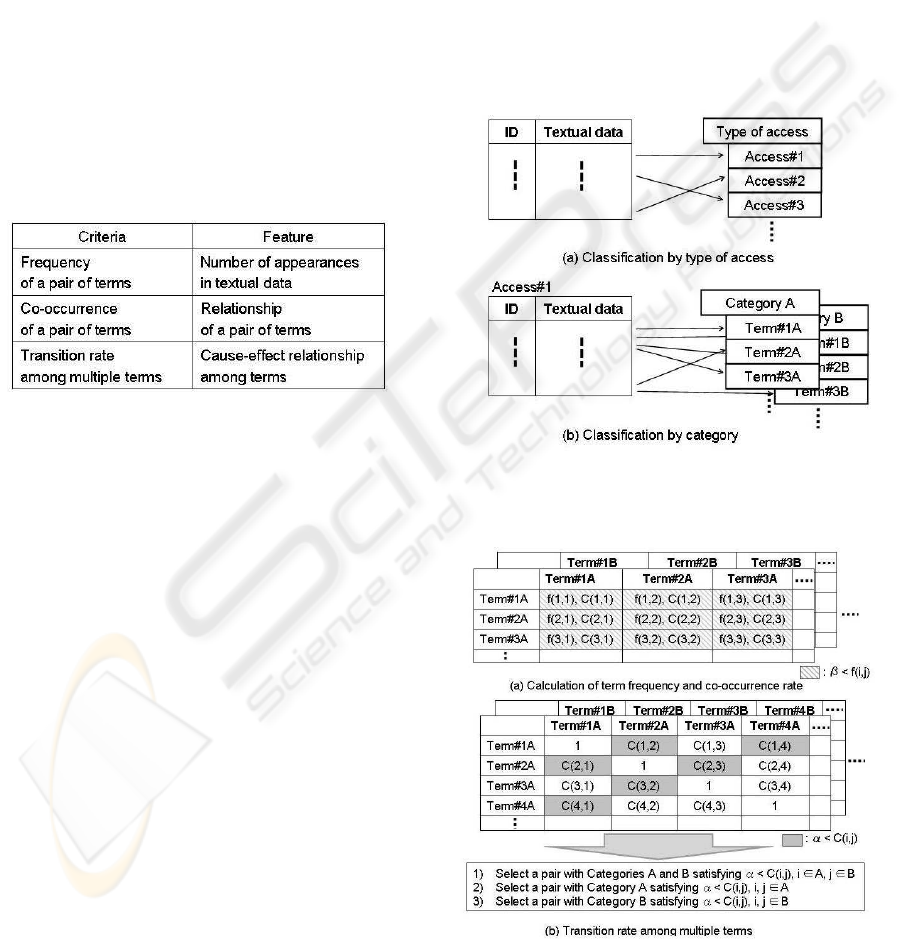
4.1 Framework of Classification
The requirement for textual data classification is
based on the ability to cover all textual data and to
fit the operator’s thinking. It is desirable that this
classification be determined from the viewpoints of
term frequency, co-occurrence, and cause-effect rela-
tionship, as shown in Table 2. Term frequency can
tell us what kind of customer enquiries often appear,
while co-occurrence tells us which terms are strongly
related. Cause-effect relationship tells us the relation-
ship among multiple terms such as network compo-
nent and porblem event.
Table 2: Criteria for classification.
Figures 4 and 5 show the frameworks in which
textual data is classified in terms of the previous three
criteria.
Classification framework:
• Procedure 1: Classification by type of access (Fig.
4 (a))
- Textual data is classified in terms of access, i.e.,
type of service, such as dial-up, ADSL, FTTH,
and so on.
• Procedure 2: Classification by category (Fig. 4
(b))
- Textual data is classified in terms of categories
based on morphological analysis. For example,
Category A means component, such as a service,
telephone, PC, modem, etc., while Category B
means the problem, such as no-connection, mis-
configuration, etc.
• Procedure 3: Calculation of term frequency and
co-occurrence (Fig. 5 (a))
- The frequency of both x and y appearing in tex-
tual data is represented by f(x,y). Let us se-
lect a pair in terms of a frequency greater than
β, where β is a given threshold. Then, calculate
co-occurrence as follows:
C(x,y)= f(x,y)/(f(x)+ f(y)− f(x,y)) (2)
for any x and y such that x,y ∈ A or B.
• Procedure 4: Transition among multiple terms
(Fig. 5 (b))
- Let us choose a pair of terms such that
C(x, y) ≥ α, where α is a given threshold.
Step 1: Select a pair with Categories A and B
satisfying α ≤ C(i, j), i ∈ A, and j ∈ B.
Step 2: Select a pair with Category A satisfying
α ≤ C(i, j), i, j ∈ A, and α ≤ C(i,k), i ∈ A, and
k ∈ B.
Step 3: Select a pair with Category B satisfying
α ≤ C(i, j), i, j ∈ B, and α ≤ C(i,k), i ∈ B, and
k ∈ A.
Figure 4: Term classification based on morphological anal-
ysis.
Figure 5: Calculation based on co-occurrence.
USING CO-OCCURRENCE TO CLASSIFY UNSTRUCTURED DATA IN TELECOMMUNICATION SERVICES
15
4.2 Transition of Relativity Among
Multiple Terms
The effectiveness of procedure 4 in the previous sec-
tion is explained in this section. For example, a cus-
tomer makes a general complaint that he/she is not
able to send e-mail from his/her PC as there is no-
connection with the Internet. The cause might not be
in the PC but in the modem setup in that case. There-
fore as a transitional way of thinking, we need rela-
tive keywords to suggest other causes. The relation-
ship among multiple terms should be clear. If we cal-
culate all co-occurrence values between the pairs of
terms in Categories A and B, we need a long calcula-
tion time n
2
× n
2
= o(n
4
). If we use procedure 4, on
the other hand, we can reduce the calculation time to
n× n = o(n
2
). This is because co-occurrence is cal-
culated for each category as a unit.
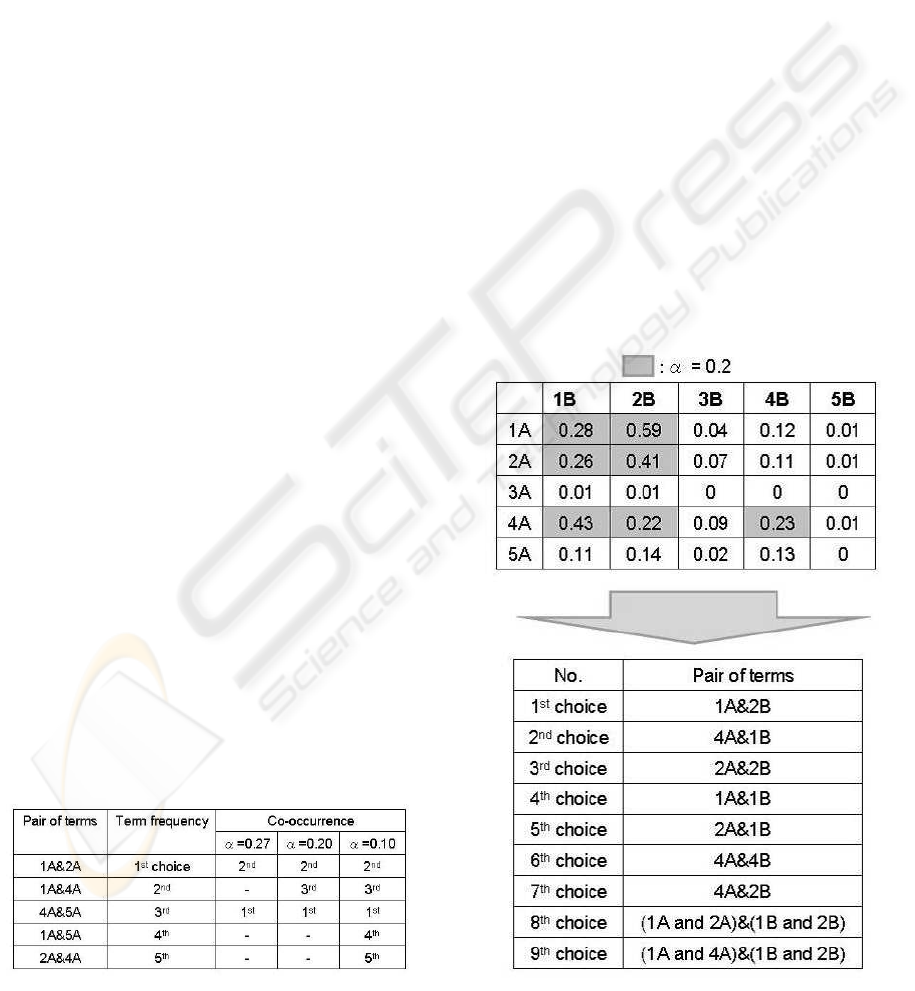
5 DISCUSSION OF RESULTS
5.1 Co-occurrence in a Category
The order of choice strongly depends on the thresh-
old in classification procedures. The relationship be-
tween term frequency and co-occurrence in textual
data from 1000 customer enquiries is shown in Table
3. 1000 customer enquiries are the field data saved
by telecom management for IP-based services during
the daytime at one day in 2007. Pairs of terms are
ordered by term frequency. There are three cases for
co-occurrence with the threshold as a parameter. The
selected pairs become similar in term frequency when
the threshold decreases. Because we screened and
chose pairs with high frequency by procedure 2, using
the choice decided by co-occurrence was effective for
representing the features of the text. The threshold is
given high value at first step. If the number of pairs is
small, α decreases as a second step. In this way, itera-
tion step of decreasing α can lead relationship among
terms.
Table 3: Choice of pair of terms.
5.2 Co-occurrence Among Categories
Co-occurrence among categories was calculated for
the textual data from 1000 customer enquiries, as
shown in Fig. 6. We chose the pairs marked that have
a value more than the given threshold. Then, seven
pairs of terms were selected by co-occurrence. More-
over, there were pairs that had a strong transition rate
in the same category. We merged those pairs and se-
lected them as the 8th and 9th choices Fig. 6.
Let us compare the proposed method and the
method using only term frequency for selecting pair
of terms. The frequency of 8th choice is 70 by
pair of terms-frequency, while that of the 8th choice
by the proposed method is 54. Because the differ-
ence between two choices is small in that amount of
data and the 8th choice by pair of terms-frequency
is smaller than the given threshold, it only represents
weak relationships in the features of the text. The pro-
posed method is possible to classify and understand
complicated structure through selecting and relating
strong co-occurrence. Therefore, the choice by co-
occurrence represents the features of the text.
Figure 7 shows the choice of pairs with the thresh-
Figure 6: Relationship between categories.
ICE-B 2008 - International Conference on e-Business
16
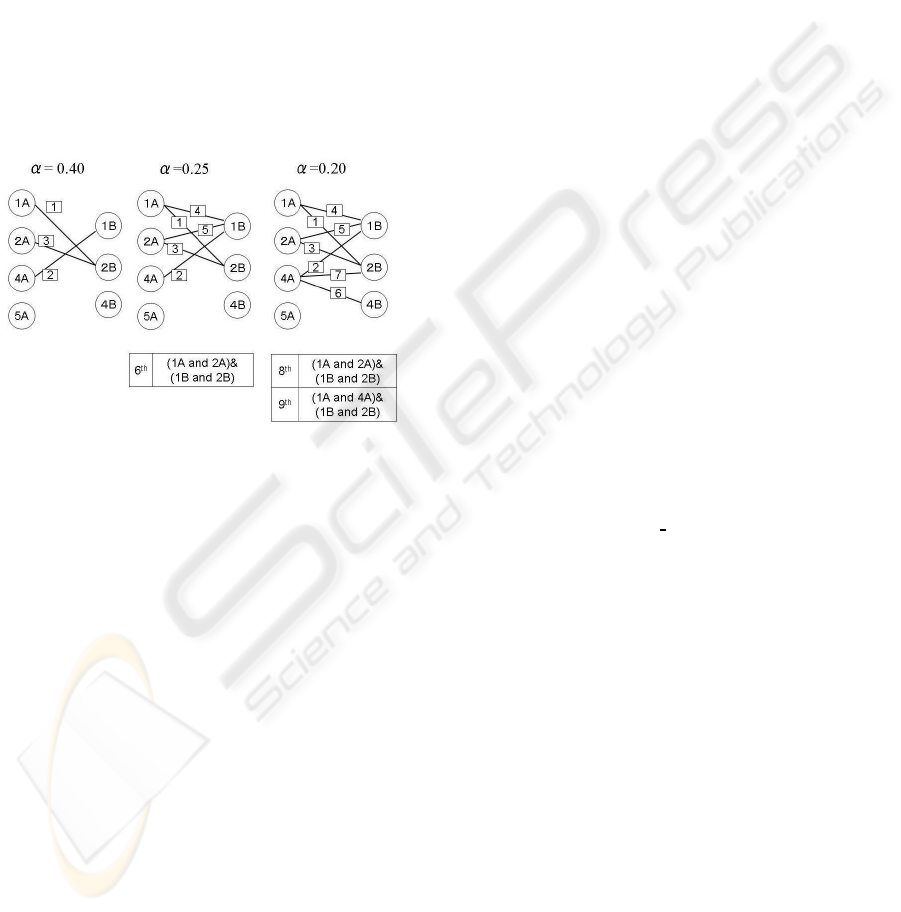
old as a parameter. The number of candidates in-
creases when the threshold decreases. This is because
of the weakness of co-occurrence. The number of
pairs with a transition rate grows when the threshold
decreases. The 6th choice is (1A and 2A) & (1B and
2B) when α = 0.25. 1A and 2A correspond to ”Inter-
net” and ”VoIP” respectively, while 1B and 2B cor-
respond to ”connection is OK” and ”no connection”
respectively. We can classify the text in a semantic
sense, e.g., ”Internet is OK, but VoIP has no connec-
tion”.
This type of proposed data classification can get
an overview of all the possible patterns of a problem
and establish coping processes in advance. Further-
more, it has possibilities to mine the potential cus-
tomer requirement that leads to new business.
Figure 7: Threshold and pairs.
6 CONCLUSIONS
A classification technique for customer enquiries is
needed due to the increasing complexity of the con-
nections in end-to-end networks in the telecom oper-
ating field. In this paper, we proposed one method
for analyzing and classifying customer enquiries that
enables quick and efficient responses. Because cus-
tomer enquiries are generally stored as unstructured
textual data, this method is based upon morphologi-
cal analysis and co-occurrence techniques to enable
classification of a large amount of unstructured data
into patterns. We applied the proposed method to
1000 customer enquiries and evaluated its effective-
ness. The method can apply not only to establish cop-
ing processes in advance but also to mine potential
requirement for new business.
We are currently conducting further study on ap-
plying this method to large amounts of data and on
determining a threshold for telecom operation.
REFERENCES
Benzecri, J.-P. (1992). Correspondence Analysis Hand-
book. Marcel Dekker.
Cutting, D., Kager, D., and Tukey, J. (1992). Scatter/gather:
A cluster-based approach to browsing large document
colelctions. In Proc. 15th Annual International ACM
SIGIR Conference on Research and Development in
Information Retrieval.
Hayashi, C. (1993). Quantification -Theory and Method.
Asakura-shoten.
Ho, X., Ding, C., Zha, H., and Simon, H. (2001). Automatic
topic identification using webpage clustering. In Proc.
2001 IEEE International Conference on Data Mining.
Leuski, A. (2001). Evaluating document clustering for in-
teractive information retrieval. In Proc. 2001 ACM
International Conference on Information and Knowl-
edge Management.
Masuo, Y., Ohsawa, Y., and Ishizuka, M. (2001). Document
as a small word. In Proc. JSAI 2001, International
workshop (LNAI2253), pages 444–448.
Naganuma, K., Isonishi, T., and Aikawa, T. (2005). Diamin-
ing: Text mining solution for customer relationship
management. Mitsubishi Technical Report, 79-4:259–
262.
Newman, M. (2005). Power laws, pareto distributions and
zipf’s law. Contemporary Physics, 46:323–351.
Ohsawa, Y., Benson, N., and H.Yachida (1997). Keygraph:
Automatic indexing by co-occurrence graph based on
building construction metaphor. In Proc. IEEE Forum
on Research and Technology Advances in Digital Li-
braries.
Ohsumi, N. (2006). Mining of textual data. recent trend
and its direction. http://wordminer.comquest.co.jp
/wmtips/pdf/20060910
1.pdf.
Rodoriguezd, M., Gomez-Ilidalgo, J., and Diaz-Agudo, B.
(1998). Using wordnet to complement training in-
formation in text categorization. In Proc. Recent Ad-
vances in Natural Language Processing.
Sato, S., Fukuda, K., Sugawara, S., and Kurihara, S. (2007).
On the relationship between word bursts in docu-
ment streams and clusters in lexical co-occurrence
networks. IPSJ, 48-SIG14:69–81.
Sullivan, D. (2001). Document Warehousing and Text Min-
ing. John Wiley.
Takahashi, S. (1996). Correspondence Analysis by Excel.
Ohm-sya.
Toda, H., Kataoka, R., and Kitagawa, H. (2005). Clustering
news articles using named entities. IPSJ SIG Techni-
cal Report, 2005-DBS-137:175–181.
Uejima, H., Miura, T., and Shioya, I. (2004). Improving
text categorization by synonym and polysemy. Trans.
on IECIE, J87-D-I, No. 2:137–144.
Zipf, G. (1949). Human Behavior and the Principle of Least
Effort. Addison-Wesley.
USING CO-OCCURRENCE TO CLASSIFY UNSTRUCTURED DATA IN TELECOMMUNICATION SERVICES
17
