
SURVEY OF CONSUMERS’ DECISION MAKING PROCESS FOR
ONLINE MUSIC SERVICE
Ayako Hiramatsu, Takahiro Yamasaki and Kazuo Nose
Osaka Sangyo University, 3-1-1 Nakagaito, Daito, Osaka 574-8530, Japan
Keywords: Consumer behavior, Modeling, Decision making, Online music service.
Abstract: This paper describes a survey of consumer behavior for online shopping, especially online music services,
because they are the most popular online shopping service in Japan. Based on Howard's consumer decision
model, questionnaires about decision making for online music services were given to 282 students. The
questionnaire results show that almost 90% of these students have downloaded from online music services,
and high school students use such services slightly more than university students.
1 INTRODUCTION
Internet penetration in Japan is remarkable. In 2006
its penetration rate was 68.5%, and the number of
Internet users was estimated at 87.54 million (White
paper, 2007). With the Internet’s diffusion, the
popularity of e-shopping continues to increase.
63.7% of all Internet users have been using e-
shopping for more than two years (Internet
Association Japan, 2005, 2006), and these numbers
are still growing. For marketing, understanding the
behavior of e-shopping users is crucial.
To understand consumer behavior, user models
are often constructed by analyzing the behavior data
of users. Concerning Internet users, there have been
some researches about online game models (Hsu and
Lu, 2004) and e-shopping users (Shih, 2004) based
on the Technology Acceptance Model (TAM) (Liu,
2007). Farag et al. also researched a model that
analyzed relationships between e-shops and real
shops (Farag et al, 2007). Moreover, Watanabe and
Iwasaki analyzed why consumers buy PCs through
the Internet (Watanabe and Iwasaki, 2007). However,
decision making processes based on various factors
and the relationship between them have not been
analyzed much, due to such difficulties as direct
observation and analysis of subjective condition of
users.
Our research aims to understand how consumers
make e-shopping decisions. Consumer behaviors for
real shops (Evans et al. 2006) were researched.
Based on Howard's famous consumer decision
model (Howard, 1989), we examined decision
making processes in online shopping. The target of
this analysis was narrowed to online music services,
which are the most popular online shopping service
in Japan. Questionnaires about decision making for
online music services were done with Japanese
consumers.
2 DECISION MAKING PROCESS
OF CONSUMERS
The Howard-Sheth buying behavior model presented
in 1969 is one important model that explains
consumer decision making. It explains the
complexity of the consumer decision making
process for incomplete information with an S-O-R
paradigm that consists of three components:
stimulus-organism-response. In this model,
consumers are motivated by perceiving a stimulus,
and then they shift to purchase after composing
concepts to learn purchases. Furthermore, it is
hypothesized that the problem is simplified as
learning continues. As a result of experimental
researches based on this model, Howard proposed
the simple consumer decision model shown in
Figure 1.
This simple consumer decision model is
comprised of six interrelated components, as shown
in Figure 1: information (F), brand recognition (B),
attitude toward the brand (A), confidence in judging
the brand (C), intention (I), and purchase (P). The
three central components (B, A, and C) comprise the
229
Hiramatsu A., Yamasaki T. and Nose K. (2008).
SURVEY OF CONSUMERS’ DECISION MAKING PROCESS FOR ONLINE MUSIC SERVICE.
In Proceedings of the International Conference on e-Business, pages 229-234
DOI: 10.5220/0001908302290234
Copyright
c
SciTePress
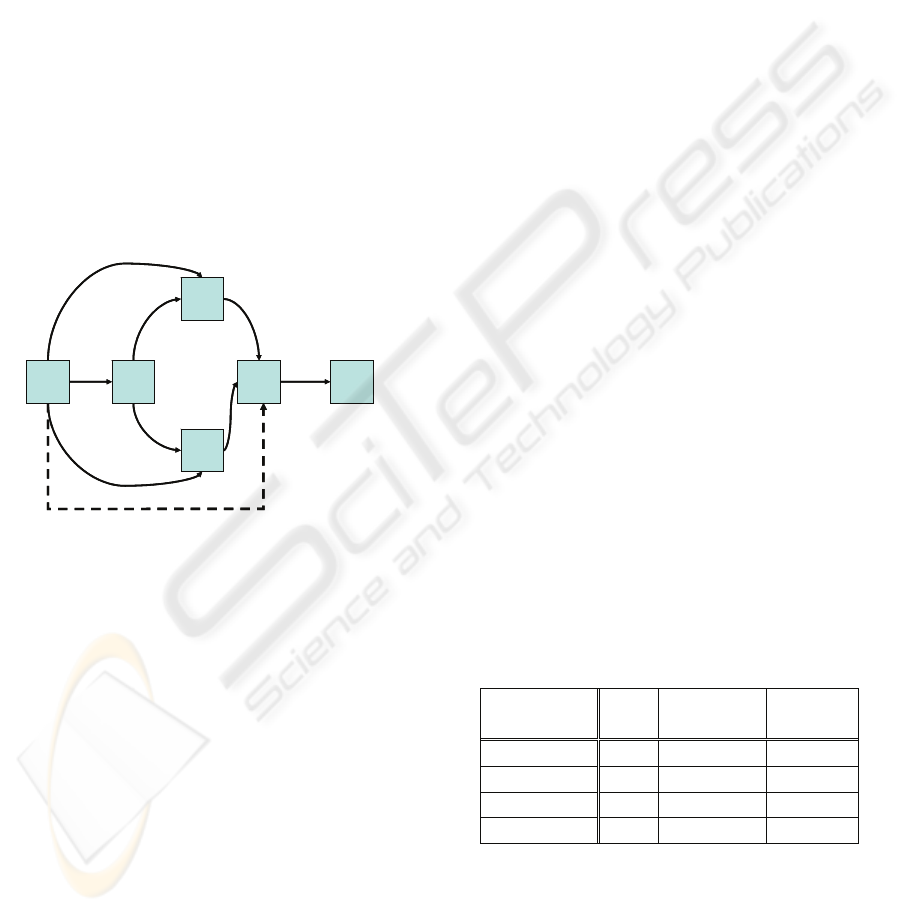
buyer's brand image and the ABCs of consumer
behavior.
“Information” (F) is what is received and stored.
The perception is stored, not the stimulus. “Brand
recognition” (B) reflects the extent to which the
consumer knows enough about the brand to
distinguish it from others. “Confidence” (C) is the
consumer's degree of certainty that his/her
evaluative judgment of a brand, whether favorable
or unfavorable, is correct. “Attitude” (A), the second
part of brand image, is the extent to which
consumers expect the brand to satisfy their particular
needs. “Intention” (I) is a mental state that reflects
the consumer's plan to buy a specified number of
units of a particular brand in a specified time period.
“Purchase” (P) shows whether the consumer really
does buy the brand. The influence from
“information” (F) to “intention” (I) is connected by a
dotted line. This arrow is added in routine problem
solving cases when consumers repeatedly buy a low-
price or a daily product.
C
BF
A
I P
Confidence
Information
Brand
recognition
Intention
Attitude
Purchase
C
BF
A
I P
Confidence
Information
Brand
recognition
Intention
Attitude
Purchase
Figure 1: Howard’s consumer decision model modified for
routine problem solving.
3 ANALYSIS TARGET
3.1 Online Music Service
With annual growth of about 2% since 2003, the size
of the visual contents market was estimated in 2005
at approximately 11.3 trillion yen (about $ 0.1
trillion), broken down as follows: visual contents/5.3
trillion yen, audio contents/1.0 trillion, and text
contents/5.0 trillion (White paper, 2007). Moreover,
the music or game contents market has especially
expanded. The usage rate of musical contents is
10.9%, which is the highest among such various
contents as visual contents, audio contents, and text
contents, of contents by Internet with PCs. Even
using contents through mobile Internet, the usage
rate of musical ring tones is the highest with 15.6%
and the rate of downloading songs is 14.0%, which
is second. Based on this present condition, we chose
online music services as our research subject for
online shopping through Internet.
3.2 Survey Items
To adapt Howard's model to online music services,
we considered the following survey items. Channels
for acquiring information about online music
services are considered communication among
friends and families, information from such media as
television, radio, and magazines, and such Internet
sources as e-mails and web pages. “Brand
recognition” corresponds to musicians and online
music service providers. For “Confidence”, we
considered confidence in artists and providers.
“Attitude” items include sound quality, price,
payment methods, data size, and outtakes or live
versions. “Intention” included consumer's income,
popularity, season, and advertising campaign.
“Purchase” shows whether consumers really buy the
music. This experiment examined the degree of
experience with online music services.
4 QUESTIONNAIRE SURVEY
4.1 Survey Condition
The questionnaires asked participants to indicate
their degree of agreement with the above items
based on a five-point scale: 5-strongly agree, 4-agree,
3-neutral, 2-disagree, and 1-strongly disagree. The
question details are shown in the appendix. 282
consumers (164 university students, 106 high school
students, and 12 others) answered the questionnaires.
Table 1: Results of download medium.
All
High school
students
University
students
Mobile phone 44.0% 64.2% 29.3%
PC 22.0% 9.4% 29.9%
Both 23.8% 19.8% 27.4%
Others 10.3% 6.6% 13.4%
Table 1 shows the ratios of download media.
Many respondents use mobile phones. From Table 1,
more than 80% of high school students and over
50% of university students use mobile phones,
including respondents who use both PCs and mobile
phones. Table 2 shows the numbers of download
ICE-B 2008 - International Conference on e-Business
230
experiences from online music services. Almost
90% of students have downloaded music.
Table 2: Number of download experiences.
All
High school
students
University
students
51~
37.9% 38.7% 37.8%
11 ~ 50 25.2% 28.3% 23.8%
2~10
23.8% 25.5% 23.2%
1 2.5% 0.9%
1.2%
0 10.6% 6.6% 14.0%
4.2 Questionnaire Results
The questionnaire results are shown in Table 3. The
symbols on the left row correspond to the number of
the questions shown in the appendix.
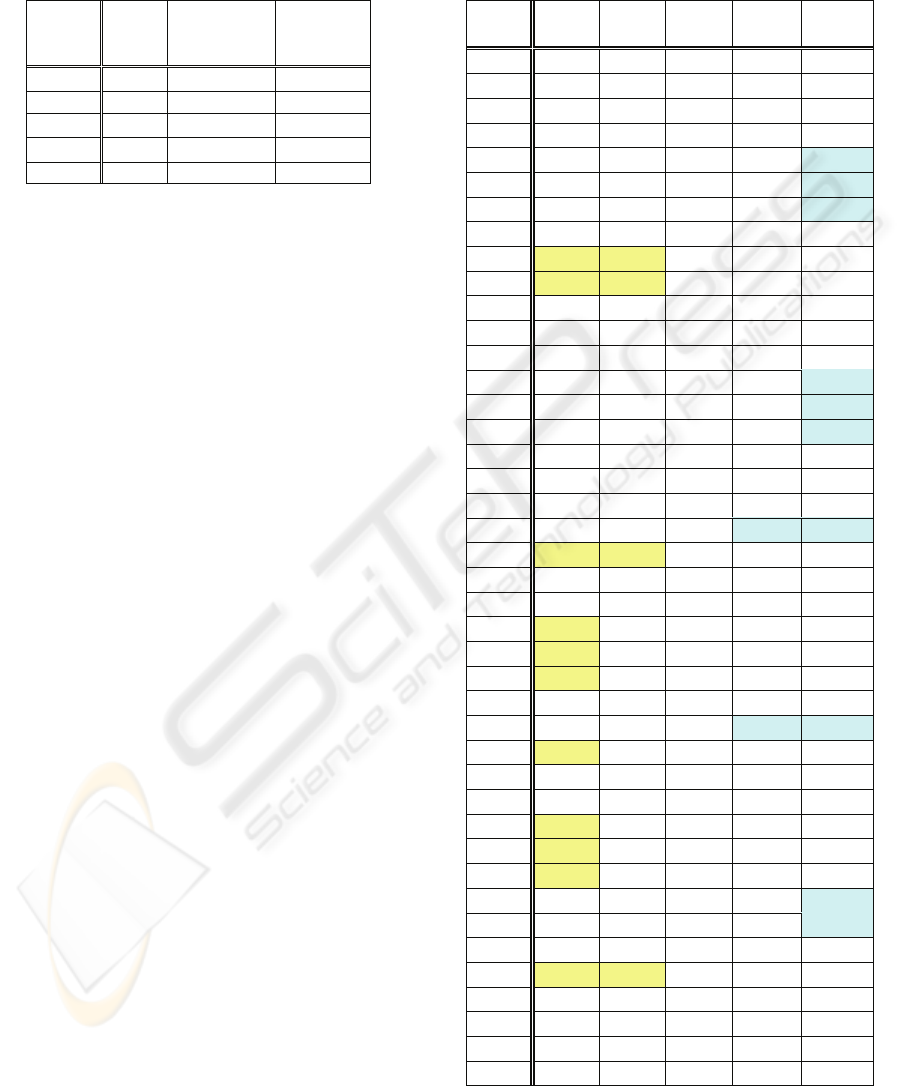
The results of Information questions reveal that
many students don’t think information by e-mail is
very important. Furthermore, information by radio is
not important because students do not usually listen
to radio. Such information from Internet as web logs
and web pages is relatively important. Direct word-
of-mouth is more important than word-of-mouth by
Internet. The most important information comes
from TV; clearly, students are greatly influenced by
TV.
As the results of “Brand recognition” questions,
students pay much more attention to the musicians
than delivery providers. Since consumers cannot
directly examine the products of online shopping, it
is often asserted that the reliability of the online
stores is very important. However, with online
music services, consumers can listen to trial songs as
products, providing them a change to examine
products almost directly. Therefore, consumers care
about songs as products, but they have little concern
about the reliability of providers.
The “Confidence” results for indirect purchases
suggest that consumers do not have confidence that
they will be satisfied with products and providers.
Therefore, many respondents answered “Neutral.”
Regarding questions about “Attitude,”
consumers are naturally interested in price. Trial
services, sound quality, and data size are clearly
important. Opinions are divided about accounting
systems.
For questions about “Intention,” consumers want
to repeatedly download and buy songs. Many
consumers also want to download new releases or
hit songs. Because the price of one song is cheap or
because they can be billed for their purchases, the
opportunity of income does not equal the
opportunity of downloading.
Table 3: Questionnaire results.
Strongly
agree
Agree Neutral Disagree
Strongly
disagree
F101
17.4% 34.0% 27.0% 9.9% 11.7%
F102
7.1% 28.0% 35.8% 12.4% 16.7%
F201
8.2% 24.1% 31.2% 17.4% 19.1%
F202
2.5% 15.6% 36.2% 19.1% 26.6%
F301
4.6% 5.3% 24.1% 18.1%
47.9%
F302
2.8% 13.5% 27.3% 20.9%
35.5%
F303
6.4% 14.2% 24.5% 17.0%
37.9%
F401
14.9% 35.1% 24.1% 13.5% 12.4%
F402 24.5% 25.2%
20.9% 14.2% 15.2%
F403 24.8% 29.8%
23.4% 8.2% 13.8%
F404
17.4% 32.6% 26.6% 12.4% 11.0%
F501
8.5% 27.7% 33.3% 13.1% 17.4%
F502
15.2% 20.9% 34.0% 14.2% 15.6%
F601
9.2% 14.5% 27.0% 17.4%
31.9%
F602
11.7% 17.4% 26.2% 14.2%
30.5%
F603
11.3% 13.1% 29.1% 14.2%
32.3%
F701
17.0% 29.4% 22.7% 13.5% 17.4%
F702
11.0% 27.3% 31.9% 16.0% 13.8%
F703
18.1% 22.7% 26.6% 13.1% 19.5%
B101
6.0% 16.0% 24.5%
21.3% 32.3%
B102 27.7% 29.4%
23.4% 9.2% 10.3%
C101
4.3% 13.1% 42.6% 21.3% 18.8%
C102
13.5% 22.3% 41.1% 13.8% 9.2%
A101 48.6%
23.0% 14.2% 5.7% 8.5%
A102 44.3%
17.7% 14.9% 8.9% 14.2%
A201 58.5%
22.0% 11.7% 4.3% 3.5%
A202
21.6% 19.1% 27.0% 17.4% 14.9%
A203
12.1% 13.1% 18.4%
23.8% 32.6%
A301 56.7%
19.5% 13.5% 4.3% 6.0%
A302
16.0% 12.4% 30.9% 16.0% 24.8%
A303
19.9% 21.3% 27.0% 11.3% 20.6%
A401 41.5%
19.1% 20.6% 8.5% 10.3%
I101 47.2%
25.5% 14.5% 7.1% 5.7%
I102 39.4%
23.0% 25.5% 5.3% 6.7%
I201
7.1% 6.4% 18.8% 23.4%
44.3%
I202
5.3% 5.3% 21.3% 19.5%
48.6%
I301
19.9% 18.8% 24.1% 14.2% 23.0%
I302 31.2% 25.5%
19.1% 9.9% 14.2%
I303
27.7% 22.7% 22.3% 10.3% 17.0%
I304
17.0% 18.1% 28.7% 14.9% 21.3%
I401
14.5% 14.9% 24.5% 18.4% 27.7%
I402
31.9% 19.9% 20.6% 9.6% 18.1%
SURVEY OF CONSUMERS’ DECISION MAKING PROCESS FOR ONLINE MUSIC SERVICE
231

4.3 Result Comparisons by Attributes
The questionnaire results were analyzed and
compared based on respondent attributes.
(a)Download medium
We compared the results by three types of
download medium attributes: mobile phones, PCs,
and both. Significance of the compared results was
found in “Information,” as shown in Table 4. Here,
“positive” means the rate of respondents who
answered “strongly agree” or “agree,” and
“negative” means the rate of respondents who
answered “disagree” or “strongly disagree.”
Consumers who use both mobile phones and PCs
tend to consider word-of-mouth information from
friends important. PC users tend to consider such
word-of-mouth information from Internet as web
logs important. However, although information by
Internet is identical to web logs, such differences
between mediums do not consist in information from
web pages provided by corporations etc. Mobile
phone users regard information from magazines and
TV as important. Furthermore, no users obtained
significant information from radio. Particularly, PC
users regarded information from radio as
unimportant.
Table 4: Comparison by download medium.
Positive Negative
Mobile
phone
PC Both
Mobile
phone
PC Both
F101
53.2% 40.3%
61.2%
21.0% 27.4%
14.9%
F201
25.0%
43.5% 38.8%
37.9%
33.9% 31.3%
F402 53.2%
46.8% 50.7%
25.8%
32.3% 28.4%
F403 62.9%
43.5% 53.7%
15.3%
32.3% 16.4%
F501 46.8%
21.0% 31.3%
22.6%
50.0% 19.4%
F502 41.1%
25.8% 34.3%
22.6%
40.3% 29.9%
F601
26.6%
14.5%
26.9% 41.1%
62.9%
49.3%
F602
32.3%
16.1%
37.3% 38.7%
58.1%
41.8%
F603
29.0%
16.1%
26.9% 38.7%
59.7%
46.3%
F701
48.4% 40.3% 53.7% 25.8% 32.3% 28.4%
F702
33.9% 41.9% 50.7% 30.6% 17.7% 26.9%
(b) Generation
Table 5 shows the compared results with high
school and university students. For “Information”
questions, high school students are clearly more
influenced by TV. Many university students gave
negative opinions about magazines. On questions
about radio, although answers from high school
students equally included both positive and negative
opinions, most university students had negative
opinions about radio. Regarding questions about
motivation in “Intention,” high school students gave
many positive answers about downloading new
releases or hit songs.
Table 5: Comparison between high school and university
students.
Positive Negative
High
school
University
High
school
University
F402 60.4%
41.5% 16.0% 38.4%
F403 70.8%
43.3% 10.4% 29.3%
F501
50.0% 28.7% 15.1%
40.9%
F502
50.0% 28.7% 16.0%
38.4%
F601
30.2% 19.5% 33.0%
60.4%
F602
36.8% 25.0% 34.0%
52.4%
F603
37.7% 15.9% 32.1%
56.1%
I301
55.7% 25.6% 25.5% 47.0%
I302 73.6%
45.1% 11.3% 32.9%
I303 65.1%
38.4% 16.0% 36.0%
I304
55.7% 21.3% 19.8% 49.4%
Table 6: Comparison by experience.
Positive Negative
Heavy Middle Light Heavy Middle Light
F101 58.9%
57.7% 39.4%
17.8%
15.5% 29.8%
F201 37.4%
36.6% 24.0%
29.0%
33.8% 46.2%
F202 21.5%
16.9% 15.4%
39.3%
43.7% 53.8%
A101
64.5%
81.7%
72.1% 19.6%
5.6%
14.4%
A102
57.9%
67.6%
62.5% 29.0%
18.3%
20.2%
A401 69.2%
59.2% 52.9% 14.0% 18.3% 24.0%
I301 48.6%
40.8% 26.9% 30.8% 33.8% 46.2%
(c) Experiences
The compared results by experiences are shown
in Table 6. “Heavy” shows the rate of users who
have downloaded more than 51 times. In the same
way, “Middle” is between 11 and 50 times and
“Light” is less than 10 times. Experienced users
believe that information from web logs, BBS, and
word-of-mouth from friends are important. “Trial
service” is regarded as important by all category
users. But middle experienced users only consider it
relatively important. The more experienced users
also care more about data size. For questions about
motivation in “Intention,” only seasonable songs are
important for heavy users, though the other
questions show no differences by experiences.
ICE-B 2008 - International Conference on e-Business
232

5 CONCLUSIONS
This paper described a survey of consumer decision
making process for online shopping, especially
online music services, the most popular service in
Japan. Based on Howard's consumer decision model,
questionnaires about decision making for online
music services were done with Japanese 282
students. Differences between generations download
mediums, and experiences were analyzed. As future
work, we need more examinations with improving
questionnaires etc.
REFERENCES
White paper, (2007). Information and Communications in
Japan
http://www.johotsusintokei.soumu.go.jp/whitepaper/ja
/h19/index.html
Internet Association Japan, (2006). Internet white paper
2006, Impress.
Internet Association Japan, (2005). Internet white paper
2005, Impress.
Chin-Lung Hsu and His-Peng Lu, (2004). “Why do people
play on-line games? An extended TAM with social
influences and flow experience,” Information &
Management, 41, pp.853-868.
Hung-Pin Shih, (2004). ”An empirical study on predicting
user acceptance of e-shopping on the Web,”
Information & Management, 41, pp.351-368.
Chuanlan Liu, (2007). Modeling Consumer Adoption of
The Internet as a Shopping Medium, Cambria Press.
Sendy Farag, Tim Schwanen, Martin Dijst, and Jan Faber
(2007). “Shopping online and/or in-store? A structural
equation model of the relationships between e-
shopping and in-store shopping,” Transportation
Research Part A, 41, pp.125-141.
Kazuo Watanabe and Kunihiko Iwasaki, (2007). “Factors
Affecting Consumer Decisions about Purchases at
Online Shops and Stores,” Proceedings of IEEE
CEC/EEE 2007, pp80-87.
Martin Evans, Ahmad Jamal, and Gordon Foxall, (2006)
Consumer Behavior, John Wiley & Sons.
John A. Howard, (1989). Buyer Behavior in Marketing
Strategy, Prentice Hall.
APPENDIX
[Questions]
“Information”
- Direct word-of-mouth
F101: Do you think word-of-mouth information
from your friends is important?
F102: Do you think word-of-mouth information
from your family is important?
- Word-of mouth by Internet
F201: Do you think the information from web
logs or BBS without registration systems is
important?
F202: Do you think the information from BBS
with registration systems is important?
- E-mail
F301: Do you think direct mail is important?
F302: Do you think the information from e-mails
for members only is important?
F303: Do you think the information from fan
clubs is important?
- TV
F401: Do you think the information from TV
commercials is important?
F402: Do you want to get TV programs theme
songs?
F403: Do you think the information in musical
TV programs is important?
F404: Do you want to get movie theme songs?
- Magazines
F501: Do you think the advertisements in
magazines are important?
F502: Do you think articles about musicians in
magazines are important?
- Radio
F601: Do you think the information from radio
commercials is important?
F602: Do you think the information from radio
music programs is important?
F603: Do you think information about musicians
from special radio programs is important?
- Web pages
F701: Do you think the information of hit charts
on web pages is important?
F702: Do you think the information from video
delivery web sites is important?
F703: Do you think the information in musician
web sites is important?
“Brand recognition”
B101: Do you try to learn a lot about music
delivery providers?
B102: Do you try to learn a lot about the
musicians whose songs you are downloading?
“Confidence”
C101: Do you have confidence in the reliability of
delivery providers before purchasing?
C102: Do you have confidence that you will be
satisfied with a particular musician’s songs before
downloading?
SURVEY OF CONSUMERS’ DECISION MAKING PROCESS FOR ONLINE MUSIC SERVICE
233

“Attitude”
- Trial
A101: Do you think a trial service in delivery sites
is important?
A102: Even if you know the song, do you listen to
a trial of it?
- Sound quality
A201: Do you pay attention to sound quality?
A202: Do you think such alternative versions as
live recordings and outtakes are important?
A203: Are you satisfied with the sound quality by
which you can judge the song?
- Accounting system
A301: Do you think price is important?
A302: Do you think a monthly fee is a better
accounting system?
A303: Do you prefer payment per song as an
accounting system?
- Data size
A401: Do you consider the data size of songs?
“Intention”
- Service
I101: Do you think the possibility of re-download
is important?
I102: Do you think the payment method is
important?
- Money
I201: When you have extra money, do you want
to download a song soon?
I202: On payday, do you want to download a
song soon?
- Motivation
I301: Do you want to download seasonable
songs?
I302: Do you want to download new releases?
I303: Do you want to download hit songs?
I304: Do you want to download award-winning
songs?
- Campaign
I401: If you can get one free song by purchasing
of ten as part of a special campaign, do you want
to download?
I402: If you can get unlimited songs much for 300
yen (about $2.7) for a limited time, do you want
to download?
ICE-B 2008 - International Conference on e-Business
234
