
EMOTION ASSESSMENT TOOL FOR HUMAN-MACHINE
INTERFACES
Using EEG Data and Multimedia Stimuli Towards Emotion Classification
Jorge Teixeira, Vasco Vinhas, Luís Paulo Reis and Eugénio Oliveira
FEUP - Faculdade de Engenharia da Universidade do Porto, Rua Dr. Roberto Frias s/n, Porto, Portugal
DEI - Departamento de Engenharia Informática, Rua Dr. Roberto Frias s/n, Porto, Portugal
LIACC - Laboratório de Inteligência Artificial e Ciência de Computadores, Rua do Campo Alegre 823, Porto, Portugal
Keywords: Medical Signal Acquisition, Data Analysis and Processing, Emotion Assessment, Electroencephalography.
Abstract: The identification and assessment of human being emotional states belongs to one of the primordial
objectives of the scientific research in disparate areas such as artificial intelligence, medicine or psychology.
The main objective of this project is related to automatic assessment of a subject’s basic emotional states by
using electroencephalography as a source for biometric data acquisition. This evaluation is based on
predefined mechanisms of emotional induction, as well as specific methods and tools capable of data
analysis and processing. From the experimental results attained in several experimental sessions and
through the support tools developed, the most pertinent conclusion extracted from this work refers to the
capability of effectively performing automatic classification of the subject’s predominant emotional state.
The emotional conditions were induced through the presentation of specific visual multimedia contents. The
success rate of this tool, compared against the self assessment interviews carried out immediately after the
experimental session, was approximately 75%. It was also experimentally concluded that female subjects
are emotionally more demonstrative than the male ones.
1 INTRODUCTION
Emotions play an important role in all human
activities, from the trivial to the most complex ones.
This significance is translated both in terms of
reality perception and even in the cognitive decision
process. Meanwhile, computers have gained such a
relevant presence in the modern society that they
have been introduced in almost every aspect of it,
enhancing the magnitude of ubiquitous computing.
Having these two realities in mind – the
importance of emotional states and the necessity of
daily interaction with multiple devices – merging
them would be a great improvement. By providing
the distributed computer systems with the perception
of their users’ emotions, the applications would be
able to adjust their interface, promote and suggest
functionalities accordingly. It is believed that this
approach would increase the global system’s
transparency and efficiency as its dynamism would
follow in the encounter to user’s intentions and
temper.
Alongside the ubiquitous computing, multimedia
contents are becoming constantly more complex and
seemlier to reality, enabling a greater action
immersion sensation, the primitive absolute need of
achieving a perfect match between audiovisual
contents and the audience desires is still present and
constitutes the main key to the industry success.
The alliance between the multimedia contents
choice possibility that enables the audience to
individually presence what desires and accurate
emotional states detection systems leads to
subconscious individual interaction between the
audience and the multimedia control system,
potentiating the perfect match between content and
individual audience desires.
This study illustrates an application that enables
automatic emotional state assessment using minimal
invasive solutions.
2 METHODOLOGIES
The emotional induction approach defines the
number and main characteristics of the emotional
states that will be reproduced in the subject and it
can be developed through two main different paths.
In order to guarantee the control of the induced
emotions and optimize the biometric device (EEG)
185
Teixeira J., Vinhas V., Paulo Reis L. and Oliveira E. (2008).
EMOTION ASSESSMENT TOOL FOR HUMAN-MACHINE INTERFACES - Using EEG Data and Multimedia Stimuli Towards Emotion Classification.
In Proceedings of the International Conference on Signal Processing and Multimedia Applications, pages 185-188
DOI: 10.5220/0001932901850188
Copyright
c
SciTePress
used, the emotions’ induction throw image stimuli is
the most suitable method for this study since its
quality is greater and more realistic than using other
kinds of approaches as audio and video stimuli
(Chanel, 2005). The IAPS library is an indicated
emotional induction method, as it has been widely
used throw the research community with similar
intentions (Aftanas, 2002) (Chanel, 2005) (Müller,
1999). All the pictures are classified according to
their valence, arousal and dominance. The picture
selection was based on the concept that the
detection, post-analysis and interpretation of the
biosignals became more accessible as the pictures
are stratified accordingly to its valance value
(Aftanas, 2006) (Takahashi K., 2004). For these
experimental sessions two discrete emotional states
were studied: joy and sadness. It was added a neutral
state for control purposes.
The demanding task of finding a specific area of
the skull where the brain activity is sufficiently high
to detect oscillations, according to the emotional
state of the subject, undertook significant
improvements with recent studies developed during
the last decade (Chanel et al, 2005)(Aftanas et al,
2006) (Aftanas et al, 2004) (Rusalova et al, 2003)
(Ebrahimi et al, 2003). The emotional induction
produces, in parallel with physiological responses,
individual patterns along brain wave amplitude.
These patterns have been studied and interpreted in
order to locate a suitable position on the human skull
where there are strong evidences between specific
brain waves oscillations and emotional induction.
Accordingly to Aftanas (Aftanas ET AL., 2006),
Frontal and Central areas of the brain are the ones
where is most likely to occur slight changes of the
amplitudes’ brain waves due to emotional states.
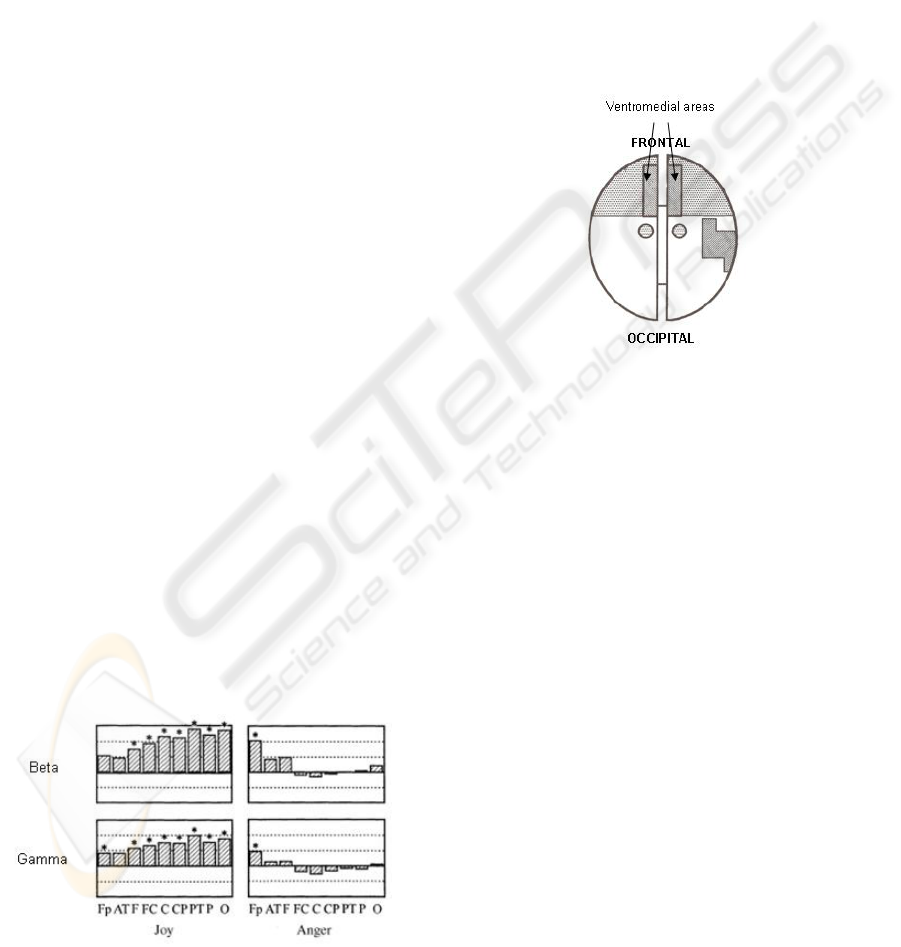
In Figure 1 it is depicted the amplitude variations
along all the brain areas for Joy and Anger. By
observing it, it is denoted a higher variation of the
waves’ amplitude in the Frontal-Central and Central
areas for the Anger case. For the Joy case, both
Frontal-Central and Central brain areas have a high
value for the amplitudes’ brain waves variation.
Figure 1: Electrical Brain Activity Variation (Aftanas,
2006).
Before Aftanas’s studies, Damásio concluded
that patients with the ventromedial areas damaged
have significant changes on their emotional
behaviour (Damásio, 1994). In Figure 2, it is
represented the location of the ventromedial areas,
which are integrated in the Frontal-Central and
Central areas of the brain.
Taking in account the two opposite emotional
states, joy and sadness, as well as the physical
limitation of the EEG (one active electrode plus two
references), and based on the studies previously
developed, the most appropriate area of the skull to
locate the active electrode is the middle line,
between the Central and the Frontal area, in the
ventromedial areas.
Figure 2: Ventromedial areas. Adapted (Damásio, 1994).
Apart from the electrode location, special
attention was given to samples choice and these
procedures were carefully followed during the
experimental sessions. For this reason, a subject
exclusion principle was created. Before each
experimental session, a survey had to be filled by the
subject in order to discard eccentric subjects –
epilepsy, alcohol, caffeine, etc. A total of twenty
eight subjects, seventeen males and eleven females,
all right-handed, aged eighteen-thirty years old took
part in this study.
3 RESULTS
The experimental results are presented here, starting
with the achieved results and the proof of the initial
hypothesis.
3.1 Results Achieved
From the experimental sessions conducted two
different kind of results were achieved: the first
belongs to the visual analysis performed and is
based on the pattern-behaviour defined for the high
frequency brain waves; the other concerns to the
results obtained from the application of the EAT to
SIGMAP 2008 - International Conference on Signal Processing and Multimedia Applications
186
the biomatric data captured during the experimental
sessions.
The gathered biometric data showed a high
degree of similarity between the behaviour of the
high frequency brain waves and the hypothesis
previously stated when the predominant emotional
state of the subject is coincident.
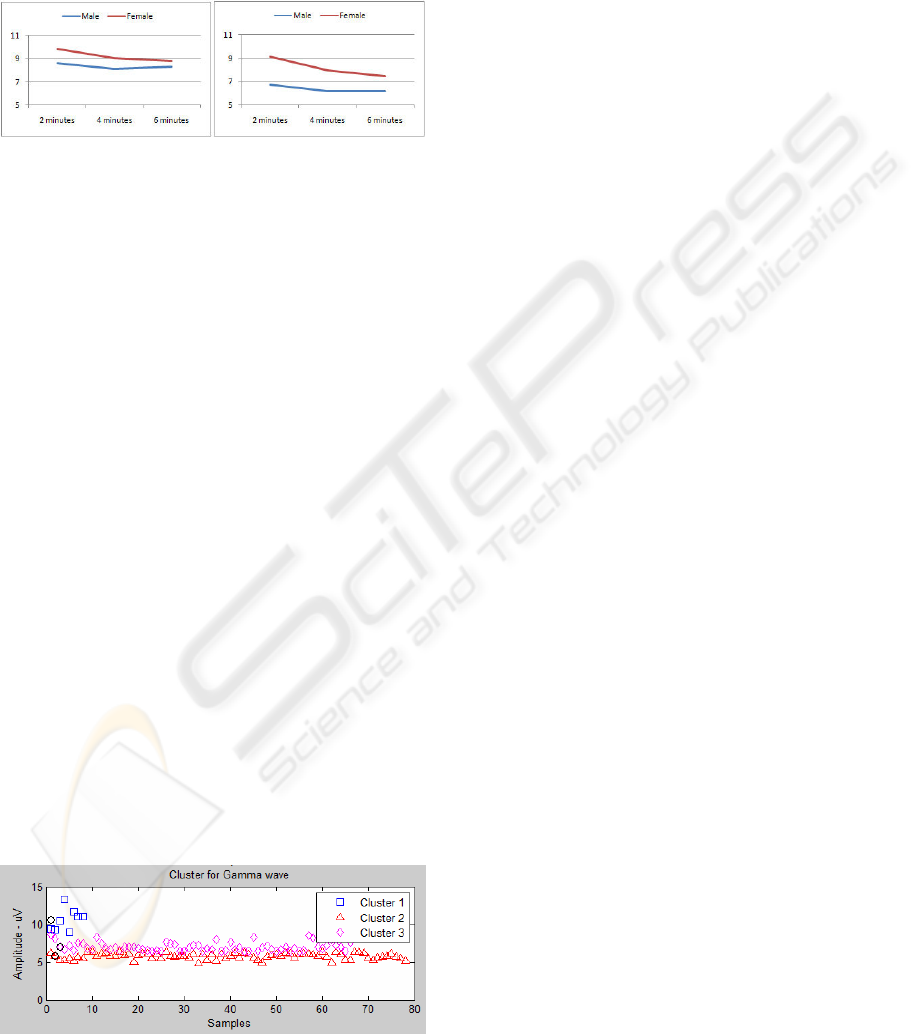
Figure 3: Beta wave (a) and Gamma wave (b) comparison
for men and women.
Apart from these results, the comparasion of
men and women brain wave behaviour, presented in
Figure 4, indicates differences in amplitude directly
related with the sex of the subject. The presented
charts were based on the average amplitude of all
subjects, male and female seperatly, for the three
distinct session stages. Through this ilustration, it is
shown a slighty decreasing variation of the average
amplitude along the entire experimental session,
which proves the pattern-behaviour previously
described.
Together with these results, also an amplitude
diference between male and female waves is
presented during the session, with a higher
amplitude for the female behaviour. Based on the
previously described results, as well as the statistical
analysis, the EAT was able to follow the initial
hypothesis. The emotional state decision taken by
the aplicaiton is based on the clusters’ length,
centroides’ value and the respective high frequency
brain wave. Figure 5 represents the cluster analysis
of one experimental session for the Gamma wave.
These results indicate a clear majority of data
associated with the lowest centroide value, and a
small density of data near the high value centroide.
Based on this approach, the emotional state
classification is based on the clusters’ length and its
degree of correlation between each others.
Figure 4: Cluster analysis for the Gamma wave.
3.2 EAT
The Emotion Assessment Tool was developed with
the main intention of evaluating and assessing the
predominant emotional state of the subject that has
been previously induced by some type of multimedia
content. For this specific project, there were studied
two different emotional states plus the neutral one,
so that three clusters were adopted for the statistical
analysis. The integration of this tool in a project with
a bigger scope is suitable and advantageous, since
the number of clusters is dependent on the number
of emotional states to analyse and the specific
multimedia content used for the emotional induction.
Besides the emotion assessment functionality,
this tool also integrates some important features for
data analysis as: plotting the original biometric data
gathered from the EEG; calculate the weighted
means directly from the original signal in intervals
of 5, 10 and 20 seconds, defined by the user; activate
or deactivate the spikes removal technique, affecting
and improving the assessment results for more
unstable experimental sessions. Figure 6 represents
an EAT running screenshot, where the final
conclusion led to a predominant emotional state of
sadness after a decimation of 20 seconds of the load
of raw session data file.
3.3 Success Rate
The performance attained through the application of
the EAT is directly related with the success rate of
the emotional assessment and is a determinant factor
for the verification and validation of this tool for
future work.
Accordingly to Table 1, where the confusion
table is presented, the final rate of success is 74%
and all the failures of the EAT are related with the
sadness emotional state, with low values for the
brain waves amplitude. The application of the EAT
for the automatic assessment was, for one of the
experimental sessions, able to determine the correct
predominant emotional state, which wasn’t possible
through the empirical visual inspection analysis of
the biometric data after processing it.
Due to the processes inherent to the emotional
classification, the decision algorithm needs to check
if both Beta and Gamma brain waves achieve a
similar emotional state. This indicates that the 16%
of failure of the EAT are related to a discrepancy
between the analysis of the Beta and Gamma brain
waves’ behaviour.
EMOTION ASSESSMENT TOOL FOR HUMAN-MACHINE INTERFACES - Using EEG Data and Multimedia Stimuli
Towards Emotion Classification
187
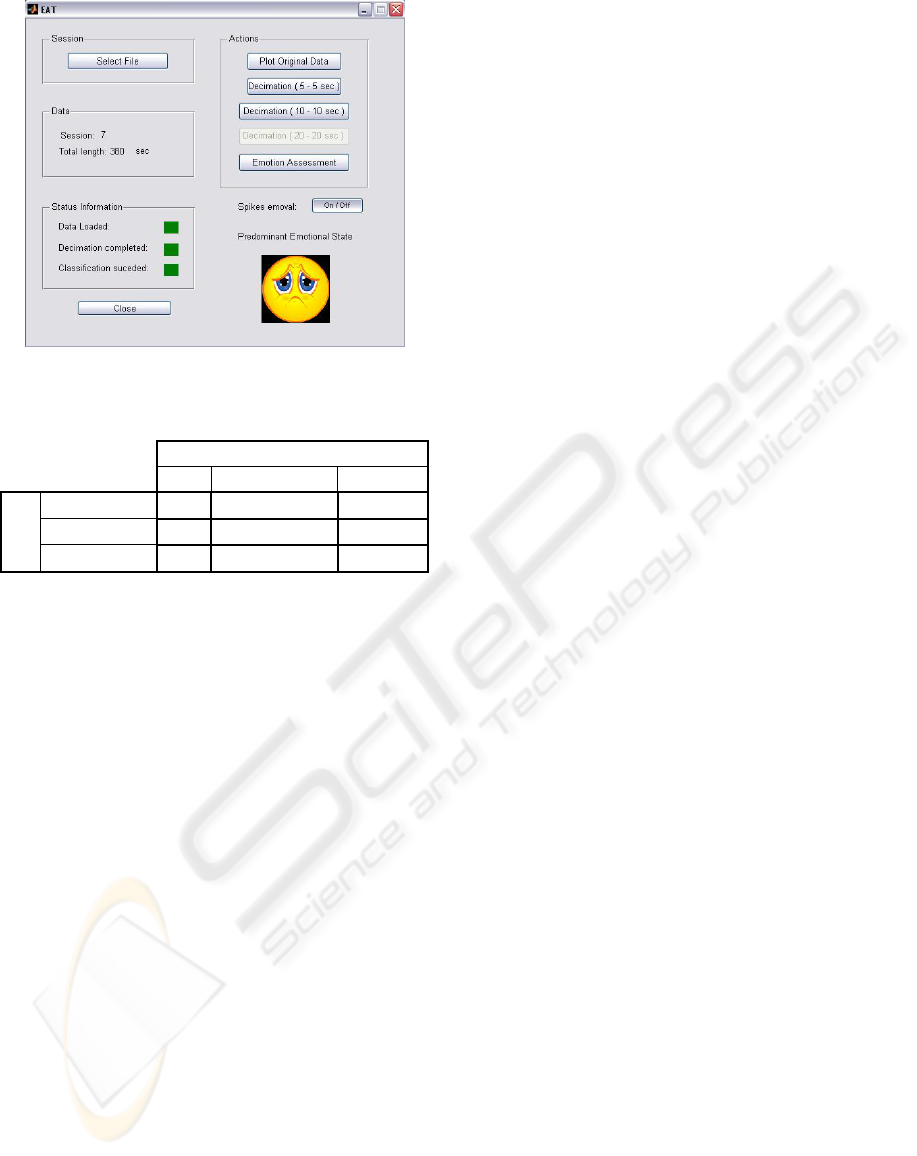
Figure 5: EAT running screenshot.
Table 1: Confusion Table.
EAT
Joy Neutral Sadness
Joy
11%
0% 11%
Neutral 0%
0%
0%
Subject
Sadness 0% 16%
63%
4 CONCLUSIONS
The initial enunciated hypothesis was validated and
the majority of the subjects included in this project
have reacted in a similar way to the multimedia
content presented. Starting with light, enjoyable
contents and finishing with sad ones, it was able to
conclude that the average amplitude of the high
frequency brain waves decreased along the entire
session based on the emotional state induced on the
subject. Secondly, and from the comparison of the
high frequency brain waves average amplitude
between male and female subjects, the females’ one
have a higher amplitude which indicates that they
are more sensible to sad multimedia contents.
In what concerns to the statistical analysis, two
different emotional states – joy and sadness – plus a
neutral one led to the use of three clusters,
characterized by its centroides’ value, the number of
samples included and the degree of correlation
between them. With this approach, the emotion
assessment tool was able to classify the predominant
emotional state, out of three, with an accuracy of
almost 75%. Multiple application domains have
been identified as some interesting applications.. In
this category, one shall consider system adaptations
in order to accommodate psychiatric diagnosis and
treatment procedures, either by simple emotional
state assessment or by complementing this feature
with audiovisual adequate contents. Videogame
related entertainment industry is also a potential
target with the introduction of emotional state
information as an extra variable for game play
enhancement. Another expected adaptation consists
in studying different human activities from the
emotional point of view, and it is believable to be an
important contribute to diverse social sciences.
As a final remark, one shall state that the
presented study achieved to develop an automatic
tool for basic emotional states detection with high
rates of success based on stable methodologies of
emotion induction and data processing and
validation. The used hardware solutions are believed
to be minimal invasive and are not costly which
enables its vast application at a larger scale.
REFERENCES
Aftanas, L. I., el al. 2002. Time-dependent cortical
asymmetries induced by emotional arousal: EEG
analysis of event-related synchronization and
desynchronization on individually defined frequency
bands. International Journal of Phychophysiology, pp.
67-82, nr 44.
Aftanas, L. I., et al. 2004. Analysis of Evoked EEG
Synchronization and Desynchronization in Conditions
of Emotional Activation in Humans: Temporal and
Topographic Characteristics. Neuroscience and
Behavioral Physiology, pp 859-867, vol 34, nr 8.
Aftanas, L. I., et al. 2006. Neurophysiological Correlates
of Induced Discrete Emotions in Humans: An
Individually Oriented Analysis. Neuroscience and
Behavioral Physiology, pp 119-130, vol 36, nr 2.
Chanel, G., et al. 2005. Emotion Assessment: Arousal
Evaluation using EEG's and Peripheral Physiological
Signals. University of Geneva, Switzerland: Computer
Science Department, pp 530-537, vol 4105/2006.
Damásio, A. R. 1994. Descartes error: Emotion, reason
and human brain. Europa-América.
Ebrahimi, T., et al. 2003. Brain Computer Interface in
Multimedia Communication. IEEE Signal Processing
Magazine, pp 14-24, vol 20, issue 1.
Rusalova, M. N., et al. 2003. Spatial Distribution of
Coefficients of Asymmetry of Brain Bioelectrical
Activity during the Experiencing of Negative
Emotions. Neuroscience and Behavioral Physiology,
pp 703-706, vol 33, nr 7.
SIGMAP 2008 - International Conference on Signal Processing and Multimedia Applications
188
