
A NEW VIDEO QUALITY PREDICTOR BASED ON DECODER
PARAMETER EXTRACTION
Andreas Rossholm
†‡
and Benny L¨ovstr¨om
†
†
Department of Signal Processing, School of Engineering, Blekinge Institute of Technology, Ronneby, Sweden
‡
Video Technology, Ericsson Mobile Platforms AB, Lund, Sweden
Keywords:
Video quality assessment, video quality metric estimation, reference free, mobile equipment, multi-linear
regression, quality predictor, low complexity.
Abstract:
In the mobile communication area there is a demand for reference free perceptual quality measurements in
video applications. In addition low complexity measurements are required. This paper proposes a method for
prediction of a number of well known quality metrics, where the inputs to the predictors are readily available
parameters at the decoder side of the communication channel. After an investigation of the dependencies
between these parameters and between each parameter and the quality metrics, a set of parameters is chosen
for the predictor. This predictor shows good results, especially for the PSNR and the PEVQ metrics.
1 INTRODUCTION
There is a growing demand for objective quality mea-
surement techniques estimating perceived video qual-
ity in mobile devices. This is of interest to, among
others, the mobile phone industry, mobile network
operators and software developers. The quality of
a video encoder and decoder can be measured with
different metrics. Frequently metrics which require
a reference together with the processed image or
video in order to evaluate the perceived quality are
used (Winkler, 2005). Two of the most commonly
used metrics are the objective metrics peak signal-
to-noise ratio (PSNR) and the mean-squared-error
(MSE) which can be calculated for each decoded
frame and then averaged for the complete sequence.
Since both MSE and PSNR are based on a pixel-by-
pixel comparison the metrics have some issues re-
garding the relation to the perceptual quality. This
has resulted in the development of several new met-
rics as SSIM (Wang et al., 2004), a video adapted
version of SSIM denoted VSSIM (Lu et al., 2004),
NTIAs VQM (Pinson and Wolf, 2004), and Opticoms
PEVQ (PEVQ, 2008). All these metrics use the origi-
nal frame as reference, or some kind of reduced refer-
ence information, to calculate a relation between this
and the decoded frame.
In many situations where perceptual quality is of in-
terest, e.g. streaming video, video telephony, MBMS,
and DVB-H, the original frames are not available.
Thus there is a need for reference free quality metrics,
which can be implemented entirely at the decoder side
of a transmission line. There are a number of such
metrics that have been developed but they often fo-
cus on one parameter such as blur (Marziliano et al.,
2002), blockiness (Zhou, 2000), or motion (Ries et
al., 2007), and they require some processing of the re-
ceived frame and are thereby often less useable in real
application.
In this paper a solution is proposed to estimate the
quality without having access to the original frames
or reduced reference and without the requirement of
processing of the received frame. The estimation is
based on predicting the above mentioned full or re-
duced reference quality metrics.
2 THE PROPOSED IDEA
When a video sequence is encoded to fulfil the re-
quired properties such as bit rate, frame rate and reso-
lution, the encoder sets and adjusts a number of pa-
rameters. Some of these are set for the whole se-
quence while some are adjusted for each frame or
285
Rossholm A. and Lövström B. (2008).
A NEW VIDEO QUALITY PREDICTOR BASED ON DECODER PARAMETER EXTRACTION.
In Proceedings of the International Conference on Signal Processing and Multimedia Applications, pages 285-290
DOI: 10.5220/0001933302850290
Copyright
c
SciTePress

within frames. The coding results in a bit stream
consisting of motion vector parameters, coded resid-
ual coefficients and header information, e.g. frame
rate and quantization parameters (QP) value. From
the bit stream it is also possible to calculate the num-
ber of intra blocks, number of inter blocks, number of
skipped blocks, etc. The idea proposed in this paper
is to predict the video quality using these parameters.
The predictor is built by setting up a model and adapt
its coefficients using a number of training sequences.
The parameters used are available at the decoder and
therefore the quality predictor is reference free.
Throughout this paper the video sequences are
coded using the H.264 standard, since this is one of
the most used video encoder for mobile equipment.
The parameters chosen for evaluation of contribution
to the predictor are
1. Average QP value (Avg QP)
2. Bitrate /Frame rate (Bits/Frame)
3. Number of intra blocks (Intra [%])
4. Number of inter blocks (Inter [%])
5. Number of skipped blocks (Skip [%])
6. Frame rate
7. Number of inter blocks of size 16x16
(P16x16[%])
8. Number of inter blocks of size 8x8, 16x8, and
8x16 (P8x8 [%])
9. Number of inter blocks of size 4x4, 8x4, and 4x8
(P4x4 [%])
10. Average motion vector length (Avg MV [%])
Also, other parameters could be extracted and evalu-
ated but these where chosen based on their expected
potential contribution to the perceptual quality.
3 THE METRICS PREDICTED
The proposed model will in this paper be evaluated
in predicting the following quality metrics; PSNR,
SSIM, VSSIM, NTIA VQM, and PEVQ.
PSNR, the peak signal-to-noise ratio, is defined as
PSNR(n) = 10· log
MAX
2
I
MSE(n)
(1)
where MAX
I
is the maximum value a pixel can take
(e.g. 255 for 8-bit images) and the MSE is the aver-
age of the squared differences between the luminance
values of corresponding pixels in two frames. MSE is
defined as
MSE =
1
UV
U
∑
u=1
V
∑
v=1
[I
R
(u,v) − I
D
(u,v)]
2
(2)
where I
R
(u,v) denotes the intensity value at pixel lo-
cation (u,v) in the reference video frame, I
D
(u,v) de-
notes the intensity value at pixel location (u, v) in the
distorted video frame, U is the number of rows in a
video frame, and V is the number of columns in a
video frame. To get a measure for a video sequence
a simple averaging over a video sequence of length N
frames is made as.
PSNR =
1
N
N
∑
n=1
PSNR(n) (3)
SSIM, the Structural SIMilarity index, considers im-
age degradations as perceived changes in the varia-
tion of structural information by combining measures
of the distortion in luminance, contrast and structure
between two frames, (Wang et al., 2004), as
SSIM(n)=
[2µ
I
R
(n)µ
I
D
(n)+C
1
][2σ
I
R
I
D
(n)+C
2
]
[µ
2
I
R
(n)+µ
2
I
D
(n)+C
1
][σ
2
I
R
(n)+σ
2
I
D
(n)+C
2
]
(4)
where µ
I
R
(n),µ
I
D
(n) and σ
I
R
(n),σ
I
D
(n) denote the
mean intensity and contrast of the n-th reference
video frame I
R
and distorted video frame I
D
, respec-
tively. The constants C
1
and C
2
are used to avoid in-
stabilities in the structural similarity comparison that
may occur for certain mean intensity and contrast
combinations.
Similar as with PSNR, the SSIM value for an en-
tire video sequence of length N may be calculated as
SSIM =
1
N
N
∑
n=1
SSIM(n) (5)
VSSIM, the Video Structural SIMilarity index, is an
adaption of the SSIM metric to quality evaluation
for video. VSSIM was developed using the VQEG
(Video Quality Experts Group) Phase I test data set
for FR-TV video quality assessment (VQEG, 2008)
and calculated as
Q
i
=
∑
R
S
j=1
w
ij
SSIM
ij
∑
R
S
j=1
w
ij
(6)
where Q
i
denotes the quality index measure of the i-
th frame in the video sequence. The weighting value
w
ij
is given to the j-th sampling window in the i-th
frame based on the observation that dark regions usu-
ally do not attract fixations and should therefore be
assigned smaller weighting values. R
S
is the number
of sampling windows per video frame that has been
used. The VSSIM value for the entire video sequence
of length N is then calculated as
VSSIM =
∑
N
i=1
W
i
Q
i
∑
N
i=1
W
i
(7)
SIGMAP 2008 - International Conference on Signal Processing and Multimedia Applications
286

where W
i
is the weighting value assigned to the i-th
frame based on global motion and w
ij
. Since the met-
ric was developed using the VQEG Phase I test data
it consists of larger frame sizes (SD-resolutions, 525-
line and 625-line) than the QCIF used in this paper,
therefore a modified VSSIM has also been used in
the proposed solution to adapt it to smaller resolu-
tion. This is accomplished by scaling the weighting
coefficient K
M
, used to calculateW
i
, and its connected
thresholds with a factor of 8, from 16 to 2 (Lu et al.,
2004).
NTIA VQM, the National Telecommunications and
Information Administrations general purpose Video
Quality Model general model, is a reduced reference
method containing linear combination of seven ob-
jective parameters for measuring the perceptual ef-
fects of a wide range of impairments such as blurring,
block distortion, jerky/unnatural motion, noise (in
both the luminance and chrominance channels), and
error blocks (Pinson and Wolf, 2004). The perceptual
impairment is calculated using comparison functions
that have been developed to model visual masking
of spatial and temporal impairments. Some features
use a comparison function that performs a simple Eu-
clidean distance between two original and two pro-
cessed feature streams but most features use either the
ratio comparison function or the log comparison func-
tion. The VQM general model was included in the
Video Quality Experts Group (VQEG) Phase II Full
Reference Television (FR-TV) tests (VQEG, 2008).
PEVQ, the Perceptual Evaluation of Video Quality
from Opticom, calculates measures from the differ-
ences in the luminance and chrominance domains be-
tween corresponding frames. Also motion informa-
tion is used in forming the final measure (PEVQ,
2008). PEVQ has been developed for low bit rates and
resolutions as CIF (352× 288) and QCIF (176× 144).
PEVQ is a proposed candidate for standardization of a
FR video model within VQEG which is in the process
of starting verification tests for future standardization.
4 THE MATHEMATICAL MODEL
The problem can be presented as an observation ma-
trix, X = [x
1
x
2
· · · x
N
], where x
1
,x
2
,. .. x
N
are a num-
ber of feature vectors that has been generated with
different video content and codec setups. Each fea-
ture vector x
n
consists of extracted codec parameters
denoted x
1
,x
2
,. .. x
K
. The corresponding quality mea-
sures for the different video content, PSNR, PEVQ,
SSIM, VSSIM, and NTIM then correspond to the de-
sired Y = [y
1
y
2
· · · y
N
]. X and Y can be viewed as
training data for a classification, mapping or regres-
sion problem. It is desired to find a function Z = f(x)
that maps the given values in x to a specific value Z,
e.g. an estimation of PSNR.
There are several different models solving the prob-
lem, that are more or less computationalcomplex. Be-
cause a low complex solution is required in order to
have the possibility for an implementation in a mobile
device, multi-linear regression is selected.
The multi-linear model is formulated as:
Y = βx+ ε (8)
where ε represents the unpredicted variation. The
multi-linear regression estimates the values for β de-
noted
b
β that can be used to predict Z as
b
Z =
b
β
0
+
b
β
1
x
1
+
b
β
2
x
2
+ ... +
b
β
K
x
K
(9)
4.1 Predicted Metric Evaluation
To be able to evaluate the accuracy of the predicted
metric Pearson linear correlation coefficient is used.
It is defined as follows:
r
P
=
∑
(
b
Z
i
−
b
Z
mean
)(Z
i
− Z
mean
)
q
∑
(
b
Z
i
−
b
Z
mean
)
2
p
∑
(Z
i
− Z
mean
)
2
(10)
where
b
Z
mean
and Z
mean
are the mean value of esti-
mated and true data set respectively, and
b
Z
i
and Z
i
are
the estimated and true data values for each sequence.
This assumes a linear relation between the data sets.
5 VIDEO SOURCE SEQUENCES
To generate training and verification data different se-
quences with different characteristic (amount of mo-
tion, color, heads, animations) were used. The source
sequences had QCIF (176× 144) resolution and were
generated with different frame rates, 30, 15, 10, and
7.5 frames per second (fps), and bitrates, approxi-
mately: 30, 40, 50, 100, 150, and 200 kilobits per
second (kbps). The video sequences were approxi-
mately 3 seconds long (90, 45, 30, and 23 frames) and
they were encoded with the H.264/MPEG-4 AVC ref-
erence software, version 12.2 generated by JVT (JVT,
2000) using the baseline profile.
The sequences for training were: Foreman, Cart,
Mobile, Shine, Fish, Soccer goal, and Car Phone re-
sulting in 168 sequences for training. For verification
five different parts from a cropped version of the 3G-
sequence was used, where the five parts have differ-
ent characteristics. The cropping was made to QCIF
without the original letter box aspect ratio. Varying
the bitrate and the frame rate in the same way as for
the training data results in 120 verification sequences.
A NEW VIDEO QUALITY PREDICTOR BASED ON DECODER PARAMETER EXTRACTION
287
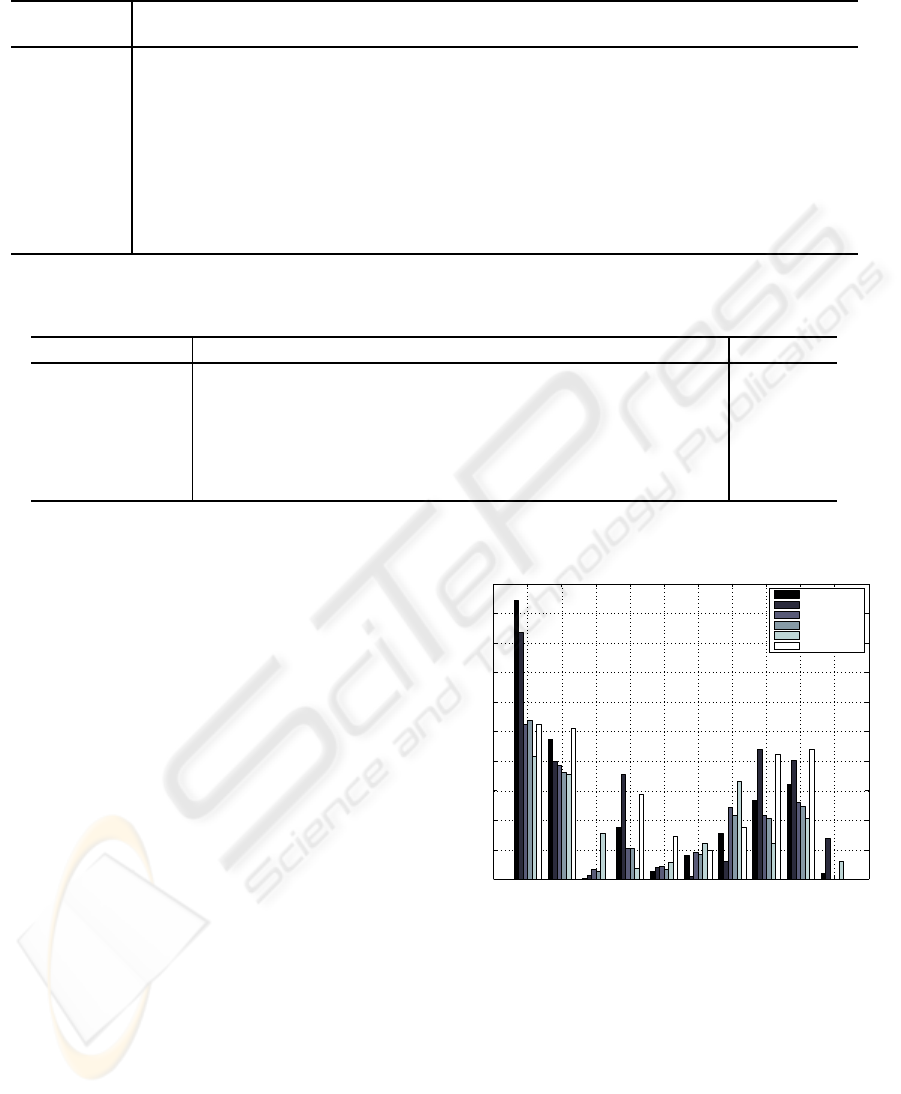
Table 1: The correlation matrix of the evaluated parameters.
Avg
MV
P4x4
[%]
Frame
rate
P16x16
[%]
Avg
QP
Intra
[%]
Skip
[%]
Bits/
Frame
P8x8
[%]
Avg MV 1.000 -0.041 0.247 0.451 0.036 0.098 0.505 0.193 0.454
P4x4 [%] -0.041 1.000 -0.180 0.545 -0.218 0.556 0.234 -0.577 -0.475
Frame rate 0.247 -0.180 1.000 0.032 0.124 0.143 0.079 0.206 0.374
P16x16 [%] 0.451 0.545 0.032 1.000 0.140 0.710 0.784 0.116 0.189
Avg QP 0.036 -0.218 0.124 0.140 1.000 0.160 0.429 0.652 0.539
Intra [%] 0.098 0.556 0.143 0.710 0.160 1.000 0.697 -0.162 0.294
Skip [%] 0.505 0.234 0.079 0.784 0.429 0.697 1.000 0.323 0.597
Bits/Frame 0.193 -0.577 0.206 0.116 0.652 -0.162 0.323 1.000 0.473
P8x8 [%] 0.454 -0.475 0.374 0.189 0.539 0.294 0.597 0.473 1.000
Table 2: The values of β
i
in Eq. (9) for the different metrics, resulting from the regression.
Metrics
b
β
0
b
β
1
b
β
2
b
β
3
b
β
4
b
β
5
b
β
6
b
β
7
Scale
PSNR 66.89 -0.92 -0.07 -0.03 -0.01 -0.09 -0.07 0.01 1.0exp−0
SSIM 109.67 -0.46 0.16 -0.03 -0.38 0.26 0.49 -0.03 1.0exp−2
VSSIM 112.76 -0.52 0.10 -0.01 -0.33 0.19 0.41 -0.01 1.0exp−2
VSSIM modified 111.74 -0.48 0.00 0.00 -0.33 0.17 0.32 0.37 1.0exp−2
NTIA 66.13 -0.66 1.23 0.39 -0.82 1.34 -1.61 0.41 1.0exp−2
PEVQ 55.94 -0.92 0.14 -0.21 -0.07 0.23 0.26 -0.26 1.0exp−1
6 RESULTS
In the first step the linear regression described above
is applied to the 168 training sequences for each of the
parameters separately, giving a measure of the corre-
lation between this parameter and the quality metric.
The outcome is shown in Fig. 1, where it can be seen
that the parameters have considerably varying corre-
lation, but also that it differs between the metrics.
In the second step an evaluation of the different
parameters are performed. In this the correlation be-
tween the parameters is calculated. Before the corre-
lation is calculated ”Inter [%]” is removed since this
parameter is a summation of ”P16x16 [%]”, ”P8x8
[%]”, and ”P4x4 [%]” and therefore redundant. The
result from the correlation are shown in Tab. 1. It can
be seen that ”Intra [%]”, ”Skip [%]”, ”Frame rate”,
and ”Avg MV” have the lowest correlations in Fig.
1. If these are analyzed it can also be seen that both
”Intra [%]” and ”Skip [%]” have the highest correla-
tion with ”P16x16 [%]” while neither ”Frame rate”
nor ”Avg MV” correlations are that high. This makes
it possible to reduce the parameter set further by ex-
cluding ”Frame rate” and ”Avg MV”.
Performing the regression with the reduced parame-
ter set using the training sequences gives a prediction
function
ˆ
Z for each metric. The resulting coefficients
0
0.1
0.2
0.3
0.4
0.5
0.6
0.7
0.8
0.9
1
PSNR
PEVQ
SSIM
VSSIM
VSSIM modified
NTIA
Avg QP
Bits/Frame
Intra [%]
Inter [%]
Skip [%]
Frame rate
P16x16 [%]
P8x8 [%]
P4x4 [%]
Avg MV
Correlation Factor (R
2
)
Figure 1: The correlation factor R
2
between each of the pa-
rameters and the metrics used.
in this function
ˆ
Z (see Eq. (9)) are shown in Tab. 2.
The mapping of the
b
β
k
in Tab. 2 to the actual parame-
ters are shown in Tab. 3. These prediction functions,
ˆ
Z, are applied to the verification sequences to predict
the quality metric for these. Further, the quality met-
rics are calculated according to their definitions, and
the Pearson correlation coefficient, r
P
, from Eq. (10)
is calculated and shown i Tab. 4. In the Fig. 2 – 5 the
SIGMAP 2008 - International Conference on Signal Processing and Multimedia Applications
288
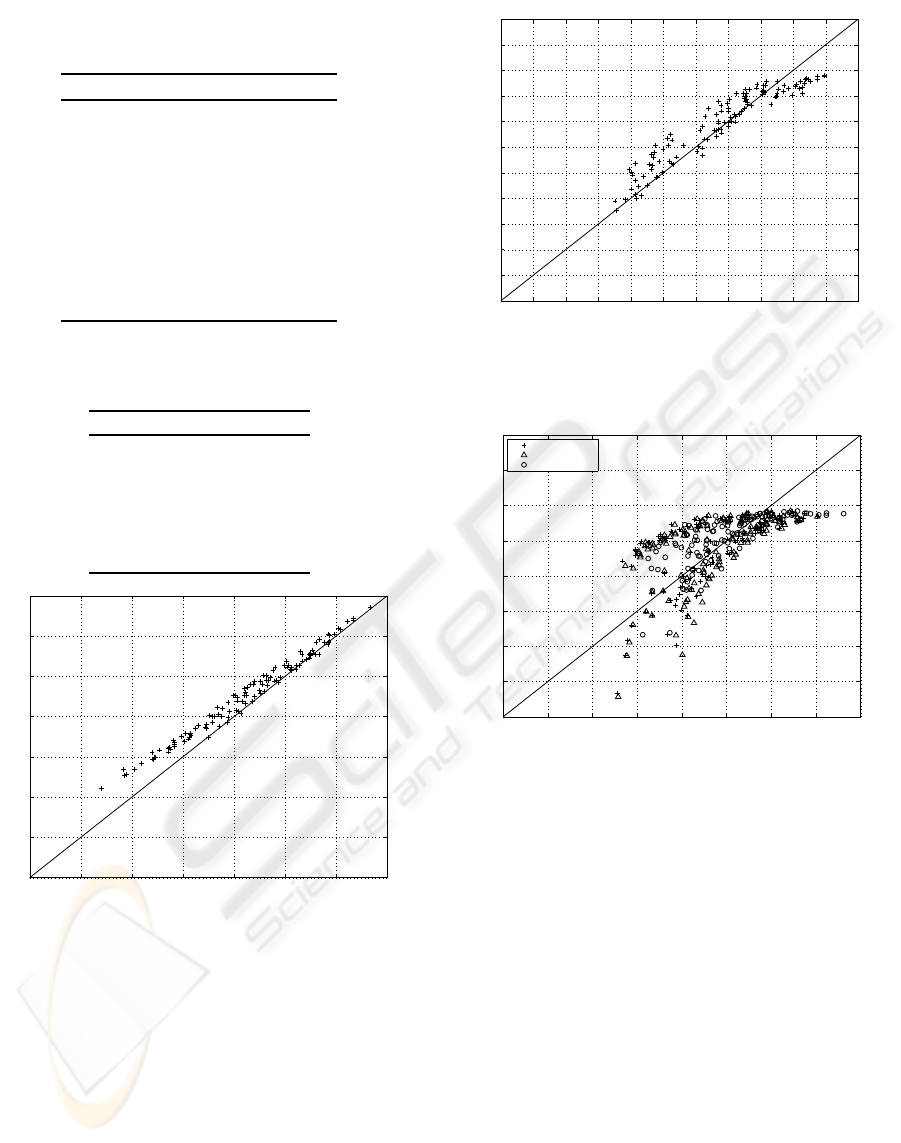
Table 3: Mapping of the
b
β
k
in Tab. 2 to the parameters used
in the regression.
b
β
k
Parameter
b
β
0
Constant
b
β
1
Avg QP
b
β
2
Bits/Frame
b
β
3
Frame rate
b
β
4
P16x16 [%]
b
β
5
P8x8 [%]
b
β
6
P4x4 [%]
b
β
7
Avg MV
Table 4: The Pearson correlation coefficient, r
P
, for the pre-
diction of the different quality metrics.
Metric r
P
PSNR 0.99
SSIM 0.62
VSSIM 0.61
VSSIM modified 0.71
NTIA 0.74
PEVQ 0.95
15 20 25 30 35 40 45 50
15
20
25
30
35
40
45
50
Predicted PSNR
PSNR
Figure 2: PSNR in dB vs. predicted PSNR for each verifi-
cation sequence, r
P
= 0.99.
true metrics are plotted versus the predicted metrics.
Note that the scale differs between the figures since
the metrics have different range.
It can be seen from the table and the figures that
the best prediction is obtained for the PSNR metric.
This is expected since the JM encoder uses rate dis-
tortion optimization where the distortion measure is
correlating with the PSNR. Also the PEVQ metric is
well predicted, with a correlation coefficient of 0.95.
This gives the possibility to implement the proposed
no-reference metric in environments where full or re-
0 0.5 1 1.5 2 2.5 3 3.5 4 4.5 5 5.5
0
0.5
1
1.5
2
2.5
3
3.5
4
4.5
5
5.5
Predicted PEVQ
PEVQ
Figure 3: PEVQ vs. predicted PEVQ for each verification
sequence, r
P
= 0.95.
0.7 0.75 0.8 0.85 0.9 0.95 1 1.05 1.1
0.7
0.75
0.8
0.85
0.9
0.95
1
1.05
1.1
SSIM
VSSIM
VSSIM modified
Predicted SSIM, VSSIM and modified VSSIM.
True SSIM, VSSIM and modified VSSIM
Figure 4: SSIM, VSSIM and modified VSSIM vs. the
predicted values for each verification sequence, r
P
=
0.62, 0.61 and 0.71.
duced reference metrics are not possible to imple-
ment. The metric is also of low complexity, since the
prediction is a simple calculation of the function in
Eq. (9).
7 CONCLUSIONS
A low complex, reference free method to predict per-
ceptual quality metrics of coded video sequences has
been suggested. For the PSNR and PEVQ metrics a
very good precision is achieved, while for the other
metrics the correlation is weaker. The result for PSNR
is expected since rate distortion optimization is used
in the encoder, while the result for PEVQ was not ob-
vious beforehand and shows great potential. The pre-
cision of the prediction for PSNR may be considered
A NEW VIDEO QUALITY PREDICTOR BASED ON DECODER PARAMETER EXTRACTION
289
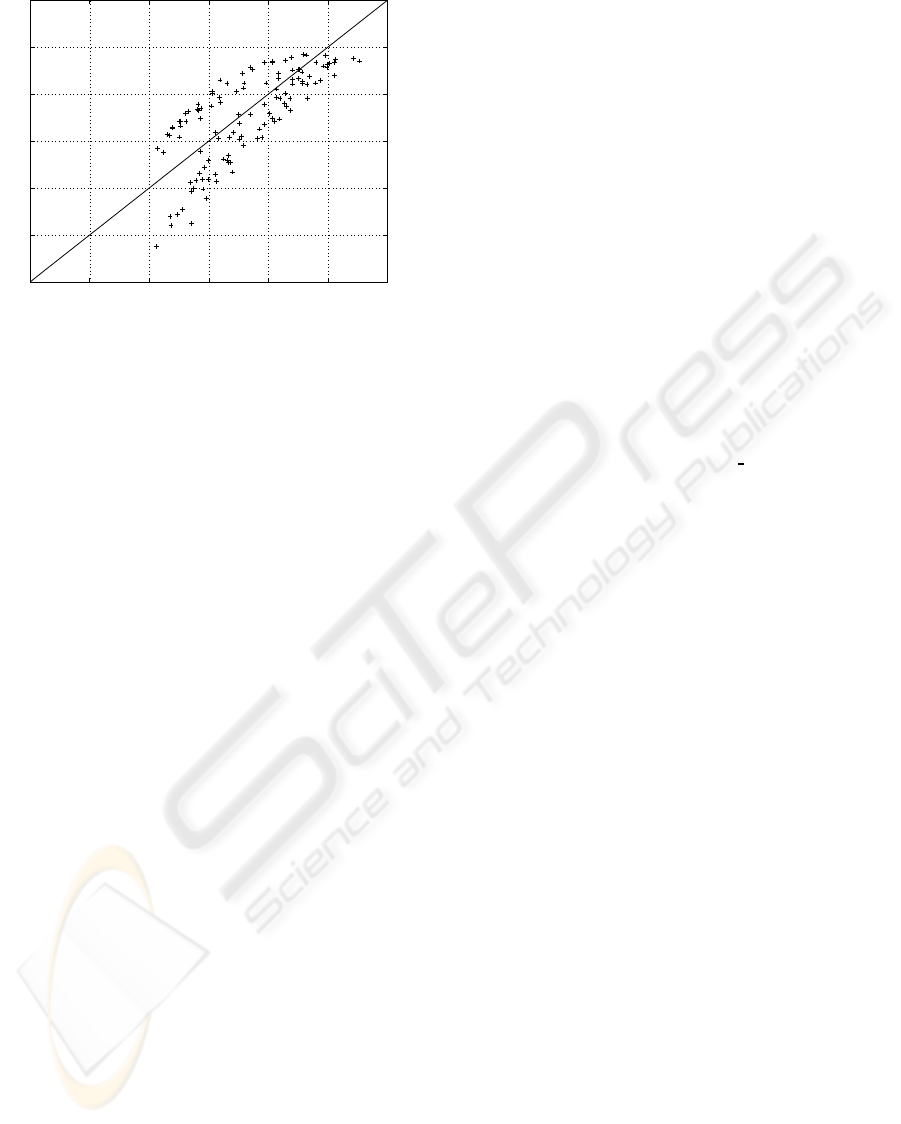
0 0.2 0.4 0.6 0.8 1 1.2
0
0.2
0.4
0.6
0.8
1
Predicted NTIA VQM
NTIA VQM
Figure 5: NTIA VQM vs. predicted NTIA VQM for each
verification sequence, r
P
= 0.74.
to be of limited practical use since the correlation of
PSNR to subjective perceptual quality is known to be
low in many cases. On the other hand, the good preci-
sion for PEVQ prediction is promising since PEVQ is
developed to measure the perceptual quality for low
resolution and low bitrates, and is also proposed for
standardization. The main result of this paper is the
ability of the proposed method to predict quality met-
rics, and the final value of using this prediction de-
pends on the value of the chosen quality metric.
In constructing the predictor an investigation has
been performed to choose the most promising param-
eters to base the prediction on. This has been per-
formed by evaluating the correlation both between
each extracted parameter and the actual quality metric
and between each parameter. The outcome from this
has made it possible to restrict the number of param-
eters to seven and still achieve promising result. The
parameters finally chosen are: Avg QP, Bits/Frame,
Frame rate, P16x16 [%], P8x8 [%], P4x4 [%], and Avg
MV.
To get a more general predictor where also other
encoders are included the proposed model can be
used. It will be obtained by increasing the training
and verification set with sequences encoded using ad-
ditional codecs. Then a new evaluation of which pa-
rameters to choose would be needed, resulting in a
new set of
b
β values.
REFERENCES
S. Winkler, ”Digital Video Quality: Vision Models and
Metrics”, John Wiley and Sons, Ltd, 2005.
Z. Wang, A. C. Bovik, H. R. Sheikh, and E. P. Simoncelli,
”Image quality assessment: From error visibility to
structural similarity” IEEE Transactios on Image Pro-
cessing, vol. 13, no. 4, pp.600-612, Apr. 2004.
Z. Wang, L. Lu and A.C. Bovik, ”Video quality assessment
based on structural distortion measurement”, Signal
Processing: Image Communication, Special issue on
Objective video quality metrics, vol. 19, no. 2, Febru-
ary 2004.
M. H. Pinson, S. Wolf, ”A New Standardized Method for
Objectively Measuring Video Quality”. IEEE Trans-
actions on Broadcasting, vol. 50, no. 3, Sept. 2004.
”PEVQ Advanced Perceptual Evaluation of Video Quality
(PEVQ Whitepaper)”, Opticom, http://www.pevq.org,
(verified 2008-01-18).
”FR-TV Phase II Final Report”, 2003-08-25,
VQEG: The Video Quality Experts Group,
http://www.vqeg.org/projects/frtv phaseII/, (veri-
fied 2008-01-18).
P. Marziliano, F. Dufaux, S. Winkler, T. Ebrahimi, ”A
No-Reference Perceptual Blur Metric”, IEEE Interna-
tional Conference on Image Processing 2002, volume
3, pp. III-57 - III-60, Rochester, USA, Sept. 2002.
W. Zhou, A. C. Bovik, B. L. Evans. ”Blind measurement
of blocking artifacts in images”, IEEE International
Conference on Image Processing 2000, volume 3, pp.
981 - 984, Vancouver, Canada, Sept. 2000.
M. Ries, O. Nemethova, M. Rupp, ” Motion Based
Reference-Free Quality Estimation for H.264/AVC
Video Streaming”, 2nd International Symposium on
Wireless Pervasive Computing (ISWPC ’07), pp. 355
- 359, San Juan, Puerto Rico, USA, February 2007.
”H.264/MPEG-4 AVC REFERENCE SOFTWARE”, Joint
Video Team (JVT) of ISO/IEC MPEG & ITU-
T VCEG (ISO/IEC JTC1/SC29/WG11 and ITU-T
SG16 Q.6), 24th Meeting: Geneva, CH, 29 June - 5
July, 2007.
SIGMAP 2008 - International Conference on Signal Processing and Multimedia Applications
290
