
A COMPARATIVE USABILITY EVALUATION OF TWO
AUGMENTED REALITY LEARNING SCENARIOS
Alexandru Balog and Costin Pribeanu
National Institute for Research in Informatics, Bd. Mareşal Averescu, Nr. 8-10, Bucharest, Romania
Keywords: Usability evaluation, formative evaluation, summative evaluation, augmented reality, e-Learning.
Abstract: Augmented Reality (AR) systems are featuring novel interaction techniques which are mainly driven by the
possibilities to manipulate specific real objects. The interaction components have to be tested with users as
early as possible in the development cycle in order to avoid usability problems. This paper reports on a
comparative analysis of the usability evaluation results for two AR-based learning scenarios. The purpose of
the evaluation was twofold: (a) getting an early feedback from users on the first version of the software, and
(b) comparing the usability of two learning scenarios developed onto the same AR platform. The
comparison has been performed between both quantitative and qualitative measures collected during a
summer school.
1 INTRODUCTION
Augmented Reality systems are featuring a new type
of human-computer interaction which is based on
the integration of real and virtual environments into
one interaction space (Azuma, 1997). Designing for
usability is not an easy task in the AR field since
there is a lack of both specific user-centered design
methods and usability data (Bowman et al., 2002;
Bach & Scapin, 2004; Swann & Gabbard, 2005).
Gabbard et al. (2004) proposed a user-centered
design approach based on 4 main activities: user task
analysis, expert-based formative evaluation, user-
centered formative evaluation and summative
usability evaluation. Formative evaluation is usually
performed in an iterative development cycle with the
purpose of improving the product while summative
evaluation is usually performed after a system or
component has been developed with the purpose of
supporting some decision (Scriven, 1991).
Nevertheless, in the same book, Scriven pointed out
that a useful kind of summative evaluation is “early-
warning summative” which means a summative
evaluation of an early version of a product.
This paper is reporting on a comparative
usability evaluation of two AR-based learning
scenarios developed in the framework of the ARiSE
(Augmented Reality for School Environments)
research project.
The main objective of the ARiSE project is to
test the pedagogical effectiveness of introducing AR
in schools and creating remote collaboration
between classes around AR display systems. ARiSE
is developing a new technology, the Augmented
Reality Teaching Platform (ARTP) in three stages
thus resulting three research prototypes. Each
prototype is featuring a new application scenario
based on a different interaction paradigm. An
important research question is to investigate the
extent to which each learning scenario is actually
answering the project goal.
In order to get a fast feedback from both teachers
and students, each prototype is tested with users
during the ARiSE Summer School which is held
yearly.
The first prototype implemented a Biology
learning scenario for secondary schools. The
interaction paradigm is “3D process visualization”
and is targeted at enhancing the students’
understanding and motivation to learn the human
digestive system. The second prototype
implemented a learning scenario for Chemistry. The
interaction paradigm is “building with guidance”
and is targeted at enhancing the students’
understanding and motivation to learn the periodic
table of Chemical elements as well as the structure
of atoms and molecules. Both scenarios have been
tested with users during the 2
nd
ARiSE Summer
School which has been held in Bucharest, on 24-28
October 2007.
370
Balog A. and Pribeanu C. (2008).
A COMPARATIVE USABILITY EVALUATION OF TWO AUGMENTED REALITY LEARNING SCENARIOS.
In Proceedings of the International Conference on Signal Processing and Multimedia Applications, pages 370-375
DOI: 10.5220/0001934003700375
Copyright
c
SciTePress
The objective of this paper is to comparatively
present and analyze the evaluation results. In this
respect, the evaluation was both formative, since we
could provide developers with useful guidance on
how to improve each scenario, and early summative,
since we compared two learning scenarios in a
structured way by using a usability questionnaire
which is targeting several dimensions.
The rest of this paper is organized as follows. In
the next section we describe the evaluation set-up
and the usability questionnaire. In section 3 we
present and compare the evaluation results for each
scenario. The paper ends with conclusion and future
work in section 4.
2 EXPERIMENT
2.1 Participants
A total of 20 students from which 10 boys and 10
girls tested the ARTP. None of the students was
familiar with the AR technology. 12 students were
from 8
th
class (13-14 years old), 4 from 9
th
class (14-
15 years old) and 4 from 10
th
class (15-16 years old).
Students have different ages because of the
differences related to the Chemistry curricula in each
country.
Testing and debriefing with users has been done
in the morning while the afternoon has been
dedicated for discussion between research partners.
2.2 Equipment and Tasks
ARTP is a “seated” AR environment: users are
looking to a see-through screen where virtual images
are superimposed over the perceived image of real
objects placed on the table (Wind, Riege & Bogen,
2007). The platform has been registered by
Fraunhofer IAIS under the trade mark Spinnstube
®
.
The test has been conducted on the platform of
ICI Bucharest which is equipped with 4 Spinnstube
®
modules.
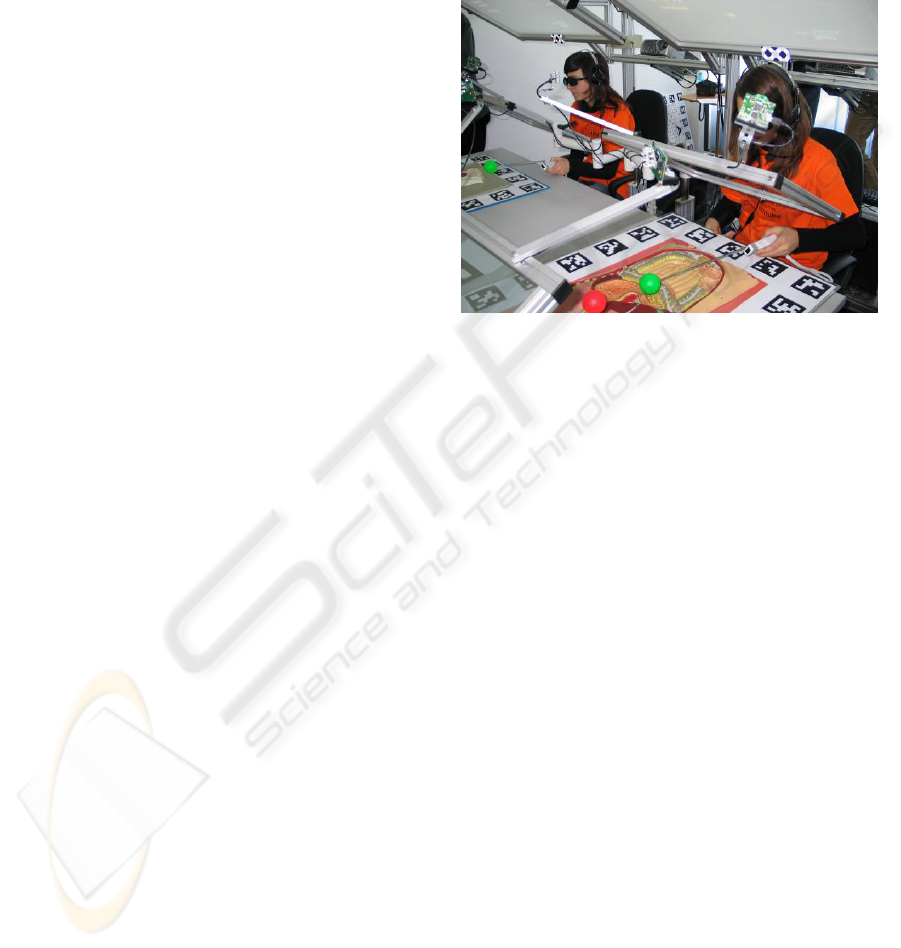
2.2.1 The Biology Scenario
The real object is a flat torso of the human digestive
system. As illustrated in Figure 1, in this setting (4
Spinnstube modules in a room) a torso is used by
two users staying face to face.
A pointing device having a colored ball on the
end of a stick and a remote controller Wii Nintendo
as handler has been used as interaction tool that
serves for three types of interaction: pointing on a
real object, selection of a virtual object and selection
of a menu item.
The user can select an organ with the pointing
device. When the colored ball is onto the organ its
augmentation is superimposed on the see-through
screen. The user is confirming the selection by
pressing the button B placed on the back of the
controller.
Figure 1: Students testing the Biology scenario.
The participants have been assigned 4 tasks: a
demo program explaining the absorption /
decomposition process of food and three exercises:
the 1
st
exercise asking to indicate the organs of the
digestive system and exercises 2 and 3, asking to
indicate the nutrients absorbed / decomposed in each
organ respectively the organs where a nutrient is
absorbed / decomposed.
2.2.2 The Chemistry Scenario
The real objects are a periodic table and a set of
colored balls symbolizing atoms. The periodic table
has two sides: part A with full notation of chemical
elements and part B with numbered groups and
periods. Part B is used to test how students
understand the internal structure of atoms. Each
workplace has its own periodic table.
The remote controller Wii Nintendo has only
been used as interaction tool for selecting a menu
item. Figure 2 illustrates how two students are
creating an atom by placing a colored ball onto the
element on the periodic table. The atom structure is
displayed as an augmentation on the see-through
screen, for all the balls of that color (until the color
is assigned to a new element).
The participants have been assigned 14 tasks: an
introduction and 13 exercises related to three
lessons. 1
st
lesson is about the chemical structure of
the atoms and has 2 exercises. 2
nd
lesson is about
A COMPARATIVE USABILITY EVALUATION OF TWO AUGMENTED REALITY LEARNING SCENARIOS
371

forming molecules and has 8 simple exercises. 3
rd
lesson is about chemical reactions and has 3
exercises.
Figure 2: Students testing the Chemistry scenario.
2.3 Method and Procedure
2.3.1 The Usability Questionnaire
The ISO standard 9126-1:2001 defines usability as
the capability of a software system to be understood,
learned, used, and liked by the user when used under
specified conditions. Within the ARiSE project we
took a broader view on the design and evaluation of
interactive systems by targeting usefulness and
attitude towards the system.
A well known model aiming to predict
technology acceptance once users have the
opportunity to test the system is TAM – Technology
Acceptance Model (Davis et al., 1989). TAM theory
holds that intention to use is influenced by user’s
attitude towards the technology, which in turn is
influenced by the perceived ease of use and
perceived usefulness. As Dillon & Morris (1998)
pointed out, TAM provides with early and useful
insights on whether users will or will not accept a
new technology. TAM is nowadays widely used as
an information technology acceptance model that
has been tested to explain or predict behavioral
intention on a variety of information technologies
and systems (Venkatesh et al., 2007).
A usability evaluation questionnaire has been
developed that has 28 closed items (quantitative
measures) and 2 open questions, asking users to
describe the most 3 positive and most 3 negative
aspects (qualitative measures).
As it could be observed in Table 1, the first 24
items are targeting various dimensions such as
ergonomics, usability, perceived utility, attitude and
intension to use. The remainder four items are to
assess how the students overall perceived the
platform as being easy to use, useful for learning,
enjoyable to learn with and exciting.
Table 1: The usability questionnaire.
Item
1 Adjusting the "see-through" screen is easy
2 Adjusting the stereo glasses is easy
3 Adjusting the headphones is easy
4 The work place is comfortable
5 Observing through the screen is clear
6 Understanding how to operate with ARTP is easy
7 The superposition between projection and the real
object is accurate
8 Learning to operate with ARTP is easy
9 Remembering how to operate with ARTP is easy
10 Understanding the vocal explanations is easy
11 Reading the information on the screen is easy
12 Selecting a menu item is easy
13 Correcting the mistakes is easy
14 Collaborating with colleagues is easy
15 Using ARTP helps to understand the lesson more
quickly
16 After using ARTP I will get better results at tests
17 After using ARTP I will know more on this topic
18 The system makes learning more interesting
19 Working in group with colleagues is stimulating
20 I like interacting with real objects
21 Performing the exercises is captivating
22 I would like to have this system in school
23 I intend to use this system for learning
24 I will recommend to other colleagues to use
ARTP
25 Overall, I find the system easy to use
26 Overall, I find the system useful for learning
27 Overall, I enjoy learning with the system
28 Overall, I find the system exciting
By addressing issues like perceived utility,
attitude and intention to use, usability evaluation
results could be easier integrated with pedagogical
evaluation results.
2.3.2 Procedure
Each group of students tested ARTP twice, once for
each interaction scenario. The Biology scenario has
been tested before the Chemistry scenario. Before
testing, a brief introduction to the AR technology
and ARiSE project has been done for all students.
During testing, effectiveness (binary task
completion and number of errors) and efficiency
(time on task) measures have been collected in a log
file.
SIGMAP 2008 - International Conference on Signal Processing and Multimedia Applications
372
0.00
1.00
2.00
3.00
4.00
5.00
Biology
3.30 4.05 4.25 4.30 3.55 3.75 3.00 3.75 4.00 4.60 4.10 4.25 3.55 3.25 4.00 3.65 3.75 4.45 3.90 3.75 3.55 4.30 3.95 3.95 3.30 4.05 3.70 3.85
Chemistry
3.10 3.50 4.20 4.20 3.35 4.05 3.05 4.10 4.45 4.40 3.65 4.25 3.40 3.65 4.25 3.85 4.10 4.55 3.95 3.95 4.05 4.45 3.95 4.05 3.55 4.30 3.85 4.10
1 2 3 4 5 6 7 8 9 10111213141516171819202122232425262728
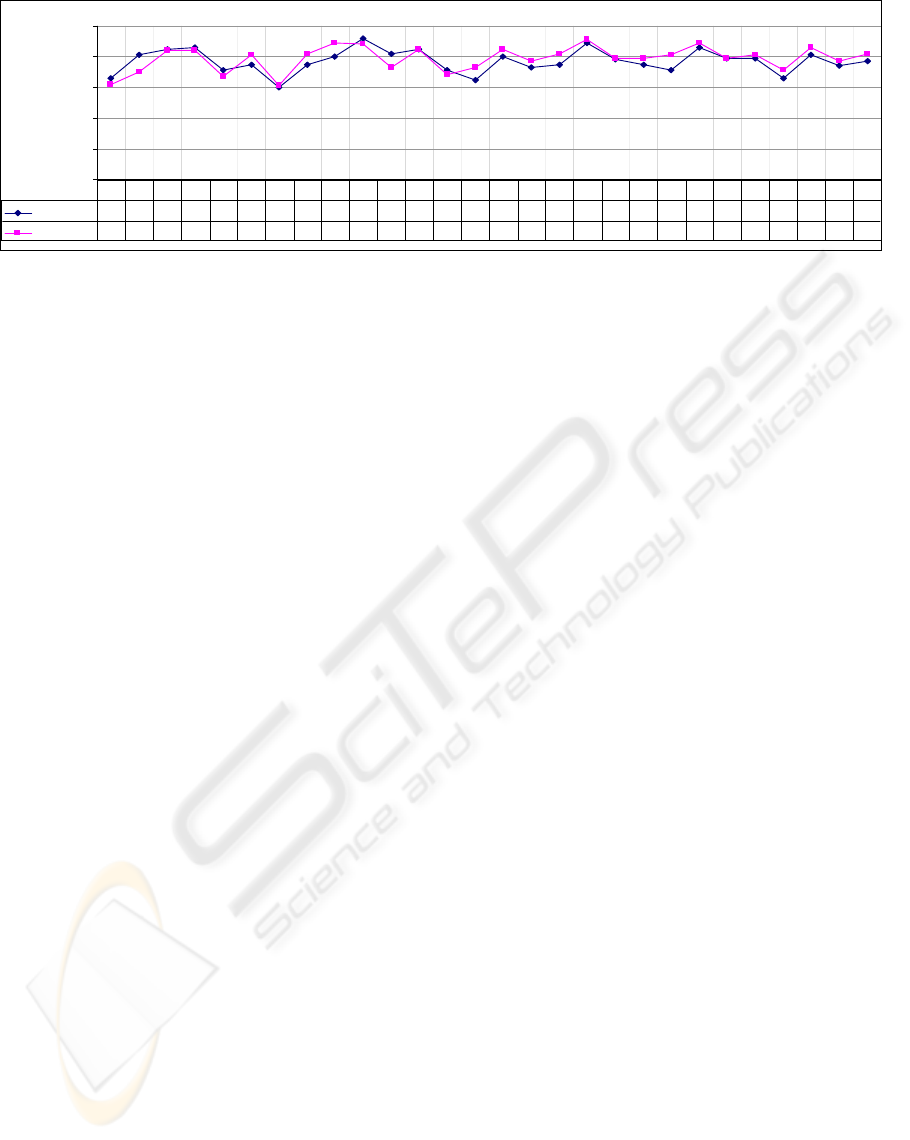
Figure 3: Comparison between the Biology and Chemistry scenarios (mean values).
After testing, the students were asked to answer
the new usability questionnaire by rating the items
on a 5-point Likert scale (1-strongly disagree, 2-
disagree, 3-neutral, 4-agree, and 5-strongly agree).
Prior to the summer school, the questionnaire has
been translated into the native language of students.
Reliability of the scale (Cronbach’s Alpha) was
0.931 for the Biology scenario and 0.929 for the
Chemistry scenario.
3 RESULTS
3.1 Quantitative Data Analysis
3.1.1 Comparison between Mean Values
A comparison between mean values (questionnaire
data) is presented in Figure 3. Items 1-5, 7, 10, 11
and 12 are mainly related to the general ergonomics
of the ARTP while items 6, 8, 9, 13 and 14 are
mainly related to the usability of the application
scenario.
A paired samples t-test revealed that the
differences are statistically significant (α=0.05,
df=19) only for 4 items: 2 (t=2.604, p=0.009), 9 (t=-
3.943, p<0.001), 11 (t=2.131, p=0.023), and 21 (t=-
2.364, p=0.014).
The general ergonomics of the AR platform has
been better rated for the Biology scenario. The rest
of dimensions have been better rated for the
Chemistry scenario.
On the one hand, this means that the ergonomics
of the platform created more problems to students
trying to solve the Chemistry exercises. The most
important differences are at the items 2 (-0.55), 5 (-
0.20) and 11 (-0.45) which are related to the quality
of visual perception since the students encountered
difficulties with the superposition between the ball
(real object) and the atom structure (augmentation).
On the other hand, the usability of the Chemistry
application was better and weighted more in the
general ease of use which has been better rated (3.55
vs. 3.30). The biggest differences are related to the
items 6, 8 and 9, i.e. the ease of understand (+0.30),
ease to learn (+0.35) and ease to remember how to
operate with the application (+0.45). The positive
difference at item 14 (+0.40) shows that the students
found it easier to collaborate with colleagues during
the Chemistry scenario.
The mean values for the item 25 shows that
overall, the students found the Chemistry application
easier to use than the Biology application (+0.20).
The perceived utility (items 15-17) of the
Chemistry scenario has been better rated. The most
important difference is at item 17 (+0.35), showing
that the students will know more on the topic after
using ARTP. These differences are also consistent
with the difference at the general item 26 (+0.25).
The attitude towards the Chemistry scenario has
been more positive than towards the Biology
scenario (items 18-21). Students preferred the AR
interaction during Chemistry exercises (+0.20) and
found them much more captivating (+0.50). The last
two general items have been also scored higher for
this scenario.
Items 10, 18 and 22 have been positively
evaluated for both scenarios, with a mean over 4.25,
showing that understanding the vocal explanation is
easy, the system makes learning more interesting,
and students would like to have this system in
school.
Items 1, 5, 7 and 25 have low mean values for
both scenarios, showing that there are problems with
the visual perception and overall, students found
ARTP difficult to use. Most of these usability
problems are related to the ergonomics of the AR
platform and they are described in more detail in the
open questions.
A COMPARATIVE USABILITY EVALUATION OF TWO AUGMENTED REALITY LEARNING SCENARIOS
373
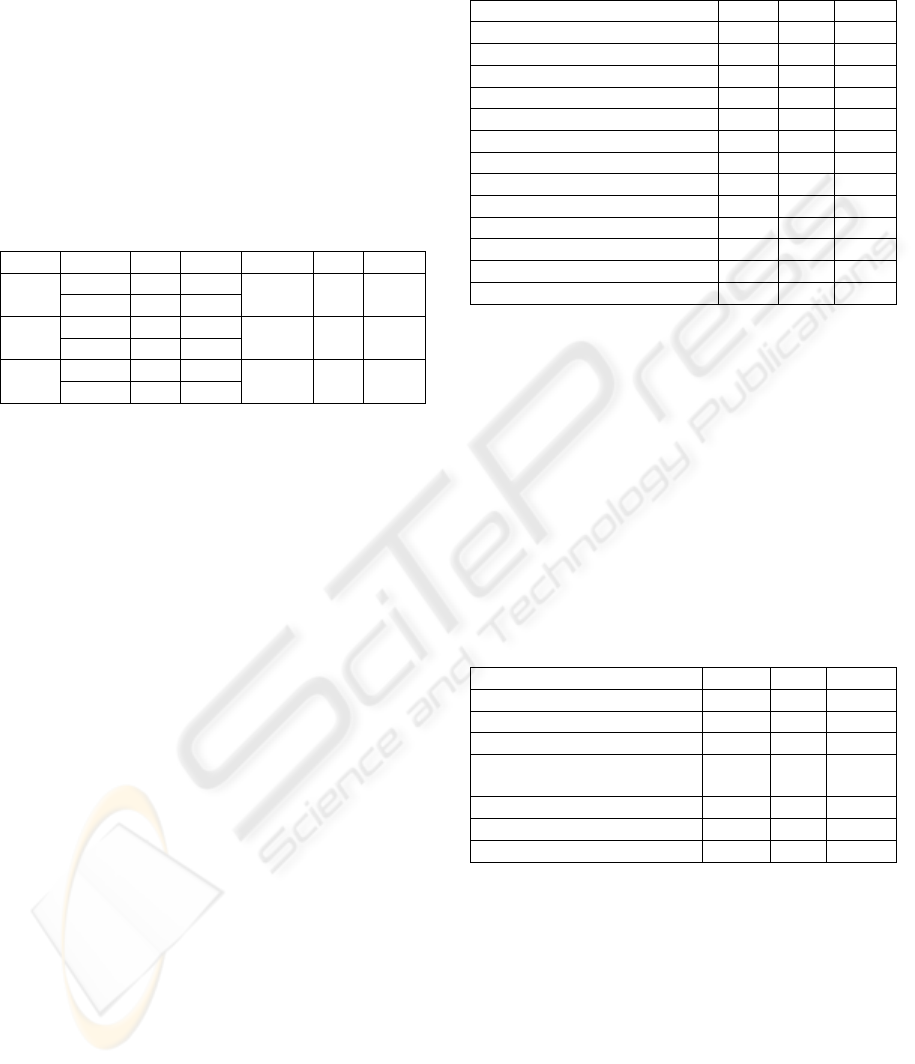
3.1.2 Age Analysis
An independent-samples t-test was conducted to
compare the mean scores of items for the students in
the 8
th
class and the older students.
For the Biology scenario, the t-test results
revealed statistically significant differences (α=0.05,
df=18) for 3 items: 14, 19, and 21 (see Table 2).
This means that the younger students found the
collaboration easier and more stimulating than the
older students. Younger students found also the
exercises more captivating.
Table 2: Age analysis for items 14, 19, and 21.
Item Age N Mean t df p
14 12 3.83
14
15-16 8 2.38
-3.066 18 0.007
14 12 4.25
19
15-16 8 3.38
-2.556 18 0.020
14 12 4.08
21
15-16 8 2.75
-4.893 18 0.000
For the Chemistry scenario, the t-test analysis
revealed a significant difference (α=0.05, df=18)
only for the item 1 (t=-3.778, p=0.001), showing that
it was easier for the younger students (M=3.58,
SD=0.793) than for the older students (M=2.38,
SD=0.518) to adjust the see-through screen.
3.2 Qualitative Data Analysis
3.2.1 Most Mentioned Positive Aspects
The answers to the open questions have been
analyzed in order to extract key words (attributes).
Attributes have then been grouped into categories.
Some students only described one or two aspects
while others mentioned several aspects in one
sentence thus yielding a number of 82 positive
aspects for the Biology scenario and 70 positive
aspects for the Chemistry scenario.
A comparison of the main categories of most
mentioned positive aspects is presented in Table 3.
The system provides with an easier and better
understanding of the topic, better remembering of
the learned content, and faster learning. The students
also appreciated the usefulness of the exercises and
expressed the interest to have this system in schools.
ARTP is increasing the students’ motivation to
learn since they mentioned that the system makes
learning more interesting (especially Chemistry), is
attractive, novel, provocative and funny. They were
also attracted by the features of the AR technology,
including the multimodal user guidance. Two
students directly mentioned that they liked more the
Chemistry scenario.
Table 3: Main categories of positive aspects.
Category Total Bio. Chem.
Good for learning 33 27 6
Good for understanding 20 9 11
Good for testing 7 4 3
Interesting learning 14 4 10
Funny, novel, provocative 12 8 4
Attractive learning 9 5 4
Captivating, stimulating 4 2 2
AR interaction 10 5 5
3D visualization 19 8 11
User guidance (explanations) 13 7 6
Better scenario 2 - 2
Easy to use and other 9 3 6
Total 152 82 70
Students liked the idea of learning-by-doing and
found the simulation of chemical reactions very
attractive (“You see exactly what is happened into a
chemical reaction”, “The creation of molecules and
other chemical processes are visualized very nice
and demonstrative”). This corresponds to the higher
rating of the item 21 (Performing exercises is
captivating) in the Chemistry scenario.
3.2.2 Most Mentioned Negative Aspects
Most mentioned negative aspects are summarized in
Table 4 in a decreasing order of their frequency.
Table 4: Most mentioned negative aspects.
Category Total Bio. Chem.
Selection problems 39 25 14
Eye pains and glasses 26 13 13
Real object too big 24 14 10
Visualization &
superposition
22 3 19
Headphones and sound 12 6 6
Errors and other problems 11 8 3
Total 134 69 65
In both sessions the students accused eye pains
provoked by the shuttering of the wireless glasses.
(“It was something wrong with glasses. They were
blinking”). This is the second major category of
negative aspects after selection problems. Students
also complained about sound problems.
In the Biology scenario, students mainly
complained about selection problems which are
related to the big real object and a small selection
area. They also found it difficult to select small
organs such as duodenum or pancreas. Visualization,
including observing the real objects through the
screen created more problems in the Chemistry
SIGMAP 2008 - International Conference on Signal Processing and Multimedia Applications
374

scenario. Students complained about the difficulty to
distinguish the color of the real ball because of the
augmentation displayed on the screen.
The real object was too big in the first scenario
(torso) and difficult to manipulate (balls) in the
second scenario: “I didn't like the fact that torso has
to be moved“, “every student should have his own
torso“. This corresponds to the lower rating of the
items 14 (Collaborating with colleagues is easy) and
19 (I like interacting with real objects) in the
Biology scenario.
4 CONCLUSIONS AND FUTURE
WORK
The comparative evaluation of subjective measures
of user satisfactions based on quantitative and
qualitative data collected with the usability
questionnaire reveals several aspects both for the AR
platform and for each application scenario.
The analysis of quantitative and qualitative data
revealed the educational and motivational value of
the ARTP. The learning scenario is good for
learning, good for testing, and makes it easier to
understand and remember the lesson. ARTP makes
learning more interesting, is attractive, stimulating
and exciting. The students liked the interaction with
3D objects using AR techniques as well as the
multimodal user guidance. The students appreciated
the ARTP as useful for learning and expressed an
interest to use it in the future.
Participants to the summer school found the
Chemistry scenario more attractive. This scenario is
more complex and interesting since it is using two
kinds of real objects, gives more freedom to the
users (they could choose colored balls and build
different things with them) and is based on a more
interesting interaction paradigm (building with
guidance). Assigning semantics to a colored ball by
placing it onto the periodic table makes the task
more interesting.
Several usability problems exist that have been
identified by both questionnaire data and log file
analysis. The clarity of the visual perception should
be improved as well as the overall ease of use. Since
many students complained about eye pains provoked
by the shuttering of the wireless stereo glasses, it is
strongly recommended to replace them with wired
stereo glasses.
Overall, the comparative evaluation was a useful
aid for designers since it revealed strengths /
weaknesses of each scenario and helped to improve
the educational potential of the AR platform.
The usability questionnaire is intended to support
both formative and summative usability evaluation.
In this respect, the comparative usability evaluation
performed during the summer school is a first step to
a summative evaluation of the ARTP. In order to
gather enough data we restarted user testing in 2008,
on improved versions of both scenarios.
ACKNOWLEDGEMENTS
We gratefully acknowledge the support of the
ARiSE research project, funded under FP6-027039.
REFERENCES
Azuma, R., 1997. A Survey of Augmented Reality.
PRESENCE: Teleoperators and Virtual Environments,
Vol. 6, No. 4, pp. 355-385.
Bach, C., Scapin, D., 2004. Obstacles and perspectives for
Evaluating mixed Reality Eystems Usability. In. Mixer
workshop, Proceedings of IUI-CADUI Conference
2004, pp. 72-79. ACM Press.
Bowman, D., Gabbard, J., and Hix, D., 2002. A Survey of
Usability Evaluation in Virtual Environments:
Classification and Comparison of Methods. Presence:
Teleoperators and Virtual Environments, vol. 11, no.
4, pp. 404-424
Davis, F.D., Bagozzi, R.P., Warshaw, P.R., 1989. User
Acceptance of Computer Technology: A Comparison
of Two Theoretical Models, Management Science,
Vol. 35, No. 8, pp. 982-1003.
Dillon, A. and Morris, M., 1998. From "can they?" to "will
they?": extending usability evaluation to address
acceptance. AIS Conference, Baltimore, August 1998.
Gabbard, J., Hix, D., Swan, E., Livingston, M., Herer, T.,
Julier, S., Baillot, Y. & Brown, D., 2004. A Cost-
Effective Usability Evaluation Progression for Novel
Interactive Systems. In Proceedings of Hawaii
International Conference on Systems Sciences, Track
9, p. 90276c, IEEE.
ISO 9126-1:2001 Software Engineering - Software
product quality. Part 1: Quality model.
Scriven, M., 1991. Evaluation thesaurus. 4th ed. Newbury
Park, CA: Sage Publications.
Swann II, J., E., Gabbard, J., 2005. Survey of User-Based
Experimentation in Augmented Reality. In.
Proceedings of 1
st
International Conference on Virtual
Reality. July 22-27, Las Vegas, Nevada, 2005.
Venkatesh, V., Davis, F.D., Morris, M.G., 2007. Dead Or
Alive? The Development, Trajectory And Future Of
Technology Adoption Research. Journal of the AIS,
Vol. 8, Issue 4, pp. 267-286.
Wind, J., Riege, K., Bogen M., 2007. Spinnstube®: A
Seated Augmented Reality Display System, In Virtual
Environments, Proceedings of IPT-EGVE – EG/ACM
Symposium, pp. 17-23., Eurographics.
A COMPARATIVE USABILITY EVALUATION OF TWO AUGMENTED REALITY LEARNING SCENARIOS
375
