
STATIC FEATURES IN ISOLATED VOWEL RECOGNITION AT
HIGH PITCH
An´ıbal Ferreira
Faculdade de Engenharia da Universidade do Porto, SEEGNAL Research, Portugal
Keywords:
Vowel perception, automatic vowel recognition.
Abstract:
Vowel recognition is frequently based on Linear Prediction (LP) analysis and formant estimation techniques.
However, the performance of these techniques decreases in the case of female or child speech because at high
pitch frequencies (F0) the magnitude spectrum is scarcely sampled making formant estimation unreliable.
In this paper we describe the implementation of a perceptually motivated concept of vowel recognition that is
based on Perceptual Spectral Clusters (PSC) of harmonic partials. PSC based features were evaluated in auto-
matic recognition tests using the Mahalanobis distance and using a data base of five natural Portuguese vowel
sounds uttered by 44 speakers, 27 of whom are child speakers. LP based features and Mel-Frequency Cepstral
Coefficients (MFCC) were also included in the tests as a reference. Results show that while the recognition
performance of PSC features falls between that of LP based features and that of MFCC coefficients, the nor-
malization of PSC features by F0 increases the performance and approaches that of MFCC coefficients. PSC
features are not only amenable to a psychophysical interpretation (as LP based features are) but have also the
potential to compete with global shape features such as MFCCs.
1 INTRODUCTION
Real-time visual feedback of acoustic features ex-
tracted from vowel utterances is required in interac-
tive applications designed to assist in speech therapy
and language learning or rehabilitation programs. It is
also desirable that automatic vowel recognition is car-
ried out within a time delay that is commensurate with
human performance in recognizing isolated vowels.
Most approaches used to recognize short (voiced)
vowel utterances are based on formant estimation us-
ing Linear Prediction (LP) techniques (Zahorian and
Jagharghi, 1993). These techniques assume that the
production of voiced sounds by the human phonetic
system can be modeled as an all-pole filter that is ex-
cited by a periodic train of glottal pulses. The rep-
etition rate of these pulses corresponds to the funda-
mental frequency (F0), or pitch, and the poles of the
all-pole filter correspond to resonances of the vocal
tract, or formants. The fundamental frequency of the
speech uttered by a human speaker may vary over a
range of almost four octaves (50 Hz to 800 Hz) and
in singing may extend from 50 to 1800 Hz (Hess,
1983, page 64). The frequencies of the first three for-
mants (F1, F2, F3) are usually considered as good
acoustic correlates of a given vowel (Fant, 1970).
Although formants are linked to source production
concepts and models, they also possess a very ap-
pealing psychophysical interpretation since they can
be associated with peaks in the magnitude spectrum,
which makes the correlation with vowel perception
very tempting. However, automatic vowelrecognition
based on formant estimation is only reliable when F0
is significantly lower than the lowest formant (F1), a
problem that has been addressed by de Cheveign´e as a
problem of missing-data model of vowel identification
(Cheveign´e and Kawahara, 1999). When F0 is com-
parable to or higher than F1, which typically happens
in female and child speech, or singing, LP techniques
are not reliable because the magnitude spectrum be-
comes undersampled (i.e., it is sampled only at in-
teger multiples of the pitch frequency). A frequent
observation is that the estimated formant frequencies
are ‘locked’ to harmonics in the magnitude spectrum
(Mollis, 2005).
In this paper we focus on static features and we
present research results using a new concept of vowel
perception(PerceptualSpectral Cluster) that builds on
the perception pitch and timbre, both being percep-
tual sensations. The PSC concept attempts to identify
clusters of harmonic partials whose features, namely
63
Ferreira A. (2008).
STATIC FEATURES IN ISOLATED VOWEL RECOGNITION AT HIGH PITCH.
In Proceedings of the International Conference on Signal Processing and Multimedia Applications, pages 63-68
DOI: 10.5220/0001934500630068
Copyright
c
SciTePress
Center of Gravity (COG), left and right borders, and
average spectral power, give rise to relevant percep-
tual cues that we believe are used by the human au-
ditory system to recognize and discriminate among
vowels.
The rest of this paper is structured as follows. In
section 2 we describe the PSC concept and address
the estimation of PSC related features when pitch is
either seen as an additional feature, or when it is used
as an explicit normalization factor. In section 3 we
describe the classification criterion used in the auto-
matic vowel recognition tests and present two sets of
known features that have been used as a reference in
those tests. In section 4 we characterize the training
and testing data base. In section 5 we discuss the main
results and conclusions of the vowel recognition tests.
Section 6 summarizes and concludes the paper.
2 THE PERCEPTUAL SPECTRAL
CLUSTER CONCEPT
The PSC concept has found inspiration on Klatt’s dis-
cussion regarding ‘prominent energy concentrations’
in the magnitude spectrum of a vowel sound (Klatt,
1982), and first experimental results have been re-
ported in (Ferreira, 2005) and further investigated in
(Ferreira, 2007).
The PSC concept is strongly rooted on the idea
that the human recognition of a sustained voiced
vowel results from both the identification of its pitch
and timbre, both being perceptual sensations. It is
known that the partials of a harmonic structure are
fused (or integrated)on a single pitch perception,even
if some of the partials are missing (Moore, 1989). On
the other hand, timbre is commonly seen as the ‘color’
of a sound and, in the case of a harmonic sound such
as a voiced vowel utterance, depends on the spectral
power of its partials. Thus, for a voiced vowel sound,
timbre analysis requires the identification of the un-
derlying harmonic structure. The PSC concept builds
on this perceptual integration of partials pertaining
to the same harmonic structure, and tries to identify
clusters of harmonic partials and their attributes, that
explain the ability of the human auditory system to
discriminate among vowels. It is thus admitted that
a second level of perceptual integration involving the
harmonic partials within each PSC is carried out by
the human auditory system.
2.1 Estimation of PSCs
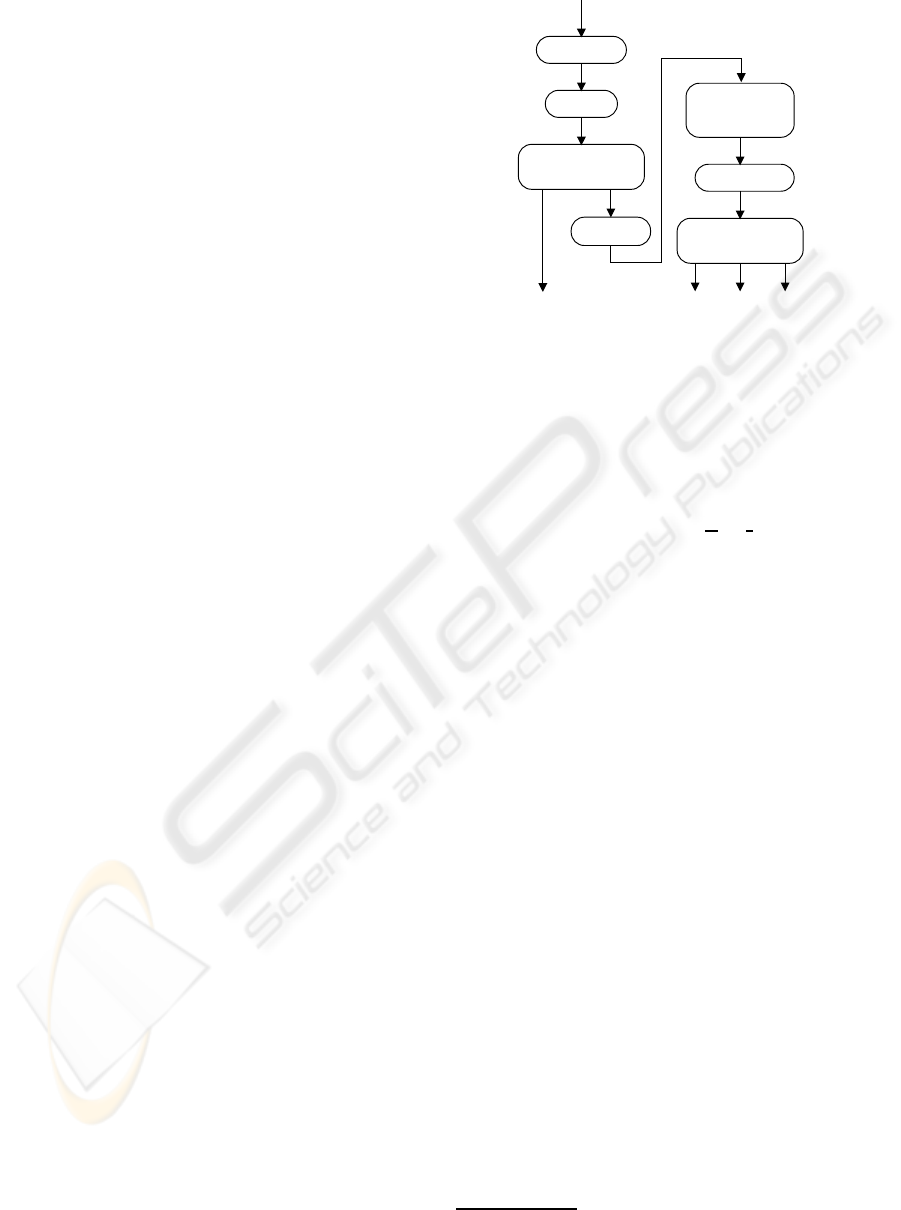
PSC features are extracted after PSC boundaries have
been estimated according to the algorithm illustrated
COG(1, 2) PSCR difdB
F0
audioPCM
analysis
pitch & harmonic
| ODFT |
windowing
smoothing
PSC merge
PSC
feature extraction
PSC
pre-processing
Figure 1: Estimation of PSC boundaries and PSC features.
in Fig. 1. Each audio frame of audio samples,
x(n), is 32 ms long (1024 samples, 32 kHz sam-
pling frequency) and adjacent frames are 50% over-
lapped. A frame is first multiplied by the square
root of a shifted Hanning window, h(n), before being
transformed to the Odd-DFT domain by computing
X
ODFT
(k) =
∑
N−1
n=0
h(n)x(n)e
− j
2π
N
(k+
1
2
)n
. A pitch and
harmonic analysis is subsequently implemented using
a frequency domain pitch estimator (Hess, 1983) that
takes into account the specificity of the Odd-DFT and
analysis window (Ferreira, 2007).
The lower and upper borders and average spec-
tral power of each PSC are found as a result of a
PSC pre-processing and merge operations. First, a
new frequency domain is created that includes all
harmonic partials in the magnitude spectrum of the
voiced vowel, and then a magnitude smoothing in
the new frequency domain is implemented so as to
avoid small local peaks. All local peaks are subse-
quently identified as potential PSC candidates. Start-
ing from the center of each PSC candidate, left and
right borders are found by integrating into the PSC
neighboring partials whose magnitude is not below 8
dB
1
the average magnitude of the PSC (this value is
updated every time one more partial is integrated into
the PSC). This PSC pre-processing does not merge
different PSCs, but may result in PSCs with abutting
borders corresponding to local minima. These PSC
are first identified and, if their absolute magnitude
difference is below 8 dB, PSCs are merged. Finally,
adjacent but non-abutting PSCs are identified and, if
sufficiently close to each other, their magnitude dif-
ference is tested and eventually they are merged.
This algorithm is iterated for each frame till there
are no more PSCs to merge. Subsequently, a mapping
1
This value has been found experimentally (Ferreira,
2007).
SIGMAP 2008 - International Conference on Signal Processing and Multimedia Applications
64
to the original frequency domain is performed of the
boundaries and average magnitude of all PSCs found.
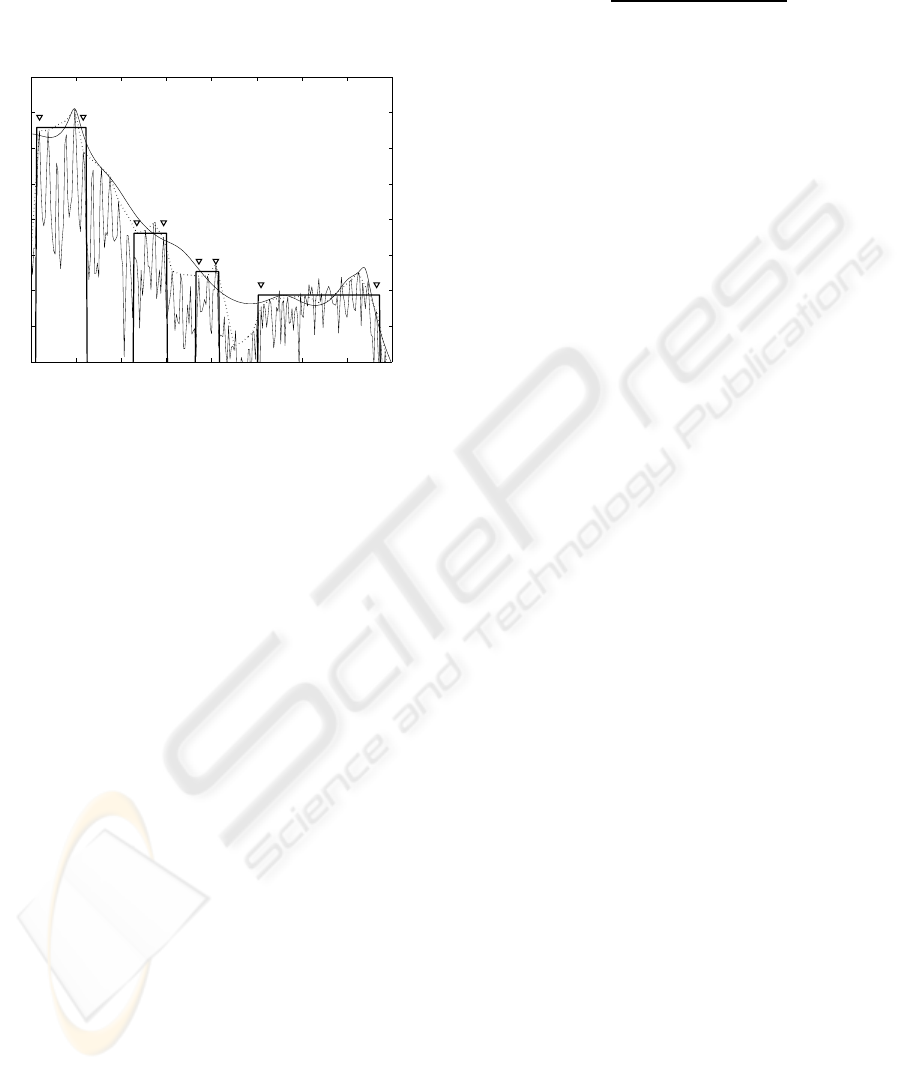
As one example, Fig. 2 depicts the result of the algo-
rithm for one frame of the sound corresponding to a
vowel /a/ uttered by a female speaker.
0 1 2 3 4 5 6 7 8
60
70
80
90
100
110
120
130
140
FREQUENCY (kHz)
MAGNITUDE (dB)
Figure 2: Short-time PSD of a sound frame corresponding
to the utterance of vowel /a/ by a female speaker (thin solid
line), spectral envelope derived from the magnitudes of the
harmonic partials and after smoothing (dotted line), spec-
tral envelope model derived from Linear Prediction analy-
sis with order 16 (smooth solid line), and identification of
the borders (triangle symbols) and magnitude of the PSCs
found (thick solid line).
2.2 PSC Features
The preliminary results reported in (Ferreira, 2005),
and our experiments involving analysis, modification
and re-synthesis of natural vowel utterances (Ferreira,
2007) suggest that after the automatic identification of
the two PSCs with highest average magnitude (PSC1
and PSC2, PSC1 being on the left of PSC2), a feature
vector including as few as five features should be able
to provide good classification results. The chosen fea-
tures are:
1. pitch frequency (F0),
2. center of gravity of PSC1 (COG1),
3. center of gravity of PSC2 (COG2),
4. right border of PSC1 (PSCR),
5. dB difference between the average magnitude of
PSC1 and that of PSC2 (difdB).
A PSC feature vector is therefore obtained as
[v
PSC
]
T
= [F0, COG1, PSCR, COG2, difdB]. (1)
If ω
L
and ω
R
are respectively the frequencies of the
left and right borders of a PSC (on the harmonic do-
main), with L and R integers and L ≤ R, the COG
frequency is obtained as
COG =
∑
R
k=L
ω
k
|X
ODFT
(ω
k
)|
2
∑
R
k=L
|X
ODFT
(ω
k
)|
2
. (2)
The definition of ‘center of gravity’ given here, dif-
fers significantly from the definition given by other
authors (e.g., (Chistovich and Lublinskaja, 1979)) to
the same concept although there are some aspects in
common. In fact, other authors support that in the
case back vowels, for which typically the first two
formants (F1 and F2) are very close together, the hu-
man auditory system does not perceive the two for-
mants separately, but performs instead a spectral inte-
gration spanning a frequency range of about 3,5 Bark
(or about 350 Hz at low frequencies). Thus, stim-
uli with formants closer than this limit are found to
be perceptually equivalent to one peak stimulus, with
the peak position determined by the center gravity of
the original two peaks. PSCs also share the spectral
integration assumption but are not constrained to be
3,5 Barks wide. In particular, some PSCs have been
found to be as narrow as a single harmonic partial.
2.3 F0-Normalized PSC Features
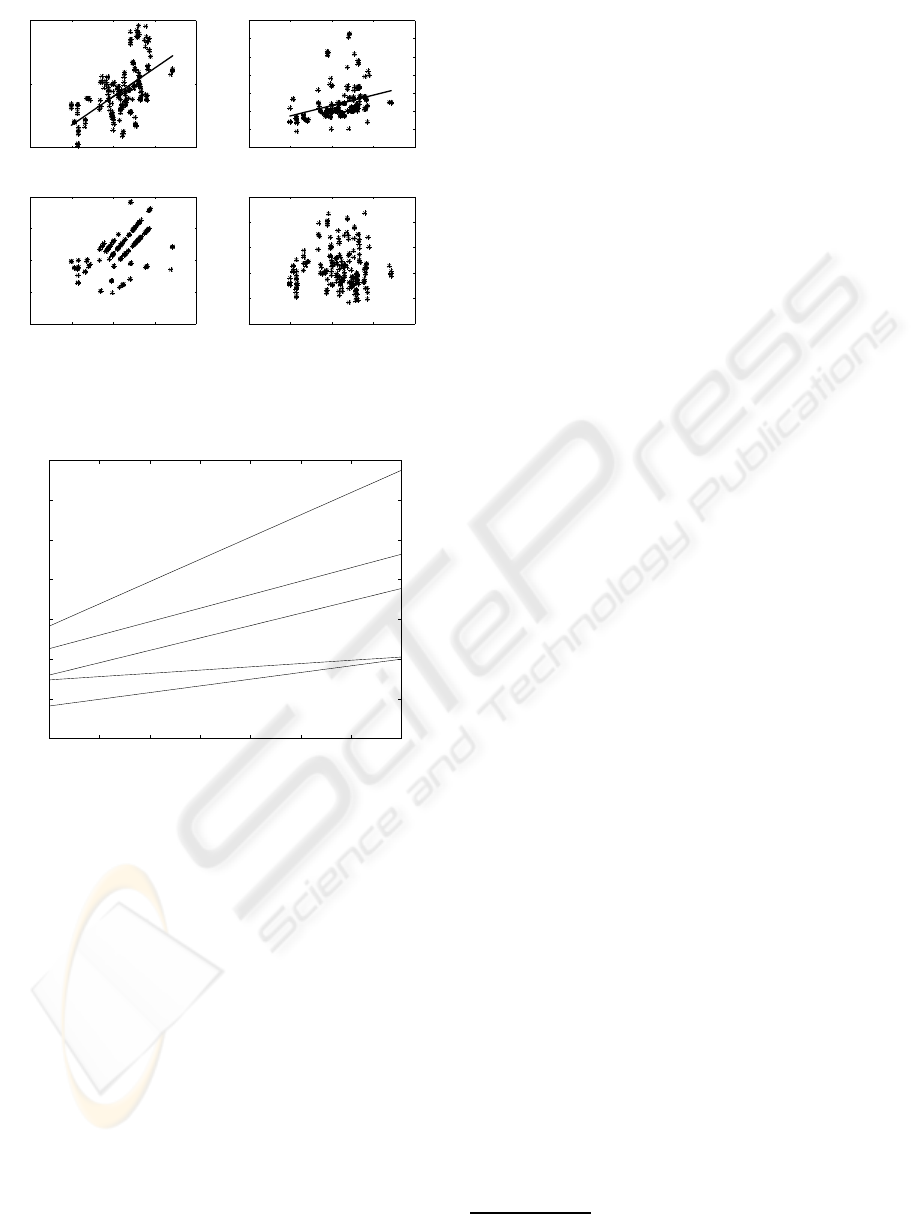
Fig. 3 illustrates the scattergrams of the selected
PSC features for vowel /a/, and reflects the analy-
sis of the complete data base (i.e., 44 speakers × 5
frames/vowel =220 tokens). Each scattergram is rep-
resented as a function of the pitch frequency. It can
be seen that features COG1 and COG2 exhibit a clear
dependency on F0, which is denoted by the slope of
the illustrated lines that best fit the data in the least
squares sense. This is consistent with a known similar
effect regarding formants (Rabiner and Juang, 1993).
The dependency of PSCR on F0 is not as well evident
because of the peculiar representation of its scatter-
gram (Ferreira, 2007). The difdB feature does not ex-
hibit any statistically relevant dependency on F0 for
any vowel.
Fig. 4 represents the lines that best fit COG1 data
for all tested vowels. This figure clearly shows that
there is common trend for all vowels: COG1 is pro-
portional to F0. As a consequence, more tuned sta-
tistical models are obtained if COG1 data is normal-
ized by the pitch frequency. The average slope of the
line that best fits the proportionality trend has been
found to be 1.17 Hz/Hz. A similar evaluation regard-
ing COG2 led to the value of 4.37 Hz/Hz. Although a
value has also been found concerning PSCR, it did not
impact on the recognition results. An alternative PSC
feature vector can therefore be obtained after normal-
ization of COG1 and COG2 by the respective normal-
STATIC FEATURES IN ISOLATED VOWEL RECOGNITION AT HIGH PITCH
65
0 100 200 300 400
0.5
1
1.5
COG1
FREQUENCY (kHz)
0 100 200 300 400
1
2
3
4
5
6
7
8
COG2
FREQUENCY (kHz)
0 100 200 300 400
0.5
1
1.5
2
2.5
PSCR
PITCH FREQUENCY (Hz)
FREQUENCY (kHz)
0 100 200 300 400
0
10
20
30
40
50
difdB
PITCH FREQUENCY (Hz)
ATTENUATION (dB)
Figure 3: Scattergrams of the selected PSC features regard-
ing vowel /a/, as a function of the pitch frequency. The lines
in the COG1 and COG2 scattergrams represent the linear
models that best fit the data in the least squares sense.
50 100 150 200 250 300 350 400
0
200
400
600
800
1000
1200
1400
/a/
/e/
/i/
/o/
/u/
F0 FREQUENCY (Hz)
COG1 FREQUENCY (Hz)
Figure 4: Spectrogram of vowels /a/, /e/, /i/, /o/, /u/ by
FEM2.
ization factors, and excluding pitch:
[v
′
PSC
]
T
= [COG1
′
, PSCR, COG2
′
, difdB]. (3)
3 AUTOMATIC RECOGNITION
TESTS
In order to evaluate the relative performance of PSC
features in the automatic recognition of high pitched
vowel sounds, we have used two alternative feature
extraction techniques: plain LP analysis and polyno-
mial root analysis, and MFCC (Rabiner and Juang,
1993). The first technique corresponds to the classic
technique of formant estimation by finding the angu-
lar position of the first four poles (using polynomial
root analysis and excluding those over the real axis of
the Z plane) of the LP filter that models the vocal tract
resonances (Rabiner and Juang, 1993). After denor-
malization of the angular positions to the Hertz scale,
formant frequency estimates F1, F2, F3 and F4 are
obtained and an LP coefficient (LPC) feature vector
is formed, including pitch:
[v
LPC
]
T
= [F0, F1, F2, F3, F4] . (4)
The second technique is implemented using Slaney’s
Auditory Toolbox
2
after adjusting the Matlab code for
32 kHz sampling rate processing and 1024-samples
FFT analysis. The MFCC feature vector is formed
using the first 16 MFCC coefficients excluding the en-
ergy coefficient (i.e., c
0
):
[v
MFCC
]
T
= [c
1
, c
2
, . . . , c
16
]. (5)
Our classification criterion is based on the Maha-
lanobis distance, defined as
d
2
= (v− µ)
T
C
−1
(v− µ). (6)
In this equation v represents the multivariate feature
vector (test vector), and µ and C represent, respec-
tively, the mean vector and covariance matrix com-
puted from the training data for a specific vowel. By
forcing C to be diagonal, the correlation among fea-
tures in the feature vector are ignored, and the Maha-
lanobis distance reduces to the normalized Euclidean
distance. Classification results have been obtained by
taking about 91% of the data for training (correspond-
ing to 40 speakers) and the remaining 9% for testing
(corresponding to 4 speakers), and by accumulating
results of 11 trials such that all data in the data base is
included once in the test data. Thus, training and test-
ing data are mutually exclusive. The classification of
a test vector is decided after the evaluation of the Ma-
halanobis distance to all vowel templates, by chosing
the vowel that minimizes the distance.
4 TRAINING AND TESTING
DATA BASE
Given that our focus is on vowel recognition of nat-
ural utterances at high pitch, for our recordings we
recruited volunteer speakers (mainly child and female
speakers) from a kindergarten school, an elementary
school (in both cases after parental consent), and an
university school. In total, 27 child speakers (with
a predominance of 5 and 9 years old speakers), 11
adult female speakers and 6 adult male speakers have
participated in the recordings (Ferreira, 2007). Each
2
http://cobweb.ecn.purdue.edu/∼malcolm/interval/1998-
010/
SIGMAP 2008 - International Conference on Signal Processing and Multimedia Applications
66

speaker was asked to utter in sequence and in a sus-
tained way, the most common tonic Portuguese vow-
els: /a/, /e/, /i/, /o/, /u/. After the recordings, the vowel
sounds were edited and the most stationary 100 ms -
long region was manually segmented, labeled, and en-
tered into the data base. A total of 220 (=44 speakers
× 5 vowels) labeled sounds are included in the data
base
3
. It is safe to say that human performance in the
recognition of any vowel in the data base is 100%.
5 RESULTS AND DISCUSSION
Table 1 shows the overall recognition scores due to
the different feature sets and when the covariance ma-
trix is diagonalized in the Mahalanobis distance (ex-
cept when indicated). The lowest performance is ob-
Table 1: Correct recognition scores (in percent) for the dif-
ferent feature sets.
v
LPC
v
PSC
v
PSC
v
′
PSC
v
MFCC
(full C)
73.8 82.2 88.4 86.8 90.9
tained for the plain LPC features, in the order of 74%
correct identification, which is reasonably in line with
results from other authors (for example, (Zahorian
and Jagharghi, 1993) report 75% correct identification
when the feature vector includes 4 formant features
and F0). The highest performance is obtained for
MFCC features which confirms that MFCCs are able
to capture discriminative static cues more effectively
than all other tested features. A clear advantage of
MFCCs results from the fact that both spectral peaks
and spectral valleys are equally well modeled, and not
only spectral peaks as in the case of LP analysis. PSC
features obtain intermediate scores and it is significant
that when PSC features are normalized by the pitch
frequency, performance (about 87%) approaches the
case when full covariance matrix is used in the Maha-
lanobis distance and the features are not normalized
(about 88%). This is an indication that the normaliza-
tion is effectively able to capture the correlation be-
tween F0 and COG1 and COG2. Table 2 shows the
confusion matrix and helps to better explain how the
value of 86.8% is obtained. This table reveals that
while the best recognition scores are obtained in the
recognition of vowels /a/ and /u/, the poorest scores
are obtained in the recognition of vowels /i/ and /o/,
that most frequently were misclassified as /u/ and /a/
respectively. This problem may be explained due to
3
This data base is available from the author upon re-
quest.
Table 2: Confusion matrix for vowel recognition using the
v
′
PSC
feature set.
/a/ /e/ /i/ /o/ /u/
/a/ 91.8 - - 8.2 -
/e/ - 84.1 3.6 9.1 3.2
/i/ - 2.3 81.2 - 15.9
/o/ 15.5 0.5 - 81.8 2.2
/u/ - 1.8 0.5 3.2 94.5
the proximity in those cases of the means of the Gaus-
sian models related to COG1 feature. These results
are however significantly better than those reported in
(Ferreira, 2007) (about 78%) where the normalization
of PSC features by F0 is implemented using the lines
that best fit the data for each individual vowel, instead
of a single normalization line for all vowels, as con-
sidered in this paper.
Although PSC scores compare favorably to those
obtained with LPC features, which was the main goal
of our research given the reasonable psychophysical
interpretation that exists in both cases, it is also clear
that the performance of the chosen PSC features is
slighly inferior to that of MFCC features. MFCCs are
global shape features that ignore pitch information,
which makes the result a bit surprising. However, our
results and experimental tests (Ferreira, 2007) con-
firm conclusions by other authors that a perceptual
adaptation concerningpitch frequencyis likely to take
place in the recognition of vowels by humans. Thus,
it is likely that either new PSC features can be found
that approach MFCC scores, or that MFCC scores can
be further improved by using explicit pitch informa-
tion. These are topics for further research.
6 CONCLUSIONS
In this paper we have proposed an implementation
of the Perceptual Spectral Cluster concept that at-
tempts to model the perceptual processing of the hu-
man auditory system in recognizing vowel sounds at
high pitch. Automatic vowel recognition experiments
focusing on static features have shown that pitch-
normalized PSC features perform significantly better
than LP-formant features but perform slightly worse
than MFCC features. However, these results are en-
couraging and recommend further research on alter-
native PSC features, or on a perceptually more appro-
priate utilization of the pitch information since it fa-
cilitates auditory object separation. This makes pos-
sible the recognition of different simultaneous vowel
sounds that are captured by a single microphone,
which is not possible using MFCCs.
STATIC FEATURES IN ISOLATED VOWEL RECOGNITION AT HIGH PITCH
67

REFERENCES
Cheveign´e, A. and Kawahara, H. (1999). Missing-data
model of vowel identification. Journal of the Acousti-
cal Society of America, 105(6):3497–3508.
Chistovich, L. and Lublinskaja, V. (1979). The center of
gravity effect in vowel spectra and critical distance
between the formants: psychoacoustical study of per-
ception of vowel-like stimuli. In Hearing Research,
volume 1, pages 185–195.
Fant, G. (1970). Acoustic Theory of Speech Production. The
Hague.
Ferreira, A. J. S. (2005). New signal features for robust
identification of isolated vowels. In 9th European
Conference on Speech Communication and Techology
(Interspeech-2005), pages 345–348.
Ferreira, A. J. S. (2007). Static features in real-time recog-
nition of isolated vowels at high pitch. Journal of the
Acoustical Society of America, 112(4):2389–2404.
Hess, W. (1983). Pitch Determination of Speech Signals
-algorithms and devices. Springer-Verlag.
Klatt, D. H. (1982). Prediction of perceived phonetic dis-
tance from critical-band spectra - a first step. In IEEE
International Conference on Acoustics, Speech and
Signal Processing, pages 1278–1281.
Mollis, M. R. (2005). Evaluating models of vowel percep-
tion. Journal of the Acoustical Society of America,
118(2):1062–1071.
Moore, B. C. J. (1989). An Introduction to the Psychology
of Hearing. Academic Press.
Rabiner, L. and Juang, B.-H. (1993). Fundamentals of
Speech Recognition. Prentice-Hall, Inc.
Zahorian, S. A. and Jagharghi, A. J. (1993). Spectral-
shape features versus formants as acoustic correlates
for vowels. Journal of the Acoustical Society of Amer-
ica, 94(4):1966–1982.
SIGMAP 2008 - International Conference on Signal Processing and Multimedia Applications
68
