
REVERBERATION ASSESSMENT IN AUDIOBAND SPEECH
SIGNALS FOR TELEPRESENCE SYSTEMS
A. A. de Lima, F. P. Freeland, P. A. A. Esquef, L. W. P. Biscainho
B. C. Bispo, R. A. de Jesus, S. L. Netto
PEE/COPPE, Federal University of Rio de Janeiro - Rio de Janeiro, Brazil
R. Schafer, A. Said, B. Lee, A. Kalker
HP Labs - Palo Alto, U.S.A.
Keywords:
Acoustic signal processing, speech communication, speech quality evaluation, reverberation modeling.
Abstract:
Modern telepresence systems constitute a new challenge for quality assessment of multimedia signals. This
paper focuses on the evaluation of the reverberation impairment for audioband speech signals. A review on
the reverberation effect is presented, with emphasis given on the mathematical modeling of its components,
including early reflections and late reverberation. A subjective test for evaluating the human perception of
the reverberation phenomenon is completely described, from its conception to the final results. Analyses are
provided comparing the average subjective grades to current quality-evaluation standards for speech and audio
signals. It is observed that the PESQ and PEAQ objective algorithms constitute interesting starting points for
developing an objective method for measuring the reverberation effect on speech signals.
1 INTRODUCTION
In recent years, teleconference systems have evolved
to telepresence systems, which provide high-quality
video and speech signals, enabling a more realistic
meeting experience. This superior level of service
is commonly accomplished through a dedicated data
network, which delivers the required high data rates
for up to three HDTV signals and audioband (up to
24 kHz) speech signals. To ensure user satisfaction at
high levels, the performance of the telepresence sys-
tem is continuously supervised by quality monitors.
According to (Perkins et al., 1999), the three
classes of impairments that historically dominated
the transmission quality of speech in telecommu-
nications were: loudness loss (reduction in signal
strength); noise (from the circuit itself and other in-
terfering sources); and echo (where the talker experi-
ences his/her voice after a given transmission delay).
After the introduction of digital technology, the
common noise sources were almost eliminated and
the importance of loudness loss was reduced, since
noise removal allowed effortless signal amplification.
More recently, teleconference/telepresence systems
introduced other impairments that demand improve-
ments in the models used to represent signal degrada-
tion within the system. In this scenario, the main im-
pairments currently considered are: background noise
(possibly generated by an air-conditioner, a computer,
or any other source in room A or B); echo (signal
from room A returning to this room through speaker-
microphone coupling in room B); and reverberation
(acoustical properties of rooms A or B being im-
posed to the signal that leaves or enters the rooms).
Among these three impairments, reverberation is the
most intricate one, thus deserving a deeper analysis
description as proposed in this work. Other chal-
lenges to be considered come from the increase in the
allowed speech bandwidth, which demands new ob-
jective methods for quality evaluation.
This work deals with the issue of evaluating re-
verberation levels in audioband speech signals in a
telepresence context. The paper is organized as fol-
lows: in Section 2, the reverberation impairment is
revisited in the light of the application at hand; in Sec-
tion 3, classic reverberation models are discussed and
a slight modification of Gardner’s full reverberator is
proposed; in Section 4, subjective tests for evaluat-
ing the human perception of the reverberation effect
in audioband speech signals are described. Results of
these tests are presented and analyzed, indicating an
interesting strategy to the objective assessment of the
257
A. de Lima A., P. Freeland F., A. A. Esquef P., W. P. Biscainho L., C. Bispo B., A. de Jesus R., L. Netto S., Schafer R., Said A., Lee B. and Kalker A.
(2008).
REVERBERATION ASSESSMENT IN AUDIOBAND SPEECH SIGNALS FOR TELEPRESENCE SYSTEMS.
In Proceedings of the International Conference on Signal Processing and Multimedia Applications, pages 257-262
DOI: 10.5220/0001936602570262
Copyright
c
SciTePress

reverberation effect. Finally, Section 5 concludes the
paper emphasizing its main contributions.
2 REVERBERATION
DEFINITION
Reverberation corresponds to the modification of a
signal by the acoustic response of the enclosure in
which the signal source is placed. Excessive rever-
beration reduces the intelligibility of speech and de-
grades the performance of acoustic echo cancelers in
case of hands-free communication—as mentioned in
ITU-T Software Tool Library (ITU-T Rec. G.191,
2005), which includes some reverberation models.
A room impulse response (RIR) is usually mod-
eled as a finite-duration impulse response (FIR) that
can be measured between the location of a specific
source and that of the receiver. Thus, it is possible
to imprint room-related acoustical modifications to a
possibly anechoic source s(k) by its convolution with
a room impulse response RIR(k), i.e.,
s
rev
(k) =
N−1
∑
l=0
RIR(l)s(k−l), (1)
where s
rev
(k) is the resulting reverberated signal and
N is the length of RIR(k). In order to compare the
original and modified signals, their respective powers
should be matched by an adequate level scaling.
The reverberation effect associated with a given
RIR can be divided into two distinct sections: early
reflections and late reverberation, as seen in Figure 1.
The early reflections, which can be directly linked to
the room geometry, correspond to the first 80∼100
ms and are commonly modeled by FIR filters. The
late reverberation dominates over the early reflections
after a certain transition point and extends itself to the
end of the RIR duration. This final part of the RIR is
nearly diffuse, which means that the magnitude and
direction of the sound pressure can be considered as
randomly distributed. Moreover, its magnitude typi-
cally decays exponentially over time. In practice, the
late reverberation is commonly modeled by infinite-
duration impulse response (IIR) filters.
An important parameter associated with the re-
verberation effect is the so-called reverberation time
T
60
, defined as the time that it takes for the sound-
pressure-level of a steady-state excitation within a
room to decrease 60 dB after being abruptly stopped.
The reverberation time T
60
for a given room can be
estimated from Sabine’s formula (Gardner, 1992):
T
60
= 0.161(Vol/S
e
), (2)
0 50 100 150 200
0
0.2
0.4
0.6
0.8
1
Magnitude
Time (ms)
EARLY
REFLECTIONS
LATE
REVERBERATION
Figure 1: Artificial RIR depicting the early and late rever-
beration sections.
where Vol is the room volume and S
e
is the effective
room area, determined as
S
e
=
L
∑
i=1
(1−r
i
)S
i
, (3)
where S
i
and r
i
are the area and reflection coefficient,
respectively, for each of the i = 1,2,...,L room walls.
3 REVERBERATION MODELING
3.1 Early Reflections Via Image Method
The early reflections are characterized by exponen-
tially decaying echoes in the RIR, with associated
gain and delay values. These parameters are com-
monly obtained using the image method (Allen and
Berkley, 1979), which consists of representing the
room as a shoebox with the microphone and sound
source at given predefined positions, as depicted in
Figure 2. The walls then act like acoustic mirrors and
produce several layers of virtual sources as reflections
of both the original and the virtual sound sources. The
delays are proportional to the distance of the sources
(real and virtual) to the microphone. The gains de-
pend on these same distances and on the reflection
coefficients of all walls crossed by each signal path.
3.2 Schroeder’s Late Reverberator
The first model for artificially producing late rever-
beration was presented in (Schroeder, 1962). The ba-
sic units to implement the Schroeder’s late reverber-
ators are the comb and all-pass comb filters, whose
diagrams are shown in Figure 3.
SIGMAP 2008 - International Conference on Signal Processing and Multimedia Applications
258

source
virtual
source
virtual
source
virtual
source
virtual
source
virtual
source
virtual
source
virtual
source
virtual
source
microphone
Figure 2: Image method concept.
OUTIN
z
−M
g
IN OUT
z
−M
−g
g
(a) (b)
Figure 3: Basic units for Schroeder’s late reverberator: (a)
Comb filter; (b) All-pass comb filter.
The transfer function of the comb filter is given by
H
c
(z) =
z
−M
1−gz
−M
, (4)
where g ≤ 1 is the feedback gain and M is the delay
length in samples. The associated impulse response
is an exponentially decaying sequence of impulses
spaced M samples apart. The frequency response is
shaped like a comb, with M periodic peaks that cor-
respond to the pole frequencies. The relation among
the comb filter parameters and the reverberation time
is given by
20log
10
(g)
MT
s
=
−60
T
60
, (5)
where T
s
is the sampling period. The parallel combi-
nation of comb filters with pure delays results in a fre-
quency response that contains the peaks contributed
by all individual comb filters, being the resulting echo
density given by the sum of the individual densities.
The transfer function of the all-pass comb filter is
given by
H
ac
(z) =
z
−M
−g
1−gz
−M
. (6)
Short delays M correspond to widely spaced fre-
quency peaks, which yield an unpleasant character-
istic timbre. By increasing the delay length, a higher
peak density ensues, but at the cost of a decrease in
echo density in the time domain. Such decrease will
be perceived as a discrete set of echoes, rather than a
smooth diffuse decay. The series combination of all-
pass comb filters helps increasing echo density with-
out affecting the magnitude response of the system.
The complete Schroeder’s reverberator uses a par-
allel combination of comb filters cascaded with a se-
rial combination of all-pass comb filters. Practical im-
plementation guidelines for this device can be found
in (Gardner, 1998).
3.3 Feedback Delay Networks (FDN)
The feedback delay networks (Jot and Chaigne, 1991)
constitute a generalization of unitary multichannel
networks, which are N-dimensional counterparts of
the all-pass comb filter, where N is the number of
delay lines in the FDN diagram given in Figure 4.
In this structure, the a
ij
coefficients control the feed-
back level for the output of the jth delay to the in-
put of the ith delay. This structure can generate
much higher echo densities than the parallel comb fil-
ters, given a sufficient number of non-zero feedback
coefficients and pure delay lengths. The choice of
the delays is made according to Schroeder’s sugges-
tion (Schroeder, 1962).
In the FDN structure, the lowpass filters
H
i
(z) = k
i
1−b
i
1−b
i
z
−1
, (7)
where b
i
= 1 − 2/
1+ k
i
(1−1/ε)
, with
ε = T
60
(π)/T
60
(0) and k
i
= 10
−3M
i
T
s
/T
60
(0)
, keep
the reverberation time of the low frequency compo-
nents (T
60
(0)) larger than that of the higher frequency
components (T
60
(π)). The tone-corrector filter
T(z) = g
t
1−b
t
z
−1
1−b
t
, (8)
where g
t
=
p
(T
s
/T
60
(0)
∑
M
i
) and b
t
= (1 −
√
ε)/(1 +
√
ε), compensates for the distortion in the
frequency response envelope introduced by the H
i
(z)
filters.
3.4 Gardner’s Late Reverberator
Gardner’s late reverberation model (Gardner, 1992)
considers three different schemes according to the re-
verberation time ranges, as indicated in Table 1.
Table 1: Reverberation time ranges × reverberator model.
Reverberation time (s) Reverberator model
0.38 ≤T
60
≤ 0.57 Small room model
0.58 ≤T
60
≤ 1.29 Medium room model
1.30 ≤ T
60
< ∞ Large room model
Gardner’s model uses the idea of nested all-pass
filters, which are based directly on the all-pass comb
REVERBERATION ASSESSMENT IN AUDIOBAND SPEECH SIGNALS FOR TELEPRESENCE SYSTEMS
259

OUT
a
22
a
11
a
13
a
12
a
21
a
31
a
33
a
32
a
23
IN
b
1
b
2
b
3
z
−M
1
z
−M
2
z
−M
3
H
1
(z)
H
2
(z)
H
3
(z)
c
1
c
2
c
3
d
T(z)
Figure 4: Feedback delay networks (N = 3) for modeling the late reverberation.
IN OUT
g
out
−g
out
−g
in
g
in
z
−(M
out
−M
in
)
z
−M
in
Figure 5: Single nested all-pass filter for Gardner’s late re-
verberator.
time
energy
late reverberation
decay
early reflections
time
energy
decay
late reverberation
early reflections
(a) (b)
Figure 6: Combining early reflections with late reverbera-
tion: (a) Gardner’s approach; (b) Modified approach.
filter represented in Figure 3(b). The main idea con-
sists of replacing the z
−M
delay in the all-pass comb
filter by one or more all-pass filters. For instance, in
the single nested case, shown in Figure 5, the delay
unit is replaced by an all-pass filter with gain g
in
and
delay z
−M
in
, followed by a delay z
−(M
out
−M
in
)
, such
that M
out
> M
in
. In the double nested structure, the
usual delay is replaced by two all-pass filters in se-
ries with gains g
in1
,g
in2
and delays z
−M
in1
,z
−M
in2
, fol-
lowed by a delay z
−(M
out
−M
in1
−M
in2
)
, such that M
out
>
(M
in1
+ M
in2
). The single and double nested all-pass
figures are used to implement Gardner’s late reverber-
ation models included in (Gardner, 1992) for the three
distinct room types included in Table 1.
3.5 Gardner’s Modified Full
Reverberator
Figure 6(a) shows the combination approach pro-
posed in (Gardner, 1992) of the early reflections with
the late reverberation portions of a particular RIR. In
this method, an exponential decay corresponding to
the desired reverberation time is adjusted to the peak
energy of the first reflection and serves as a reference
to the late reverberation, whose peak follows immedi-
ately after the end of the early reflections. This may
cause an energy increase in the associated RIR right
at the junction of its two portions, as indicated in Fig-
ure 6(a), which is uncommon in real RIRs.
Therefore, a modification is suggested in order to
achieve a smoother RIR, as illustrated in Figure 6(b).
The modified scheme equalizes the energy of the two
RIR portions at their junction, while still forcing the
late reverberation to fit under the exponential decay
determined by the desired T
60
. This alternative ap-
proach yielded a more natural perception of the re-
verberation behavior as judged by informal listening
tests.
4 SUBJECTIVE EVALUATION OF
REVERBERATION
4.1 Test Specification
The reverberation effect in audioband high-quality
speech signals was assessed subjectively.
Each original signal was recorded in a profes-
sional studio, digitally sampled at 48 kHz, using 24
bits per sample, and normalized to −26 dBov. Four
different speakers (two female and two male) partici-
pated in the recording process, which was performed
in a small room, acoustically treated, using different
distances to the microphone: 10 cm for female-1, 30
cm for male-1 and male-2, and 100 cm for female-
2. For these source-receiver locations the T
60
of the
room, estimated according to (Schroeder, 1965), was
in the range 150∼280 ms.
Each evaluated signal consisted of 2 Brazilian-
Portuguese sentences, of duration between 2 and 3
seconds each, uttered by the same speaker. Sen-
SIGMAP 2008 - International Conference on Signal Processing and Multimedia Applications
260

tences were separated in time by a mute interval of
500 ms and were preceded and succeeded by about
200∼300 ms of silence. Before concatenation, the
original recordings were convolved with a set of RIRs
to incorporate the reverberation effect. Considering
the application at hand, the artificially produced re-
verberation was chosen to vary within the range T
60
=
{200, 300,400,500,600,700}ms.
For all artificial RIRs, the early reflections were
obtained via the image method, using a room of di-
mensions 4m-length, 3m-width, and 3m-height. As
regards the late reverberation, the FDN method was
used to simulate T
60
= {200,300,400} ms, since
informal listening tests indicated that this method
lose naturalness above this range. The modified
version of Gardner’s method, which is conceived
to simulate higher reverberation times, was used
for T
60
= {500, 600,700} ms. For each RIR, the
corresponding T
60
was evaluated using Schroeder’s
method (Schroeder, 1965), resulting in the pre-
dicted/obtained correspondence shown in Table 2.
Table 2: Desired and estimated reverberation times for the
artificial RIRs used in the experiments.
Desired T
60
(ms) Estimated T
60
(ms)
200 196
300 292
400 387
500 469
600 574
700 664
The subjective test comprised signals from the 4
speakers, with 3 repetitions of each desired T
60
from
the set {196,292, 387,469,574,664}. Additional 8
original signals were included in the test to serve as
benchmark material, reaching a total of [(4×3×6)+
8] = 80 signals.
4.2 Test Results
A total of 26 listeners judged the overall “quality” of
each signal using a grade range 1 ≤ G ≤ 5, with 0.1
resolution. The mean opinion scores (MOS) for each
T
60
are shown in Figure 7, where one can notice that:
• Anchor refers to the original unprocessed signals,
which in fact are non-anechoic;
• For the speech stimuli filtered by the ar-
tificial RIRs, corresponding to T
60
=
{196, 292,387,469,574,664}, longer rever-
beration times evoked lower MOS;
• The MOS attributed to the anchors is similar to
that of the signals filtered through the RIR with
T
60
= 196 ms. This seems to indicate that the
natural reverberation in the original speech stim-
uli sets an upper bound to MOS that is below the
value that would be achievable if anechoic stimuli
had otherwise been employed.
As expected, the importance of the T
60
parameter in
characterizing reverberation is clearly demonstrated
by the relationship between MOS and T
60
shown in
Figure 7. Nevertheless, one shall remember that T
60
is not the sole determinant of the final subjective
score (Allen, 1982).
Figure 7: MOS for each T
60
(with confidence interval of one
standard deviation).
The subjective scores for all sentences were
statistically correlated to the corresponding re-
sults from several objective quality-evaluation meth-
ods (de Lima et al., 2008), such as PESQ (ITU-T Rec.
P.862, 2001), wideband-PESQ (ITU-T Rec. P.862.2,
2005), P.563 (ITU-T Rec. P.563, 2004), advanced and
basic PEAQ (ITU-R Rec. BS.1387, 1998), and Rnon-
lin (Tan et al., 2004). The results are summarized in
Table 3. It must be noted that, except for PEAQ and
Rnonlin, the aforementioned methods are intended
for quality assessment of speech-band (4 or 8 kHz)
signals. Therefore, comparisons with audioband sub-
jective tests should be carefully made.
Table 3: Statistical correlation ρ between subjective (MOS)
and objective grades.
Objective method ρ
PESQ 0.84
W-PESQ 0.79
P.563 0.45
PEAQ Basic 0.49
PEAQ Adv. 0.23
Rnonlin 0.83
PEMO-Q 0.55
The relatively weak correlations in this table are
somewhat expected, since none of the objective meth-
ods was designed to evaluate speech impairment by
reverberation. Yet, the almost 85% correlation be-
tween MOS and PESQ measures is surprisingly good.
REVERBERATION ASSESSMENT IN AUDIOBAND SPEECH SIGNALS FOR TELEPRESENCE SYSTEMS
261
In addition, if one refers to each of the PEAQ in-
ternal model output variables (MOVs), the statistical
correlation in some cases is also near the 85% mark,
as indicated in Table 4.
Table 4: Statistical correlation ρ between MOS and PEAQ
(basic and advanced) internal MOVs.
PEAQ Basic ρ PEAQ Adv. ρ
MOV MOV
1 0.02 1 −0.82
2 0.02 2 −0.73
3 −0.51 3 −0.50
4 −0.79 4 0.46
5 −0.61 5 −0.65
6 0.46 - -
7 −0.75 - -
8 −0.84 - -
9 −0.71 - -
10 −0.36 - -
11 −0.55 - -
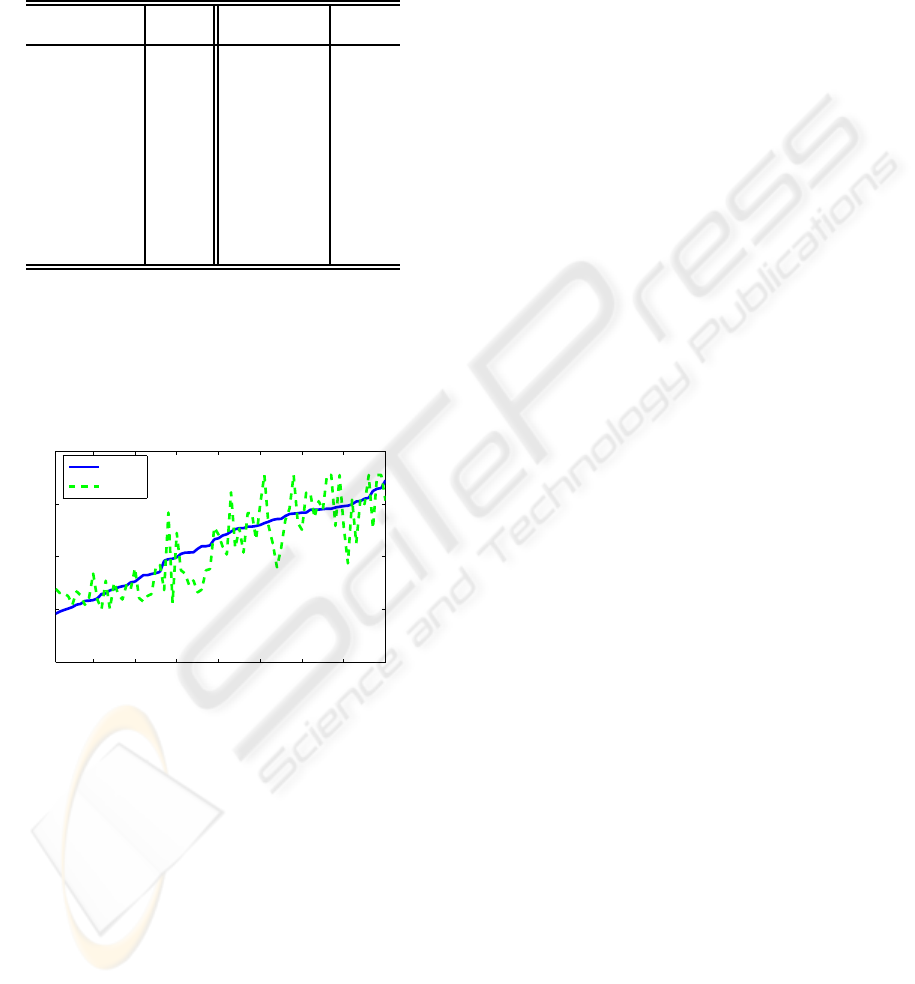
The MOS attributed to each test sentence, or-
ganized by increasing order, is shown in Figure 8.
Furthermore, it includes the corresponding objec-
tive grades yielded by the PESQ method, since they
strongly correlate with MOS, as indicated in Table 3.
10 20 30 40 50 60 70 80
1
2
3
4
5
Test signal index (sorted by MOS)
Rating
MOS
PESQ
Figure 8: MOS and PESQ grades for all test signals.
Overall, the results shown in Tables 3 and 4 as
well as in Figure 8 suggest that the both the PESQ
and the PEAQ standards may provide a starting point
to the development of an effective objective method
for quality assessment of audioband speech signals
degraded by reverberation.
5 CONCLUSIONS
This paper addressed the problem of quality evalu-
ation of audioband (24 kHz) speech signals with re-
spect to the reverberation effect. Mathematical mod-
els were reviewed and the most important reverber-
ation aspects for the application at hand were indi-
cated. Subjective listening tests were designed and
performed to quantify via MOS the human percep-
tion of speech impairment by reverberation. Corre-
lation between objective and subjective quality mea-
sures have been computed in order to verify the po-
tential ability of standard quality-evaluation methods
in predicting the subjective quality of speech signals
spoiled by reverberation.
REFERENCES
Allen, J. B. (1982). Effects of small room reverberation on
subjective preference. J. Acoustic. Soc. Am., 71:S5.
Allen, J. B. and Berkley, D. A. (1979). Image method for
efficiently simulating small-room acoustics. J. Acous-
tic. Soc. Am., 65(4):943–950.
de Lima, A. A., Freeland, F. P., de Jesus, R. A., Bispo, B. C.,
Biscainho, L. W. P., Netto, S. L., Said, A., Kalker, A.,
Schafer, R., Lee, B., and Jam, M. (2008). On the qual-
ity assessment of sound signals. In Proc. IEEE Int.
Symp. on Circuits and Systems. pp. 426–429, Seattle,
USA.
Gardner, W. G. (1992). The virtual acoustic room. Mas-
ter’s thesis, School of Architecture and Planning, MIT,
Cambridge, USA.
Gardner, W. G. (1998). Applications of Digital Signal Pro-
cessing, chapter Reverberation Algorithms, pp. 85–
131. Kluwer, New York, USA.
ITU-R Rec. BS.1387 (1998). Method for objective mea-
surements of perceived audio quality. ITU.
ITU-T Rec. G.191 (2005). Software tools for speech and
audio coding standardization. ITU.
ITU-T Rec. P.563 (2004). Single-ended method for ob-
jective speech quality assessment in narrow-band tele-
phony applications. ITU.
ITU-T Rec. P.862 (2001). Perceptual evaluation of speech
quality (PESQ): Objective method for end-to-end
speech quality assessment of narrow band telephone
networks and speech codecs. ITU.
ITU-T Rec. P.862.2 (2005). Wideband extension to rec-
ommendation P.862 for the assessment of wideband
telephone networks and speech codecs. ITU.
Jot, J.-M. and Chaigne, A. (1991). Digital delay networks
for designing artificial reverberators. Presented at the
90th Convention of the AES. Preprint 3030.
Perkins, M. E., Dvorak, C. A., Lerich, B. H., and Zebarth,
J. A. (1999). Speech transmission performance plan-
ning in hybrid IP/SCN networks. IEEE Commun.
Mag., 37(7):126–131.
Schroeder, M. R. (1962). Natural sounding artificial rever-
beration. J. Audio Eng. Soc., 10(3):219–233.
Schroeder, M. R. (1965). New method of measuring rever-
beration time. J. Acoustic. Soc. Am., 37:409–412.
Tan, C., Moore, B. C. J., Zacharov, N., and Mattila, V.
(2004). Predicting the perceived quality of nonlinearly
distorted music and speech signals. J. Audio Eng. Soc.,
52(7/8).
SIGMAP 2008 - International Conference on Signal Processing and Multimedia Applications
262
