
BIRTH-DEATH FREQUENCIES VARIANCE OF SINUSOIDAL
MODEL
A New Feature for Audio Classification
Shahrokh Ghaemmaghami
1
and Jalil Shirazi
2
1
Sharif University of Technology, Tehran, Iran
2
Islamic Azad University, Gonabad Branch, Gonabad, Iran
Keywords: Audio classification, sinusoidal model.
Abstract: In this paper, a new feature set for audio classification is presented and evaluated based on sinusoidal
modeling of audio signals. Variance of the birth-death frequencies in sinusoidal model of signal, as a
measure of harmony, is used and compared to typical features as the input into an audio classifier. The
performance of this sinusoidal model feature is evaluated through classification of audio to speech and
music using both the GMM and the SVM classifiers. Classification results show that the proposed feature is
quite successful in speech/music classification. Experimental comparisons with popular features for audio
classification, such as HZCRR and LSTER, are presented and discussed. By using a set of three features, we
achieved 96.83% accuracy, in one-sec segment based audio classification.
1 INTRODUCTION
Rapid increase in the amount of audio data demands
for an automated method that allows for efficient
segmentation and classification of audio stream
based on its contents. In multimedia applications,
such systems can be useful to achieve automatic
classification, indexing, archiving, and retrieving of
information from large multimedia corpora. Audio
segmentation and classification also have significant
applications in data retrieval, archive management,
modern human-computer interfaces, and
entertainment.
One of basic problems in audio segmentation and
classification is speech/music discrimination. By
rejecting non-speech segments, speech/music
discrimination can play a signification role in speaker
and speech recognition systems. The new generation
of low rate coders and compression technologies
need an estimation of the signal nature to achieve a
higher compression rate. Among them is the work by
EI-Maleh et al. (
Ei-Maleh, 2000) that used LSF (Line
Spectral Frequency) parameters and zero crossing for
frame based speech/music discrimination.
Ajmera et al. (Ajmera, 2002) employed a
posteriori probability based entropy and dynamism
features and reported 82.5% and 79.2% accuracies
for speech and music segments, respectively.
Saunders (Saunders, 1996) used typical features,
such as zero crossing rate and short-time energy, for
a radio broadcast speech/music classifier. For a 2.4
sec segment of audio signals, this work achieved an
accuracy of 98%. Scheirer and Slaney introduced an
audio classification method in (Scheirer, 1997) using
more features and performed experiments based on
different classification models. For the same segment
length of an audio signal (2.4 sec), the overall error
reported was of as low as 1.4%.
Lu et al. (Lu, 2002) applied an algorithm based
on KNN (K-Nearest Neighbor) classifier and LSP
(Line Spectral Pair) -VQ (Vector Quantization) to
determine speech/non-speech segments. Some other
classification approaches have recently been
introduced in the literature that use different
methods, such as nearest feature line (Li, 2000) and
SVM (Support Vector Machine) (Guo, 2003).
In this paper, we propose a sinusoidal model
based feature for audio classification to speech and
music by using the GMM (Gaussian Mixture Model)
and the SVM classifiers. The sinusoidal models of
different orders are tested and evaluated. The model
feature, variance of birth-death frequencies, is
presented and compared to conventional features, e.g.
HZCRR (high zero crossing rate ratio) and LSTER
139
Ghaemmaghami S. and Shirazi J. (2008).
BIRTH-DEATH FREQUENCIES VARIANCE OF SINUSOIDAL MODEL - A New Feature for Audio Classification.
In Proceedings of the International Conference on Signal Processing and Multimedia Applications, pages 139-144
DOI: 10.5220/0001937601390144
Copyright
c
SciTePress
(low short time energy ratio), in terms of the
classification performance.
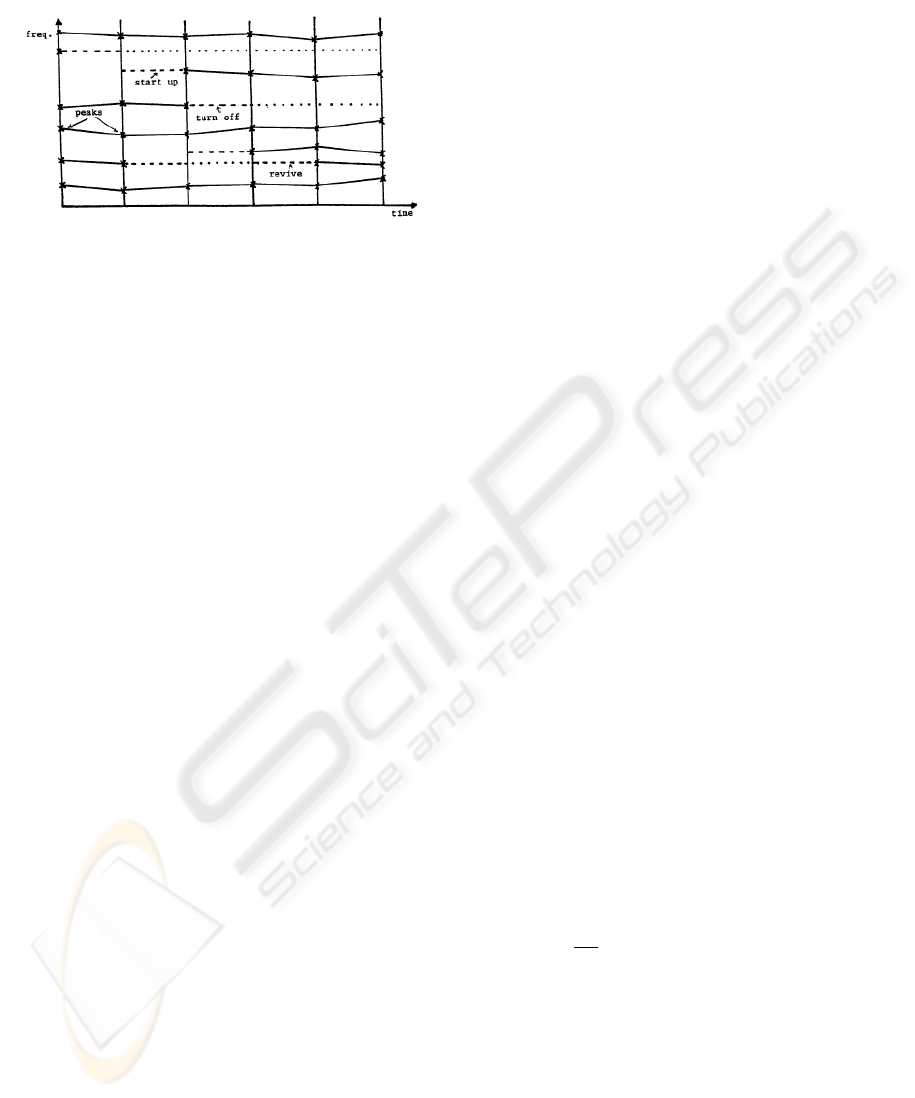
Figure 1: Birth and death of sinusoidal tracks.
This paper is structured as follows. Sinusoidal
modeling of speech signals is briefly described in
section 2. The features used in this study and the
classification methods we have employed are
presented in section 3. The system implementation
and experimental results are presented in section 4
and the features and the classification techniques are
compared in section 5. The paper is concluded in
section 6.
2 SINUSOIDAL MODEL
In this section, a brief overview of sinusoidal
modeling is given and the frequency tracking in the
sinusoidal model is presented.
2.1 McAulay-Quatieri Sinusoidal Model
The McAulay-Quatieri (MQ) algorithm is often used
to produce a sinusoidal representation of sounds
(McAulay, 1986). The algorithm assumes that a large
class of acoustical waveforms can be represented by
a collection of sinusoidal components described by
amplitudes, phases, and frequencies. These
parameters are estimated from the short-time Fourier
transform using a simple peak-picking algorithm.
The sampled sound is first transformed into a two-
dimensional time-frequency representation. Next, the
regions of high time-frequency energy are located,
where the slope of the waveform changes from
positive to negative. The voiced regions can be
modeled by a set of harmonically related sinusoids,
while the unvoiced regions are modeled using non-
harmonic sinusoids.
As the fundamental frequency changes, the
number of peaks from frame to frame changes. The
concept of sinusoidal births and death is used to
explain the movement of spectral peaks between
frames. In order to match spectral peaks, tracks are
formed by connecting peaks between adjacent
frames. A track is dead when there is no peak in the
current frame within
Δ
±
of the frequency of a peak
in the next frame. Correspondingly, a new track is
born if the frequency of a peak in the current frame is
not within
Δ
±
of the frequency of a peak in previous
frame.
Fig. 1 shows the birth and death of frequency
tracks formed by connecting peaks of similar
frequencies between frames.
3 PROPOSED FEATURES AND
ALGORITHMS
In this section, the features extracted in this study are
presented. Then, a brief overview of the GMM and
the SVM classifiers, which we have employed to
evaluate the performance of the proposed features, is
given.
3.1 Feature Analysis
In order to achieve a high accuracy in audio
classification and segmentation, it is critical to
extract features that can capture the major temporal-
spectral characteristics of the signals. To classify
one-second audio segments, we selected: the
HZCRR, the LSTER and a new feature as a measure
of the harmony called BDFV (birth-death
frequencies variance). These features will be
described in detail in this section.
3.1.1 The HZCRR
This feature describes the variations of zero crossing
rates (ZCR). The HZCRR is defined as the ratio of
the number of frames whose zero crossing rates are
grater than 1.5 time of average zero crossing rate in a
one-second window, as:
[]
∑
−
=
+−=
1
0
1)5.1)(sgn(
2
1
N
n
avZCRnZCR
N
HZCRR
(1)
where n is the frame index, ZCR(n) is the zero
crossing rate at frame n, avZCR is the average ZCR,
sgn is sign function, and N is the total number of
frames in a one-second window (Lu, 2002).
Normally, speech signals are composed of alternating
high energy voiced sounds and low energy unvoiced
sounds; while music signals usually do not follow
this structure. Therefore, for music signals, the
HZCRR is usually lower than that of speech.
SIGMAP 2008 - International Conference on Signal Processing and Multimedia Applications
140

3.1.2 The LSTER
This feature describes the variations of short time
energy (STE). The LSTER is defined as the ratio of
the number of frames having energy greater than a
half of the average short time energy in a one-second
window, as:
[]
∑
−
=
+−=
1
0
1))(5.0sgn(
2
1
N
n
nSTEavSTE
N
LSTER
(2)
where n is the frame index, STE(n) is the short time
energy at frame n, avSTE is the average STE, and N
is the total number of frames in a one-second window
(Lu, 2002).
Normally, there are more silence frames in
speech than those in music. Therefore, music signals
have a lower LSTER, as compared to speech, in
general.
3.1.3 The Birth-death Frequencies Variance
This feature describes a measure of the harmony. A
detailed spectral analysis shows that pure music is
more harmonious than speech, since pure speech
contains a sequence of tonal (vowels) and noise-like
(consonants) sounds. Speech is characterized by a
formantic structure, whereas music is characterized
by harmonic structure. The music spectra change
more slowly than speech spectra. Music can be
regarded as a succession of periods of relatively
stable notes and phones, where speech is rather a
rapid succession of noisy periods, such as unvoiced
consonants, and of periods of relatively stable parts,
e.g. vowels.
Speech signals may hardly have a long time
periodic structure. Hence, for speech signal, the
harmony measure in general could be lower than that
of music. This diversity forms our main motivation
for applying sinusoidal modeling, as the technique
for measuring the harmony to the audio classification
problem. Expectedly, a feature of birth and death of
frequencies can discriminate between music and
speech signal quite well, due to diversity in the
harmonic structure.
In this work, the audio signal is divided into
overlapping frames, and then sinusoidal model
analysis is applied to the audio signal in each frame.
Thus, for each frame, a set of frequencies is
generated. These frequency vectors are used for
tracking frequencies. We tested two measures of
tracking frequencies in a one-second window as the
feature. These two measures are: 1) sum of the birth-
death frequencies and 2) variance of the birth-death
frequencies (BDFV) in the one-second window.
We found the latter feature, BDFV,
outperforming the sum of the birth-death frequencies
in all cases in our classification tests. Henceforth, we
just focus on the BDFV in this paper, for the task of
audio classification, which is defined as:
∑
−
=
−=
1
0
2
))((
1
N
n
avBDnBD
N
BDFV
(3)
where n is the frame index, BD(n) is the short time
birth-death frequencies number at frame n, avBD is
the average BD, and N is the total number of frames
in a one-second window.
3.2 Classification Algorithms
3.2.1 Support Vector Machines
In this method, the data is mapped into a high
dimensional space via a nonlinear map, and an
optimal separating hyper-plane, or linear regression
function, is constructed in this space. Given a class
labeled training feature vectors, class boundaries
between two classes are learned through the SVM.
The SVM minimizes the structural risk and can
realize nonlinear discrimination by kernel mapping.
Let
1
{, }
N
iii
xy
=
be a set of N training data points,
where
n
i
x ∈R denotes the i-th input data and
{1, 1}
i
y
∈
−+
is the class label of the data. The SVM
aims at finding a classifier of the form:
1
() ( ,)
N
ii i
i
yx sign yKx x b
α
=
⎡
⎤
=
+
⎢
⎥
⎣
⎦
∑
(4)
where
i
α
are positive real constants,
b
is a real
constant,
(,) (),()
ii
Kx x x x
φφ
=
,
,••
is the inner
product, and
()
x
φ
is the nonlinear map from original
space to the high dimensional space.
The SVM decision function is obtained under
constraints:
∑
=
=
N
i
ii
y
1
0
α
,
,....,1 0 NiC
i
=≤≤
α
where C is a parameter that allows for specifying
how strictly we want the classifier to fit into the
training data
(Guo, 2003).
3.2.2 Gaussian Mixture Model
The GMM classifier models each class of data as the
union of a few multidimensional Gaussian clusters in
the feature space. A GMM is fully represented by:
the mean vectors, covariance matrices, and the
BIRTH-DEATH FREQUENCIES VARIANCE OF SINUSOIDAL MODEL - A New Feature for Audio Classification
141
mixture weights. Given a sequence of feature vectors,
a GMM is trained using the well-known expectation-
maximization (EM) algorithm. The probability
density function of the mixture model of dimension
d, for class i, is given as:
∑
=
=
=
Nk
k
k
NP
1
),,()(
kki
ΓμXW
α
1
1
=
∑
=
=
Nk
k
k
α
(5)
where W
i
denotes the class of the signal, X indicates
the feature vector,
k
μ is for the d-component mean
vector,
k
Γ is the d×d covariance matrix, and
k
α
denotes the mixing probabilities. The GMM
classification uses a likelihood estimate for each
model, which measures how well the new data point
is modeled by the entrained Gaussian clusters. An
unknown vector X in the feature space is assigned to
the class that is found to be the best model for this
vector.
4 EXPERIMENTS
The "music-speech" corpus used in this study is a
collection of 240 15-sec sound files, randomly
selected from the radio programs (Scheirer, 1997).
This corpus is taken as a standard benchmark for
audio system evaluations and has been used in many
audio classification studies (see (Scheirer, 1997) and
(
Berenzweig, 2001)).
For the feature extraction, the audio signal is
partitioned into Hamming windowed frames of 23.2
ms long, with 11.2 ms overlap. The classifier is
evaluated using labeled data sets, each 20 minutes of
speech and music data. Each model is trained with 60
15-sec long training speech files (900 seconds) and
60 15-sec training vocal and non-vocal music files
(900 seconds). Each system tested over 20 15-sec
speech files (300 seconds), 20 15-sec vocal music
files (300 seconds), and 21 15-sec non-vocal music
files (315 seconds). Thus, each system is trained over
120 15-sec files, (1800 seconds) and is tested with 61
15-sec files (915 seconds). For each frame, the
sinusoidal models of different orders are used and
zero padding is employed to increase the peak
detection accuracy (
Smith, 1987). Thus, for each
frame, a set of frequencies in addition to two values
of ZCR and STE are generated.
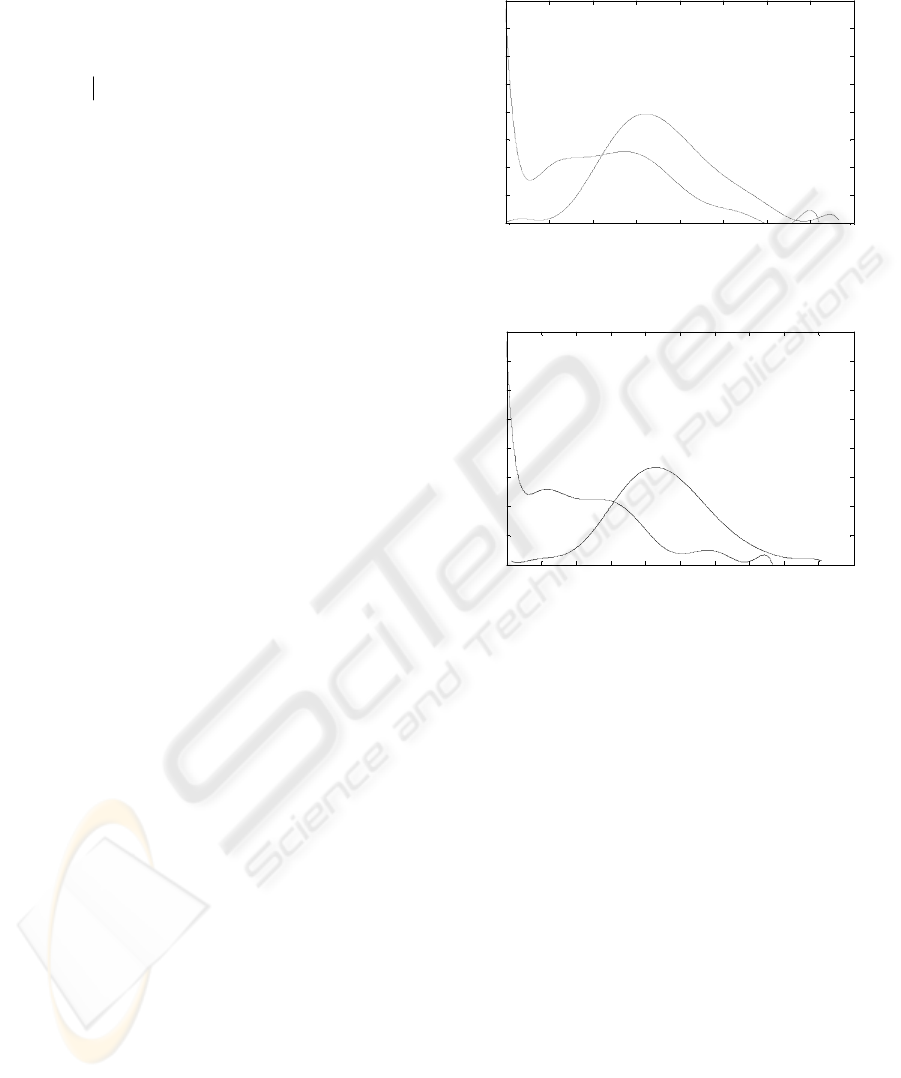
Fig. 2 shows the probability distribution curves of
the HZCRR for music and speech signals. The curves
obtained from the database training files using one-
second window. As shown, there are overlaps
between these two curves and the cross point of two
curves, as a threshold, is 0.11. Fig. 3 shows the
0 0.05 0.1 0.15 0.2 0.25 0.3 0.35 0.4
0
0.02
0.04
0.06
0.08
0.1
0.12
0.14
0.16
HZCRR PDF
HZCRR Value
Probablity
Music
Speech
Figure 2: Probability distribution curves of HZCRR.
0 0.1 0.2 0.3 0.4 0.5 0.6 0.7 0.8 0.9 1
0
0.01
0.02
0.03
0.04
0.05
0.06
0.07
0.08
LSTER PDF
LSTER Value
Probablity
Music
Speech
Music
Speech
Figure 3: Probability distribution curves of LSTER.
probability distribution curves of LSTER for music
and speech signals obtained from the database, where
the cross point of two curves, as a threshold, is 0.32.
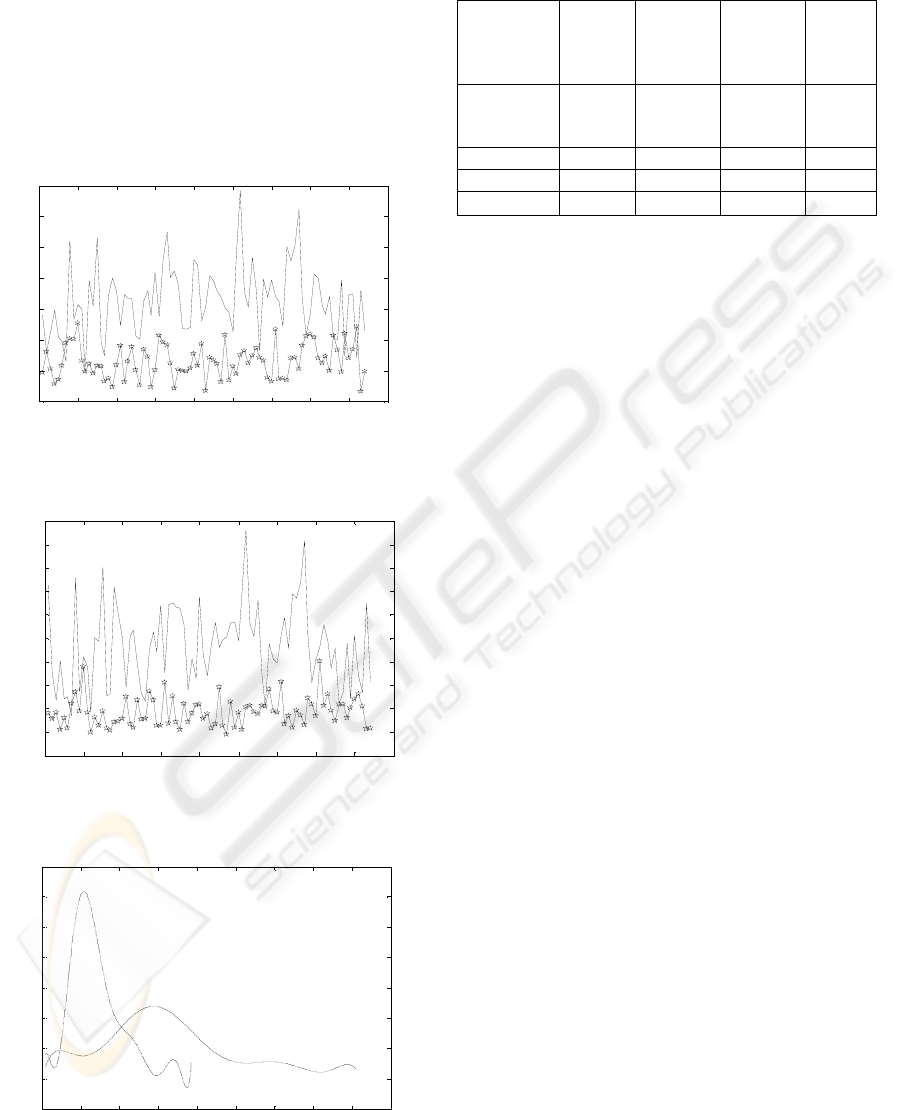
Figures 4 and 5 show the BDFV curves for music
and speech signals for different orders of the
sinusoidal model. The curves are obtained from the
training database using one-second window (86
frames), where the horizontal axis shows the number
of frames. Fig. 6 shows the probability distribution
curves of the BDFV for music and speech signals for
sinusoidal model of order 15. The cross point of two
curves, as a threshold, is 15.5. For music, almost no
BDFV value is above 24.
It is observed in these figures that the BDFV
values for speech are in general higher than those for
music. This is because music is more harmonious and
stable than speech. Therefore, the BDFV is an
effective feature for discriminating speech and music.
The resulting error indicated that no additional
improvement to the signal discrimination was
achieved, when we increased the sinusoidal model
order from 15. Hence, we used sinusoidal model of
order 15 in our experiments.
SIGMAP 2008 - International Conference on Signal Processing and Multimedia Applications
142
In our experiments, we conducted a comparative
evaluation over these three described features. At
first, only one feature was used to discriminate
speech from music, where the cross point of two pdfs
was used as the threshold. The classification errors
are presented in table 1. As shown, the BDFV is an
effective feature for discriminating between speech
and music signals and yields a higher performance,
as compared to the other features.
0 10 20 30 40 50 60 70 80 90
5
10
15
20
25
30
35
40
Birth-death frequencies variance-15
Birth-death frequencies vari ance-15 Value
Seconds/10
Music
Speech
Figure 4: BDFV curves, with sinusoidal model of order 15.
0 10 20 30 40 50 60 70 80 90
10
20
30
40
50
60
70
80
90
100
110
Birth-death frequencies variance-25
Birt h-death frequencies variance-25 Val ue
Seconds/10
Speech
Music
Figure 5: BDFV curves, with sinusoidal model of order 25.
5 10 15 20 25 30 35 40 45 50
0.5
1
1.5
2
2.5
3
3.5
4
4.5
x 10
-3
Birth-death frequencies variance-15 PDF
Birth-death frequencies variance-15 Value
Probablity
Music
Speech
Figure 6: Probability distribution curves of BDFV, with
sinusoidal model of order 15.
Table 1: Classification errors (percentage) with HZCRR,
LSTER and BDFV using the pdfs’ cross-point as threshold.
Total
Length
(sec)
→
300
315 300 915
Features
↓
Speech
Non-
Vocal
Music
Vocal
Music
Total
HZCRR 5 27.61 12.78 23.93
LSTER 16.66 13.96 2.18 12.45
BDFV
18.33 8.57 0.32
9.28
The classification method mentioned so far could
result in high classification accuracy with optimal
thresholds. However, this optimality is almost
unreachable due to actual dependence of thresholds
on the signal characteristics. Therefore, we employed
the GMM and the SVM classifiers which are not
based on a thresholding procedure. We used different
combinations of two conventional features, the
HZCRR and the LSTER, with the BDFV, as the
feature vector of one-second signal and used both the
GMM and the SVM based classification methods for
evaluating the performance of the BDFV.
In the experiments, we used the radial basis
function (RBF) kernel and the parameters C=10 and
σ =1 for the SVM classifier. The second
classification approach was to use the GMM
classifier to model each class of data, speech or
music. At the training step, the feature vectors from
each class are used to train the GMMs. The GMM
parameters are estimated by the EM algorithm and
the classification of an unknown vector was done by
finding the class whose Gaussian distribution came
with the highest probability to produce the vector.
5 RESULTS AND DISCUSSION
We examined the GMM with different numbers of
Gaussians, and found that the optimal order was 4 for
the speech models and 4 for the music models, when
the three described features were used. We made the
same examination with different combinations of the
features using the SVM classifier. Table 2 shows the
resulting performance using the three features and the
two classifiers. As indicated, the SVM and the GMM
classifiers significantly improve the accuracy when
all the three features are used. It is indicated that the
total error introduced using the HZCRR and the
LSTER is 12.13%, as compared to the error of 5.46%
introduced using the HZCRR and the BDFV, and
4.91% using the LSTER and the BDFV. These
BIRTH-DEATH FREQUENCIES VARIANCE OF SINUSOIDAL MODEL - A New Feature for Audio Classification
143

results show a significant improvement to the
classification accuracy obtained from combining the
new feature with the HZCRR, the LSTER, or both.
Table 2: Classification errors (percentage) with different
combinations of the three features using SVM and GMM.
As observed, the total errors introduced using the
three features are 4.69% and 3.17% with the SVM
and the GMM classifiers, respectively. To ensure the
effectiveness of the proposed features, evaluation of
the classification performance is extended to file-
level, in addition to the segment-level evaluation
(one-second window) described earlier. We made this
evaluation based on a majority voting strategy at file-
level. We used the same speech-music database in
this test and reached just 1.63% error, i.e. one speech
file out of 61 speech-music test files.
As shown in table 2, better classification results
are achieved over music files, as compared to speech,
when the
BDFV is used. Most sounds generated by
musical instruments have a harmonic structure,
which is not the case with speech signals that may
have a mixed harmonic/non-harmonic structure due
to their diverse voicing characteristics. This diversity
is well identified by the sinusoidal model that
measures the harmony of the audio signals.
Nevertheless, the BDFV feature of the sinusoidal
model plus the HZCRR and the LSTER form a
powerful feature set for speech/music discrimination.
Still, further performance improvement could be
expected to achieve by combining other features of
the sinusoidal model as an extension to this work.
6 CONCLUSIONS
In this study, we have proposed a new feature based
on the sinusoidal model, called BDFV, for audio
classification to speech and music. This feature is the
variance of the birth-death frequencies in the
sinusoidal model of an audio signal, as a measure of
the harmony. Our classification results show a high
discriminating performance of this feature, as
compared to typical features such as the HZCRR and
the LSTER features that are widely used for audio
classification. It is also revealed that a higher
classification performance is achieved, by combining
this new feature with the HZCRR and the LSTER,
which has been evaluated using the model-based,
insensitive to threshold GMM and the SVM
classifiers. Through this work, it has been shown that
the sinusoidal model features are very effective in
audio classification, due to capability of the model to
identify the harmonic structure.
REFERENCES
Ei-Maleh, K., Klein, M., Petrucci, G., kabal, P. 2000.
Speech/music discrimination for multimedia
Applications. In Proc ICASSP- 2000, pp. 2445-2448.
Ajmera, J., McCowan, I., Bourlard, H., 2002. Robust
HMM based speech/music segmentation. In Proc
ICASSP- 2002, pp. 297-300.
Saunders, J., 1996. Real-time discrimination of broadcast
speech/music. In Proc ICASSP-96, pp. 993-996.
Scheirer, E., Slaney, M., 1997. Construction and evaluation
of a robust multifeature speech/music discriminator. In
Proc. ICASSP- 97, pp. 21-24.
Lu, L., Zhang, H.-J., 2002. Content Analysis for Audio
Classification and Segmentation. In IEEE Trans.
Speech & Audio Proc., vol. 10, pp. 504 – 516.
Li, S. Z., 2000. Content-based audio classification and
retrieval using the nearest feature line method.In IEEE
Trans. Speech & Audio Proc., vol. 8, pp. 619 – 625.
McAulay, R., Quatieri, T., 1986. Speech analysis/synthesis
based on a Sinusoidal representation. In IEEE Trans.
Acous., Speech & Sig. Proc., Vol. ASSP-34, No.4, pp.
744-754.
Smith, J. O., Serra, X., 1987. PARSHL: An
analysis/synthesis program for non-harmonic sound
based on Sinusoidal representation. In http://www-
ccrma.stanford.edu/~jos/parshl/parshl.pdf.
Berenzweig, A. L., Ellis, D. P. W., 2001. Locating singing
voice segments within music signals. In Proc IEEE
WASPAA, Mohonk NY, pp. 119–122.
Guo, G., Li, S. Z., 2003. Content-based audio
classification and retrieval by support vector machines.
In IEEE Trans. Neural Networks Proc., vol. 14, pp.
209-215.
915 300 315 300
Total Length
(sec)
→
Total
Vocal
Music
Non-
Vocal
Music
Speech
Features/
Classifier
↓
12.13 10.66 15.87 9.66 HZCRR+
LSTER/SVM
5.46 0.66 2.53 13.33 HZCRR+
BDFV/SVM
4.91 0.33 2.22 12.33 LSTER+
BDFV/SVM
4.69
0 2.22 12 HZCRR+
LSTER+
BDFV/SVM
3.17
0.66 1.58 9.66 HZCRR+
LSTER+
BDFV/GMM
SIGMAP 2008 - International Conference on Signal Processing and Multimedia Applications
144
