
VIBRATIONAL SPECTROSCOPY (FTIR-ATR AND FT-RAMAN)
A Rapid and Useful Tool for Phycocolloid Analysis
Leonel Pereira
IMAR-CMA, Institute of Marine Research
Department of Botany, FCTUC, University of Coimbra, P-3004-516 Coimbra, Portugal
Ana M. Amado
Molecular Physical Chemistry Group, Department of Chemistry, FCTUC, University of Coimbra
P-3004-535 Coimbra, Portugal
Paulo J. A. Ribeiro-Claro
Department of Chemistry – CICECO, Universty of Aveiro, P-3810-193 Aveiro, Porugal
Fred van de Velde
Wageningen Centre for Food Sciences, P.O. Box 557, 6700 AN Wageningen
NIZO food research, Texture Department, Kernhemseweg 2, P.O. Box 20, 6710 BA Ede, The Netherlands
Keywords: Polysaccharides, Seaweed, Phycocolloid, Carrageenan, FTIR-ATR, FT-Raman.
Abstract: The wide industrial application of phycocolloids (e.g. alginates, agar and carrageenans) is based on their
particular properties to form gels in aqueous solution. Recently, new spectroscopic techniques have
provided more accurate identification of the natural composition of the polysaccharides produced by these
seaweeds. With the combination of two spectroscopic techniques (FTIR-ATR and FT-Raman) it is possible
to identify the principal seaweed colloids in ground seaweed samples as in extracted material. Since the
seaweed samples receive the minimum of handling and treatment (e.g. they are simply dried and ground),
the composition determined represents, as accurately as possible, the native composition of the
phycocolloids.
1 INTRODUCTION
Many seaweeds produce hydrocolloids, associated
with the cell wall and intercellular spaces. Members
of the red algae (Rhodophyta) produce galactans
(e.g. carrageenans and agars) and the brown algae
(Phaeophyceae) produce uronates (alginates).
Carrageenans represent one of the major texturising
ingredients used by the food industry; they are
natural ingredients, which have been used for
decades in food, excepients applications and are
generally regarded as safe (GRAS).
The phycocolloid carrageenin, as it was first
called, was discovered by the British pharmacist
Stanford in 1862 who extracted it from Irish moss
(Chondrus crispus). The name was later changed to
carrageenan so as to comply with the ‘-an' suffix for
the names of polysaccharides. The modern
carrageenan industry dates from the 1940s, receiving
its impetus from the dairy industry where
carrageenan was found to be the ideal stabilizer for
the suspension of cocoa in milk chocolate.
The commercial carrageenans are normally
divided into three main types: kappa, iota and
lambda-carrageenan. Generally, seaweeds do not
produce these idealized and pure carrageenans, but
more likely a range of hybrid structures. Several
other carrageenan repeating units exist: e.g. xi, theta,
131
Pereira L., M. Amado A., J. A. Ribeiro-Claro P. and van de Velde F. (2009).
VIBRATIONAL SPECTROSCOPY (FTIR-ATR AND FT-RAMAN) - A Rapid and Useful Tool for Phycocolloid Analysis.
In Proceedings of the International Conference on Biomedical Electronics and Devices, pages 131-136
DOI: 10.5220/0001121301310136
Copyright
c
SciTePress

beta, mu and nu. The precursors (mu and nu), when
exposed to alkali conditions, are modified into kappa
and iota, respectively, through formation of the 3,6-
anhydro-galactose bridge (Rudolph, 2000).
Infrared (IR) spectroscopy was, until recently the
most frequently used vibrational technique for the
study of the chemical composition of phycocolloids.
This technique presents two main advantages: it
requires minute amounts of sample (milligrams),
and it is non-aggressive method with reliable
accuracy (Givernaud-Mouradi, 1992; Pereira et
al.,2003). However, conventional IR spectroscopy
requires laborious procedures to obtain spectra with
a good signal/noise ratio (Chopin and Whalen,
1993). This limitation was overcome with the
development of interferometric IR techniques
(associated with the Fourier transform algorithm),
known as FTIR spectroscopy (Fourier Transform
IR). More recently, Pereira and collaborators had
used a technique of analysis on the basis of FTIR-
ATR (from Attenuated Total Reflectance)
spectroscopy, allowing for the determination of the
composition of the different phycocolloids from
dried ground seaweed, without having to prepare
tablets of KBr (Pereira, 2006; Pereira and Mesquita,
2004).
In contrast to FTIR, the application of
conventional Raman spectroscopy was limited until
recently, due to need for an incident visible laser in
dispersive spectrometers: the visible laser light often
excites electronic transitions in biochemical
samples, which can lead to either sample
degradation or strong background signal from
unwanted laser-induced fluorescence. The use of
Nd:YAG lasers operating at 1064 nm (far from the
visible region) in interferometric spectrometers has
been generalized to decrease the fluorescence level
and avoid sample degradation. The modern FT-
Raman spectrometers have been used to produce
good quality Raman spectra from seaweed samples.
(Matsuhiro, 1996; Pereira et al., 2003).
In this work, a combined FTIR-ATR and FT-
Raman spectroscopy study were used to identify the
colloid produced by one of the principal source of
carrageenans, the red algae Chondrus crispus. Since
the analysis of ground seaweed samples required
minimal treatment (the seaweeds are simply dried
and ground), the determined composition represents,
as accurately as possible, the natural colloid
composition.
2 MATERIALS AND METHODS
2.1 Algal Material and Standard
Samples of Phycocolloids
Specimens of red algae (Rhodophyceae) Chondrus
crispus are collected in the central zone of the
western coast of Portugal (wild specimens) and other
are cultivated in Canada (lambda strain). Standard
samples were obtained from Sigma (type IV, C-
3889) and CP Kelco (pure lambda-carrageenan).
The sample composition and purity were
controlled by NMR.
2.2 Preparation of Ground Seaweed
Samples for FTIR-ATR and
FT-Raman
The seaweed samples were rinsed in distilled
freshwater to eliminate salt and debris from the
thallus surface and dried to constant weight at 60 ºC.
The dried seaweeds were finely ground in order to
render the samples uniform. For FTIR analysis the
samples do not need additional treatment. The
analysis by FT-Raman requires that these are
without pigmentation. The lack of pigmentation can
be achieved by sun drying (process used by
collectors/producers of commercial seaweeds) or by
pigment elimination in the laboratory by the addition
of acetone/methanol moisture (V/V) or by the
addition of calcium hypochlorite solution (4%, 30/60
s, 4 ºC) (Pereira, 2004).
2.3 Phycocolloid Extraction
Before phycocolloid extraction, the ground dry
material was rehydrated and pre-treated in acetone
followed by ethanol to eliminate the organosoluble
fraction (Zinoun and Cosson, 1996).
For extraction of the native phycocolloid, the
seaweed samples were placed in distilled water (50
ml/g), pH 7 at 85º C for 3 h. For an alkaline-
extraction (resembling the industrial method), the
samples were placed in a solution (150 mL/g) of
NaOH (1 M) at 80-85 ºC for 3-4 h according to
Pereira and Mesquita (2004), and neutralised to pH
6-8 with HCl (0.3 M).
The solutions were hot filtered, twice, under
vacuum, through cloth and glass fibre filter. The
extract was evaporated under vacuum to one-third of
the initial volume. The carrageenan was precipitated
by adding the warm solution to twice its volume of
ethanol (96 %).
BIODEVICES 2009 - International Conference on Biomedical Electronics and Devices
132

Table 1: Carrageenan composition determined by vibrational spectroscopy (FTIR-ATR and FT-Raman) and NMR.
Species/Sample Lifecycle phase Origin
Carrageenan
Yield
1
Alkali
extracted
2
(%mol)
Native
3
Chondrus crispus
Female
gametophyte
Portugal
(Wild)
23.2 % 70.0κ, 28.0ι κ - ι (µ/ν)
C. crispus Tetrasporophyte
Portugal
(Wild)
36.6 % 100.0 λ λ
C. crispus Tetrasporophyte
Canada
(Cultivated)
43.6 % 100.0 λ λ
Sigma - - - 100.0 λ λ
CP-Kelco - - - 100.0 λ λ
1
expressed in percentage of dry weight;
2
composition determined by
1
H-NMR;
3
composition determined by FTIR-ATR and FT-Raman
analysis of ground seaweed samples; the carrageenans are identified according to the Greek lettering system; the letters between
parenthesis ( ) correspond to the biological precursors of the carrageenans, present in native samples.
2.4 FTIR-ATR and FT-Raman
Analysis
The FTIR spectra of sample materials (ground dried
seaweed, native and alkali-modified carrageenan)
were recorded on an IFS 55 spectrometer, using a
Golden Gate single reflection diamond ATR system,
with no need for sample preparation. All spectra are
the average of two independent measurements with
128 scans each at a resolution of 2 cm
-1
.
The corresponding FT-Raman spectra were
recorded on a RFS-100 Bruker FT-spectrometer
using a Nd:YAG laser with an excitation wavelength
of 1064 nm. Each spectrum was the average of two
repeated measurements, with 150 scans at a
resolution of 2 cm
-1
.
2.5 NMR Analysis
1
H-NMR spectra were taken on a Bruker AMX600
spectrometer operating at 500.13 MHz at 65 °C.
Typically 64 scans were taken with an interpulse
delay of 5 s (T
1
values for the resonance of the
anomeric protons of κ- and ι-carrageenan are shorter
than 1.5 s). Sample preparation for the
1
H-NMR
experiments involved dissolving the carrageenan
sample (5 mg mL
-1
) at 80 °C in D
2
O containing 1
mM TSP (3-(trimethylsilyl) propionic-2,2,3,3-d
4
acid sodium salt) and 20 mM Na2HPO4, followed
by sonication for three times 1 h in a sonicator bath
(Branson 2510), according Pereira et al. (2007).
Chemical shifts (δ) are referred to internal TSP
standard (δ = -0.017 ppm) relative to the IUPAC
recommended standard DSS for
1
H according to van
de Velde et al. (2004). Assignments of the
1
H-NMR
spectra were based on the chemical shift data
summarized by van de Velde et al. (2002, 2004).
3 RESULTS AND DISCUSSION
The main results of the analyses are listed in Table
1. The assignments of the IR spectra were mostly
based on the previous work of Chopin et al. (1999)
and Sartori et al. (1997). The Raman spectra were
assigned based on the IR information and on the
comparison between samples of known composition,
controlled by NMR spectroscopy.
The carrageenans are identified by the Greek
lettering and by the letter code proposed by Knutsen
et al. (1994).
Figure 1 presents four different FT-Raman spectra
(Chondrus crispus, female gametophytes),
corresponding to the different tests of
depigmentation to reduce the background signal
from unwanted laser-induced fluorescence in Raman
VIBRATIONAL SPECTROSCOPY (FTIR-ATR AND FT-RAMAN) - A Rapid and Useful Tool for Phycocolloid Analysis
133
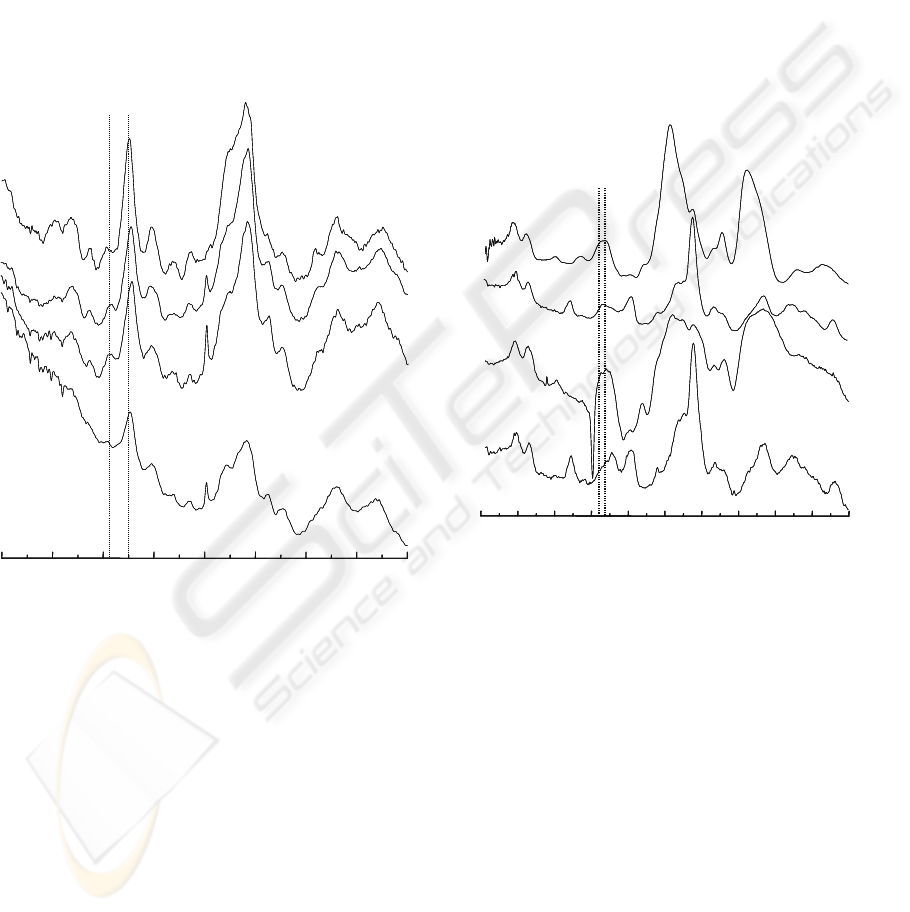
spectroscopy. The spectrum A corresponds to the
ground seaweed treated with a mixture of acetone
and methanol; this presents some fluorescence,
particularly in the spectral area 600-875 cm
-1
and the
peaks are ill-defined. The spectrum B corresponds to
the fresh seaweed treated with calcium hypochlorite
4% (30 s), then dried and milled. The spectrum C
concerns to the ground seaweed (obtained from a
herbarium sample) treated with calcium hypochlorite
4% (30 s). Finally, the spectrum D was obtained
from the native carrageenan (C. crispus water-
extracted) analysis. The last three spectra (B, C, D)
don’t present fluorescence, with peaks well-defined
and without background noise.
600 700 800 900 1000 1100 1200 1300 1400
A
B
C
D
W avenumber (cm
–1
)
805
850
600 700 800 900 1000 1100 1200 1300 1400600 700 800 900 1000 1100 1200 1300 1400
A
B
C
D
W avenumber (cm
–1
)
805
850
Figure 1: FT-Raman spectrum of ground seaweed (C.
crispus female gametophyte) treated with a mixture of
acetone and methanol (A). FT-Raman spectrum of fresh
seaweed treated with calcium hypochlorite 4% (30 s), then
dried and grounded (B). FT-Raman spectrum of ground
seaweed (obtained from a herbarium sample) treated with
calcium hypochlorite 4% (30 s) (C). FT-Raman spectrum
of C. crispus extracted carrageenan (D).
Since this algae produces a hybrid kappa/iota-
carrageenan the diagnoses peaks referenced in
Figure 1 are the 805 cm
-1
(DA2S),corresponding to
iota-carrageenan and 850 cm
-1
(G4S), corresponding
to kappa-carrageenan.
The FTIR-ATR and FT-Raman spectra of
commercial lambda-carrageenan (Sigma) and
ground C. crispus tetrasporophytes are shown in
Figure 2. These samples present high sulphate
content as indicated by the broad band between 820
and 830 cm
-1
in FTIR-ATR spectra. The C. crispus
and lambda-carrageenan FT-Raman spectra show
two combined peaks between 815 and 830 cm
-1
.
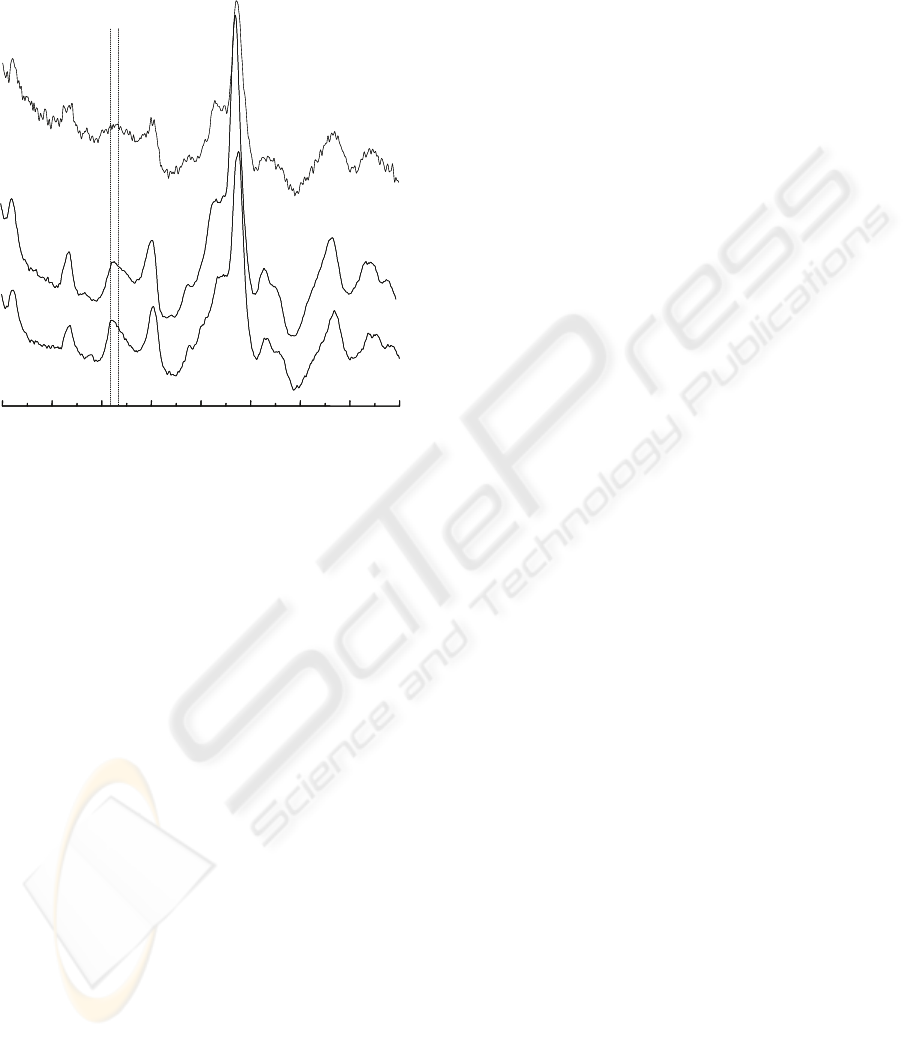
Figure 3 shows the FT-Raman spectra of
commercial sample (CP Kelco) of pure lambda-
carrageenan (A), alkali-extracted carrageenan (B) of
C crispus (tetrasporophyte) and ground seaweed
sample (C) of C. crispus (cultivated strain). The
spectrum of alkali-extracted carrageenan is similar
to that of commercial pure lambda-carrageenan. The
high sulphate content, typical of the lambda variant,
is patent in the spectra, with a presence of two
combined peaks at 815 cm
-1
(G/D6S) and 830 cm
-1
(G/D2S).
A
C
D
B
830
820
500 600 700 800 900 1000 1100 1200 1300 1400 1500
W avenumber (cm
-1
)
A
C
D
B
830
820
500 600 700 800 900 1000 1100 1200 1300 1400 1500500 600 700 800 900 1000 1100 1200 1300 1400 1500
W avenumber (cm
-1
)
Figure 2: FT-Raman (A) and FTIR-ATR (B) spectra of
commercial lambda-carrageenan (Sigma); FT-Raman (C)
and FTIR-ATR (D) spectra of ground seaweed sample
(Chondrus crispus, tetrasporophyte).
4 CONCLUSIONS
The present work confirms the usefulness of FTIR
spectroscopy in the comparative study of
carrageenan types. However, it also shows that the
complementary use of IR and Raman spectroscopy
provides relevant additional information, allowing a
better interpretation of the vibrational spectra and a
more accurate identification of diverse colloids and
variants. In fact, due to the different selection rules,
bands of weak intensity or even absent in the IR
spectra may appear as sharp and intense bands in the
Raman spectra. This is particularly evident, for
instance, in the spectra of different fractions
BIODEVICES 2009 - International Conference on Biomedical Electronics and Devices
134
belonging to the family of lambda-carrageenan
(Pereira et al., 2003) and the biological precursors of
kappa and iota-carrageenan (mu and nu,
respectively) (Pereira and Mesquita, 2004).
600 700 800 900 1000 1100 1200 1300 1400
A
815
830
Wavenumber (cm
-1
)
B
C
600 700 800 900 1000 1100 1200 1300 1400
A
815
830
Wavenumber (cm
-1
)
B
C
Figure 3: FT-Raman spectra: (A) commercial sample of
pure lambda-carrageenan (CP Kelco); Chondrus crispus
(tetrasporophyte) alkali-extracted carrageenan; (C) ground
seaweed sample (C. crispus, cultivated strain).
With the combination of these two spectroscopic
techniques (ATR-FTIR and FT-Raman), it is now
possible the rapid and reliable identification of all
major types of carrageenan, both extracted
carrageenan and grounded material samples. The
joint application of these spectroscopic techniques
has as main advantages:
a) It is a quick and simple methodology in
phycocolloid analysis. Only need few minutes,
instead of several days needed for the extraction of
colloids;
b) Requires small quantities of algal material (a
few grams of weight fresh or milligrams of dry
weight), allowing the analysis of herbarium samples,
even of algae or portions of algae with small size;
c) Since the seaweeds are subject to a process of
minimal manipulation and treatment (they are
simply dried and ground), the determined
composition represents, as accurately as possible,
the natural composition of phycocolloid produced.
Since the vibrational spectrometers are now
standard equipment in many Laboratories, the
techniques described in this work are useful for the
implementation of strategies of sustainable seaweed
harvest, the evaluation of the natural seaweed
composition with industrial potential, the evaluation
and control of the quality of the different batches of
algal material harvested and/or cultivated. These
spectroscopic techniques are also useful to analyze
the composition of pharmaceutical and cosmetic
excepients.
ACKNOWLEDGEMENTS
The authors acknowledge financial support from the
Portuguese Foundation for Science and Technology
– IMAR-CMA (Institute of Marine Research),
Unidade de Química-Física Molecular and
Laboratório Associado CICECO.
REFERENCES
Chopin, T., Kerin, B. F. and Mazerolle, R. (1999).
Phycocolloid chemistry as taxonomic indicator of
phylogeny in the Gigartinales, Rhodophyceae: A
review and current developments using Fourier
transform infrared diffuse reflectance spectroscopy.
Phycological Research, 47, 167-188.
Chopin, T. and Whalen, E. (1993). A new and rapid
method for carrageenan identification by ft-ir diffuse-
reflectance spectroscopy directly on dried, ground
algal material. Carbohydrate Research, 246, 51-59.
Givernaud-Mouradi, A. (1992). Recherches biologiques et
biochimiques pour la production d'agarose chez
Gelidium latifolium (Rhodophycées, Gálidiales). UFR
des Sciences de la Vie et du Comportement (p. 351).
Caen: University de Caen.
Knutsen S.H., Myslabodski, D.E.,Larsen, B. and Usov,
A.I. (1994). A modified system of nomenclature for
red algal galactans. Botanica Mararina, 37(2), 163-
169.
Matsuhiro, B. (1996). Vibrational spectroscopy of
seaweed galactans. Hydrobiologia, 327, 481-489.
Pereira, L., van de Velde, F. and Mesquita, J. F. (2007).
Cytochemical studies on underutilized
carrageenophytes (Gigartinales, Rhodophyta).
International Journal of Biological and Biomedical
Engineering, 1(1), 1-5.
Pereira, L. (2006). Identification of phycocolloids by
vibrational spectroscopy. In A. T. Critchley, M. Ohno,
and D. B. Largo (Eds.), World Seaweed Resources -
An authoritative reference system: ETI Information
Services Ltd.
Pereira, L. and Mesquita, J. F. (2004). Population studies
and carrageenan properties of Chondracanthus teedei
var. lusitanicus (Gigartinaceae, Rhodophyta). Journal
of Applied Phycology, 16(5), 369-383.
Pereira, L. (2004). Estudos em macroalgas carragenófitas
(Gigartinales, Rhodophyceae) da costa portuguesa -
aspectos ecológicos, bioquímicos e citológicos. PhD
VIBRATIONAL SPECTROSCOPY (FTIR-ATR AND FT-RAMAN) - A Rapid and Useful Tool for Phycocolloid Analysis
135

Thesis. Departamento de Botânica - FCTUC (p. 293).
Coimbra: Universidade de Coimbra.
Pereira, L., Sousa, A., Coelho, H., Amado, A. M. and
Ribeiro-Claro, P. J. A. (2003). Use of FTIR, FT-
Raman and
13
C-NMR spectroscopy for identification
of some seaweed phycocolloids. Biomolecular
Engineering, 20(4-6), 223-228.
Rudolph, B. (2000). Seaweed products: red algae of
economic significance. In R. E. Martin (Ed.), Marine
& freshwater products handbook (pp. 515-529).
Lancaster, PA: Technomic Pub. Co.
Sartori, C., Finch, D. S., Ralph, B. and Gilding, K. (1997).
Determination of the cation content of alginate thin
films by FTir spectroscopy. Polymer, 38(1), 43-51.
van de Velde, F. and de Ruiter, G. A. (2002).
Carrageenan. In E. J. Vandamme, S. D. Baets, & A.
Steinbèuchel (Eds.), Biopolymers v. 6.
Polysaccharides II, polysaccharides from eukaryotes
(pp. 245-274). Weinheim; Chichester: Wiley-VCH.
van de Velde, F., Pereira, L. and Rollema, H. S. (2004).
The revised NMR chemical shift data of carrageenans.
Carbohydrate Research, 339(13), 2309-2313.
Zinoun, M. and Cosson, J. (1996). Seasonal variation in
growth and carrageenan content of Calliblepharis
jubata (Rhodophyceae, Gigartinales) from the
Normandy coast, France. Journal of Applied
Phycology, 8(1), 29-34.
BIODEVICES 2009 - International Conference on Biomedical Electronics and Devices
136
