
A MULTIVARIATE STATISTICAL ANALYSIS OF MUSCULAR
BIOPOTENCIAL FOR HUMAN ARM MOVEMENT
CHARACTERIZATION
Giuliano Alves da Silva, Maria Cláudia Ferrari de Castro and Carlos Eduardo Thomaz
Department of Electrical Engineering, Centro Universitário da FEI
Av. Humberto A.C. Branco, 3972, São Bernardo do Campo, São Paulo, CEP 09850-901, Brazil
Keywords: Electromyography, Biceps, Triceps, Linear Transformation, PCA, MLDA, Bhattacharyya Distance.
Abstract: Pattern recognition of electromyographic signals consists of a hard task due to the high dimensionality of
the data and noise presence on the acquired signals. This work intends to study the data set as a multivariate
pattern recognition problem by applying linear transformations to reduce the data dimensionality. Five
volunteers contributed in a previous experiment that acquired the myoelectrical signals using surface
electrodes. Attempts to analyse the groups of acquired data by means of descriptive statistics have shown to
be inconclusive. This works shows that the use of multivariate statistical techniques such as Principal
Components Analysis (PCA) and Maximum uncertainty Linear Discriminant Analysis (MLDA) to
characterize the acquired set of signals through low dimensional scatter plots provides a new understanding
of the data spread, making easier its analysis. Considering the arm horizontal movement and the acquired
set of data used in this research, a multivariate linear separation between the patterns of interest quantified
by the distance of Bhattacharyya suggests that it’s possible not only to characterize the angular joint
position, but also to confirm that different movements recruit similar amounts of energy to be executed.
1 INTRODUCTION
The human movement characterization represents a
great challenge and a relatively new field in the
scientific investigation. Several techniques have
been used in the attempt to describe and classify
these movements (Kleissen et al., 1998; Bittar and
Castro, 2008).
The study of muscular bio-potentials has been
developed impelled by the diagnosis of
neuromuscular disturbances and by the development
of mechanical prostheses for amputees. The
myoelectric signal, through the electromyography,
helps to describe, standardize and define the
operation of the muscular movement. The
electromyography consists of acquiring and
registering the electric signals emitted by the
muscular cells.
Electric signals, generated by motor units in the
skeleton muscles, control the position and the
movements of the limbs, while traveling between the
muscles and the peripheral/central nervous system
(Henneberg, 2000). By acquiring and studying these
signals through the electromyography, it’s possible
to determine patterns of interest and use such
discriminative information to control a wide variety
of devices. Unfortunately this information is not
totally reliable due to a great susceptibility to noise,
redundancy, and the small sample size inherent to
the acquired data set.
This paper introduces some techniques that aim
to improve the understanding and reliability of the
acquired data set by applying multivariate linear
transformations such as Principal Components
Analysis (PCA) (Fukunaga, 1990) and Maximum
uncertainty Linear Discriminant Analysis (MLDA)
(Thomaz et al., 2005). Experiments mixing the
signals provided by the biceps and triceps, in an
experience that intends to identify the angular
position of the arm, have shown that it’s possible to
have a good and reliable separation of myoelectric
signals for further classification.
227
Silva G., Castro M. and Thomaz C. (2009).
A MULTIVARIATE STATISTICAL ANALYSIS OF MUSCULAR BIOPOTENTIAL FOR HUMAN ARM MOVEMENT CHARACTERIZATION.
In Proceedings of the International Conference on Bio-inspired Systems and Signal Processing, pages 227-232
DOI: 10.5220/0001433802270232
Copyright
c
SciTePress

2 EXPERIMENTS
AND METHODS
2.1 Experiments
For the extraction and analysis of myoelectric
signals used in this experiment, five volunteers were
submitted to tests in a previous research that
evaluated the contribution of the muscles biceps and
triceps during voluntary flexion and extension elbow
movements (Bittar and Castro, 2008).
Figure 1 illustrates the device used in the
experiment, developed to minimize the interferences
in the movement performed by the volunteer and
guarantee the angular position of the arm, making
easier the control over the acquired data.
Figure1: Horizontal myographic signals acquisition.
Each volunteer was submitted to 3 types of tests
repeated 3 times in the vertical and horizontal plans.
In this work, we only consider the tests in the
horizontal plan, according to the following
description:
- Test 1 (BT1): The first test consists of moving
the arm in a 10° shift on every 3 seconds going to
90° and returning to the extension position by the
same way. This test generated a subset of data, here
called BT1, which have been labeled as 3 different
groups of signals: 0° to 10°, 40° to 50° and 80° to
90°;
- Test 2 (BT2): In the second test, the volunteer
repeated the movement from 0° to 90°, but this time
without pauses, in a continuous way and in the space
of ten seconds. This test generated the BT2 subset of
data, which have been labeled accordingly to the
following 3 groups of signals: 0° to 10°, 40° to 50°
and 80° to 90°;
- Test 3 (BT3): In the third test, the movement
should be done moving the arm from the initial point
in a 10° shift and returning to the origin and
repeating again from the origin to 20° and back, so
forth until achieving 90°. This test generated the
BT3 subset data, which have been labeled
accordingly to the following 3 groups of signals: 0°
to 10°, 0° to 50° and 0 to 90°.
The myoelectric signals were tabulated to
simplify the data set manipulation. A data set BTG
(BT1+BT2+BT3) was created considering the
simultaneous analysis of biceps and triceps signals
to characterize the arm angular position. Figure 2
shows a representation of the BTG group, obtained
from the combined signals of triceps and biceps
muscles in movements from 0° to 10°, 40° to 50°
and 80° to 90° (BT1+BT2) and 0° to 10°, 0° to 50°
and 0° to 90° (BT3), through a dispersion graph. It
can be seen that due to the high dimensionality of
the data and noise presence on the acquired signals,
the characterization of the patterns of interest is a
challenging multivariate data analysis task.
Figure 2: BTG biceps (left) and triceps (right) signals.
2.2 Methods
In statistical pattern recognition, a myographic
signal with n variables or parameters can be treated
as a point in an n-dimensional space called the
original space. The coordinates of this point
represent the values of each variable of the signal
and form a high dimensional vector
[
]
n
T
xxxx ,,,
21
…=
, where n>>1. Since n-
dimensional myographic signals are highly
redundant, we can project such multivariate data
onto a lower dimensional space without significant
loss of information. In this section, we describe the
multivariate statistical techniques used in this work
to analyze and characterize the acquired set of
signals through low dimensional linear
transformations.
BIOSIGNALS 2009 - International Conference on Bio-inspired Systems and Signal Processing
228
2.2.1 Principal Components Analysis (PCA)
PCA is a feature extraction procedure concerned
with explaining the covariance structure of a set of
variables through a small number of linear combina-
tions of these variables. It is a well-known statistical
technique that has been used in several pattern
recognition problems, especially for dimensionality
reduction. A comprehensive description of this
multivariate statistical analysis method can be found
in (Fukunaga, 1990).
Let an
N x n training set matrix
X
be
composed of
N input signals with n variables.
This means that each column of matrix
X
represents the values of a particular variable
observed all over the
N signals. Let this data matrix
X
have covariance matrix S with respectively
Φ
and
Λ
eigenvector and eigenvalue matrices, that is,
Λ=SPP
T
. (1)
It is a proven result that the set of m (
nm
≤
)
eigenvectors of
S , which corresponds to the m
largest eigenvalues, minimizes the mean square
reconstruction error over all choices of
m
orthonormal basis vectors (Fukunaga, 1990). Such a
set of eigenvectors that defines a new uncorrelated
coordinate system for the training set matrix
X
is
known as the principal components.
Therefore, although n variables are required to
reproduce the total variability (or information) of the
sample
X
, much of this variability can be
accounted for by a smaller number m of principal
components. That is, the m principal components
can then replace the initial n variables and the
original data set, consisting of
N measurements on
n
variables, is reduced to a data set consisting of N
measurements on
m
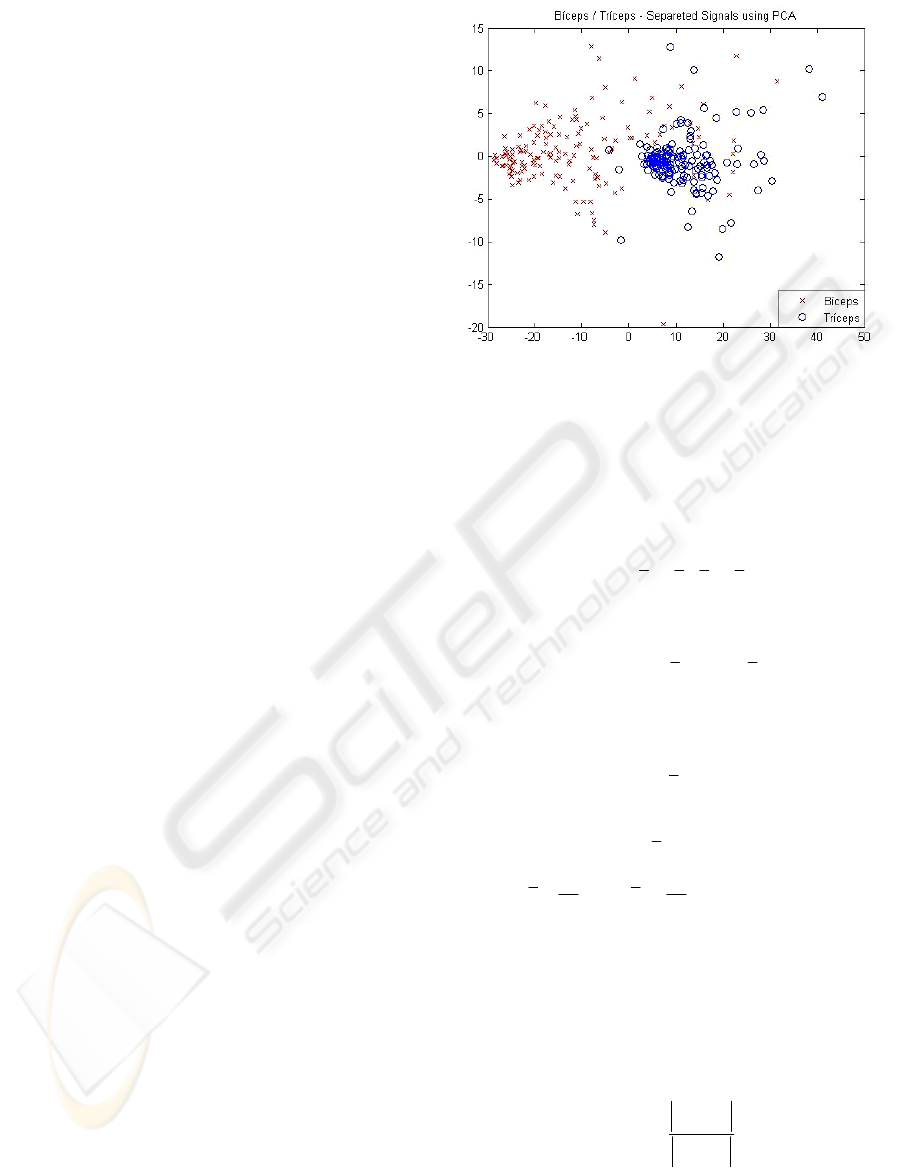
principal components. Figure 3
shows the representation of the BTG data set
focusing on the analysis of the biceps and triceps
signals on the first two principal components (m=2).
However, since PCA explains the covariance
structure of all the data its most expressive
components, that is, the first principal components
with the largest eigenvalues, do not necessarily
represent important discriminant directions to
separate groups of patterns.
2.2.2 Maximum Uncertainty LDA (MLDA)
A common practice to identify the important linear
directions for separating groups of patterns is to use
Fisher's Linear Discriminant Analysis (LDA) rather
than PCA. The primary purpose of LDA is to sepa-
Figure 3: BTG biceps and triceps signals on the first two
principal components.
rate samples of distinct groups by maximizing their
between-class separability while minimizing their
within-class variability.
Let the between-class scatter matrix
b
S be
defined as
∑
=
−−=
g
i
T
iiib
xxxxNS
1
))(( (2)
and the within-class scatter matrix
w
S be defined as
∑∑
==
−−=
g
i
T
iji
N
j
ijiw
xxxxS
i
1
,
1
,
)()( , (3)
where
ji
x
,
is the m-dimensional pattern j from
class
i
π
,
i
N is the number of training patterns from
class
i
π
, and
g
is the total number of classes or
groups. The vector
i
x and matrix
i
S are
respectively the unbiased sample mean and sample
covariance matrix of class
i
π
(Fukunaga, 1990).
The grand mean vector
x is given by
∑∑∑
===
==
g
i
N
j
ji
g
i
ii
i
x
N
xN
N
x
11
,
1
11
, (4)
where
N is the total number of samples, that is,
g
NNNN
+
+
+
=
21
.
The main objective of LDA is to find a
projection matrix
lda
P
that maximizes the ratio of the
determinant of the between-class scatter matrix to
the determinant of the within-class scatter matrix
(Fisher’s criterion), that is,
PSP
PSP
P
w
T
b
T
P
lda
maxarg=
.
(5)
However, the performance of the standard LDA
can be seriously degraded if there is only a limited
number of total training observations
N compared
to the dimension of the feature space m . Since the
A MULTIVARIATE STATISTICAL ANALYSIS OF MUSCULAR BIOPOTENTIAL FOR HUMAN ARM
MOVEMENT CHARACTERIZATION
229
within-class scatter matrix
w
S
is a function of
)( gN − or less linearly independent vectors, its
rank is
)( gN − or less. Therefore,
w
S is a singular
matrix if
N is less than )( gm + , or, analogously,
might be unstable if
N is not at least five to ten
times
)( gm + (Jain and Chandrasekaran, 1982).
To avoid the aforementioned critical issues of
the standard LDA in the limited sample and high
dimensional problem investigated here, we have
calculated
lda
P
by using a maximum uncertainty
LDA-based approach (MLDA) that considers the
issue of stabilising the
w
S
estimate with a multiple
of the identity matrix (Thomaz et al., 2004; Thomaz
and Gillies, 2005).
The maximum uncertainty LDA is constructed
by replacing
w
S with its regularization version in
the Fisher’s criterion formula described in equation
(5). A comprehensive description of this multivariate
statistical analysis method can be found in (Thomaz
and Gillies, 2005).
3 RESULTS
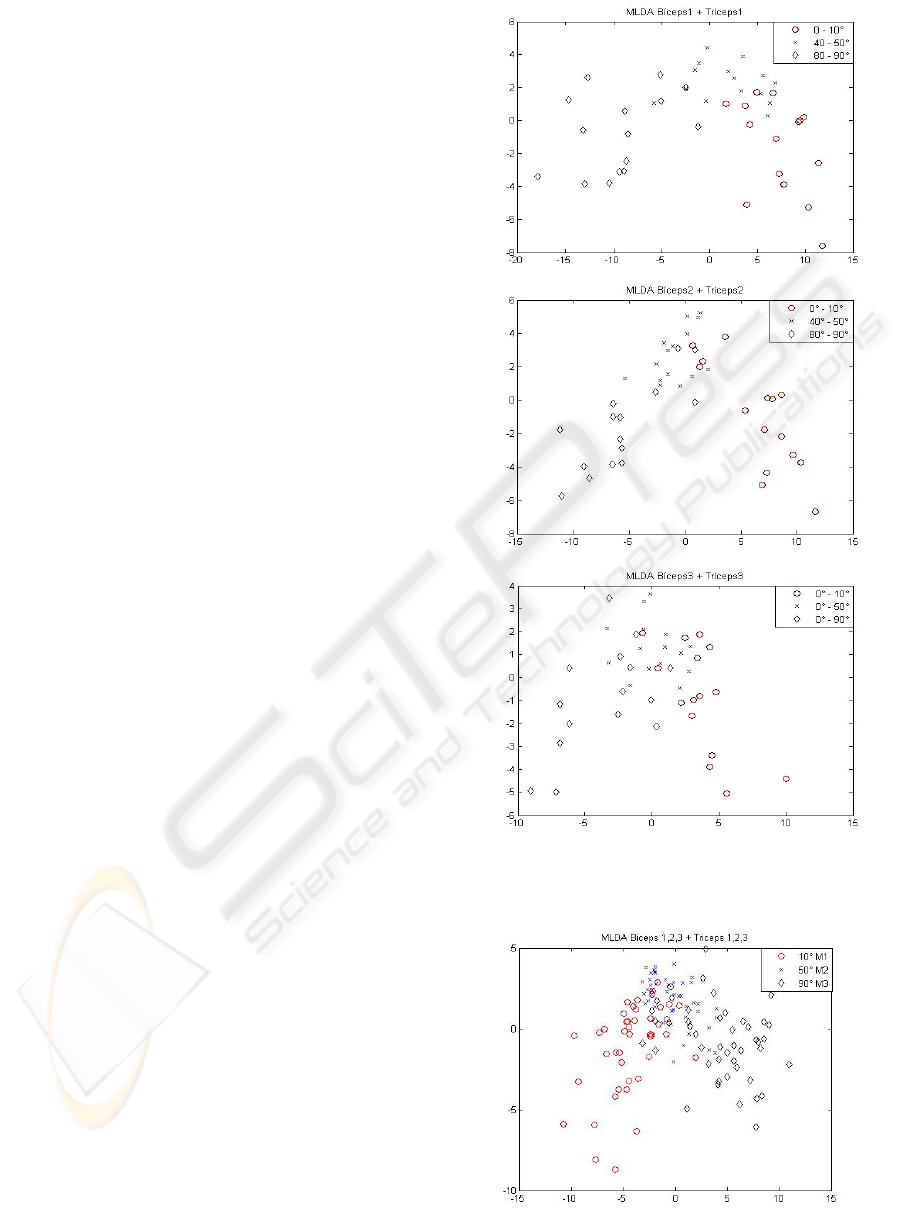
Figure 4 shows the PCA+MLDA transformation of
biceps and triceps signals treated together in tests 1,
2 and 3.
The two-stage PCA+MLDA multivariate linear
transformation reduces the dimensionality of the
original data and extracts the most discriminant
information from the patterns of interest. We have
retained all the PCA eigenvectors with non-zero
eigenvalues, that is,
1−
=
Nm , to reproduce the
total variability of the samples with no loss of
information.
BTG group was then analyzed, intending to
investigate the possibility of characterizing the
groups of movements based only on the executed
angular position instead of the muscle and the
related movement. Thus, by naming the classes with
the corresponding angular position and group labels
and considering three main groups as follows:
(M1) all the movements aiming 10º,
(M2) all the movements aiming 50º,
(M3) all the movements aiming 90º,
Figure 5 shows that even when analyzing the
different data set groups BT1, BT2 and BT3 on the
same 2D scatter plot it is still possible to see the 3
classes of data, which represent the final joint
position of the arm.
Figure 4: BT1 (top), BT2 (middle) and BT3 (bottom)
signals on the two PCA+MLDA most discriminant
components.
Figure 5: BTG biceps and triceps signals on the first two
PCA+MLDA most discriminant components.
BIOSIGNALS 2009 - International Conference on Bio-inspired Systems and Signal Processing
230
To quantify the PCA+MLDA linear separation
between the groups visually inspected in Figure 4,
we have used the Bhattacharyya distance (Fukunaga,
1990). The Bhattacharyya distance between two
groups of patterns can be defined as
(6)
where the notation “|.|” denotes the determinant of a
matrix. As described previously, the vector
i
x and
matrix
i
S are respectively the unbiased sample
mean and covariance matrix of class
i
π
(i = 1,2,3).
BT1 - Bhattacharyya Distance
0
0.5
1
1.5
2
2.5
3
M1 - M2 M2 - M3 M1 - M3
BT1 - MLDA d
BT1 - MLDA md
BT1 - MLDA cd
B T 2 - Bhatt acharyya D istance
0
0, 5
1
1, 5
2
2, 5
M1 - M2 M2 - M3 M1 - M3
BT2 - MLDA d
BT2 - MLDA md
BT2 - MLDA cd
B T 3 - Bhatt acharyya D istance
0
0, 2
0, 4
0, 6
0, 8
1
1, 2
M1 - M2 M2 - M3 M1 - M3
BT3 - MLD A d
BT3 - MLD A md
BT3 - MLD A cd
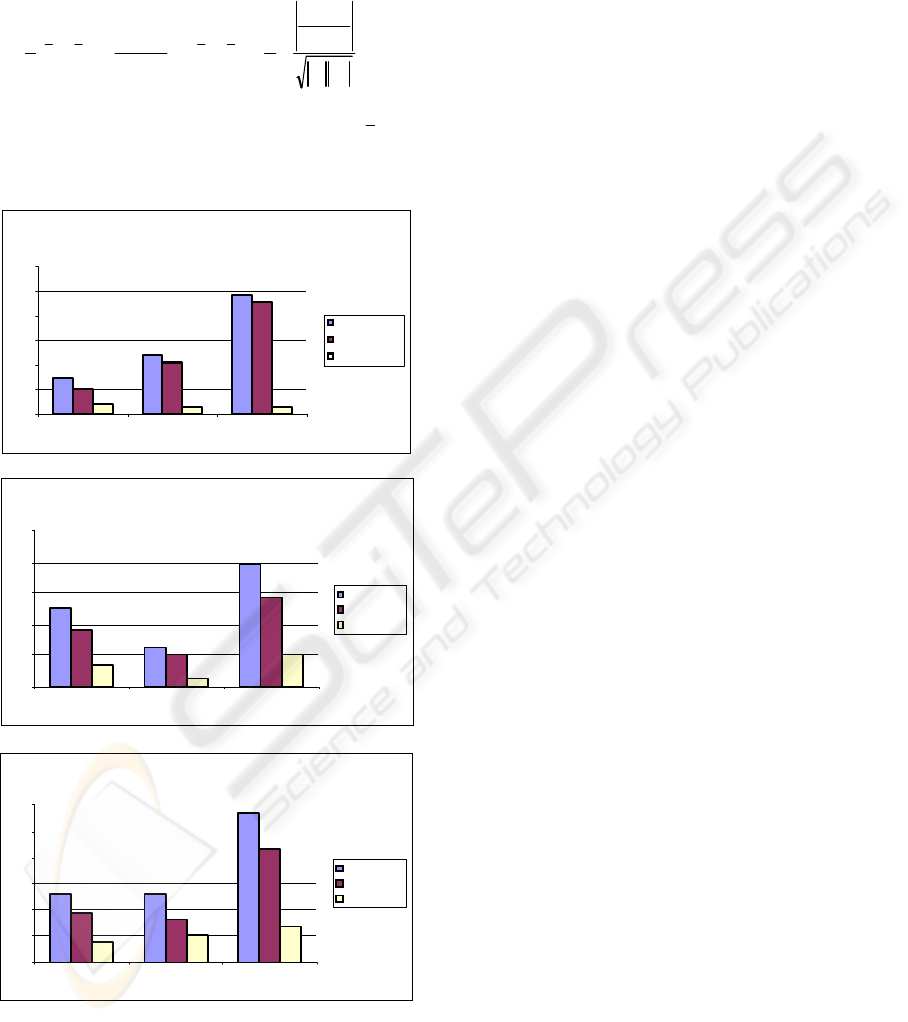
Figure 6: Quantification of the BTG biceps and triceps
signals separation on the PCA+MLDA linear
transformation using the Bhattacharyya distance.
Figure 6 illustrates the Bhattacharyya distance
calculated pairwisely between classes M1, M2 and
M3. For each group BT1 (top), BT2 (middle) and
BT3 (bottom), there is a measure of the total
Bhattacharyya distance (d), the Bhattacharyya
distance considering only its component related to
the mean differences (md), and the one related to
covariance differences (cd) only.
4 DISCUSSION
Initially, the acquired data was plotted in a
dispersion graph, as previously illustrated in Figure
2. As it can be seen, it was not possible to extract
any useful discriminant information from these
graphs because there was a lot of redundancy on it,
due to noise and the nature of the data itself. This
picture becomes more confused as the number of
samples increases.
To simplify and make possible this analysis, it was
used a two-stage linear transformation to reduce the
data set dimensionality and extract discriminant
information between the patterns of interest. First,
PCA was used making much easier the
understanding of the data group representation by
using a bi-dimensional space to represent the groups
of data on the first two principal components.
Afterwards, MLDA was used to improve the results
through the data discriminant analysis. Then, we
analyzed the biceps and triceps muscles to
investigate whether the signals could be roughly
separated. The signals provided by both muscles
could be linearly separated, as shown in Figure 3,
motivating the use of a combination of these signals
to discriminate the sets to determine the angular
joint arm position.
Figure 4 shows a clear separation of the studied
groups 0º-10º, 40º-50º and 80º-90º, which had been
very difficult to detect before using such two-stage
linear transformation. As it can be seen, there is a
little spot concentration in some points of the BT3
multivariate data analysis. This happens because, in
this case, the movement performed by the volunteers
started always at the same point, that is, 0º-10º, 0º-
50º and 0º-90º, and such experiment can make
harder to differentiate one movement from the other.
By applying all groups BT1, BT2 and BT3 in a new
bigger group BTG, whose aiming was to condense
the data and verify their class-separability, it was
still possible to determine the concentration regions
of the studied classes. However, there has been still
a slight overlap on these regions, as it was observed
on the separated groups BT1, BT2 and BT3.
21
21
21
1
21
21
2
ln
2
1
)(
2
)(
8
1
SS
SS
xx
SS
xxd
T
+
+−
⎟
⎠
⎞
⎜
⎝
⎛
+
−=
−
A MULTIVARIATE STATISTICAL ANALYSIS OF MUSCULAR BIOPOTENTIAL FOR HUMAN ARM
MOVEMENT CHARACTERIZATION
231

The Bhattacharyya distance was then calculated
to quantify the data group separation visually
inspected. The results on Figure 6 show that the
separation between groups M1 and M3 are bigger,
while the overlap is more evident between groups
M1- M2 and M2-M3. Therefore, as the movements
involved are more distant or different from each
other, more the set of signals become separated in its
own group or intra-class. This result was expected
but the experiment, especially with BTG group, has
showed the possibility of discriminating different
sets of data from different tests and obtaining a
reasonably understandable set of data, where classes
and groups could be linearly separated.
5 CONCLUSIONS
Our experimental results have suggested that
analyzing a given myoelectrical set of signals by
descriptive statistical tools is a hard task due to a
high data dimensionality and noise presence.
Acquiring myoelectrical signals with superficial
electrodes means to deal with a highly noisy
susceptible set of data due to electrical variances of
the skin and electrodes displacements during muscle
movements. The use of linear transformation can
make the multivariate data set analysis easier.
Considering the arm horizontal movement and
the acquired set of data used in this research, a
discriminant linear analysis showed that it is
possible not only to characterize the angular joint
position, but also to infer that different movements
recruit similar amounts of energy to be executed.
Our experimental results confirm that using
multivariate statistical analysis, myoelectric signal
recognition can be significantly improved after
linear transformations, which are practical and
feasible methods to analyze such multivariate high
dimension and small sample size data for further
classification.
ACKNOWLEDGEMENTS
The authors would like to thank the support
provided by the State of São Paulo Research
Foundation (FAPESP) under the grant 05/02899-4.
REFERENCES
Bittar, L. M. and Castro, M. C. F., 2008. Elbow Flexion
and Extension Movements Characterization by Means
of EMG. Biodevices 2008, Portugal, pp. 147-150.
Fukunaga, K., 1990. Introduction to statistical pattern
recognition, 2
nd
edition. Academic Press, Boston.
Hargrove, L., Englehart, K. and Hudgins, B., 2008. A
training strategy to reduce classification degradation
due to electrode displacements in pattern recognition
based myoeletric control. Biomedical Signal
Processing and Control, 3(2), pp.175-180.
Henneberg, K., 2000. Principles of Electromyography. In:
Bronzino, J. D. (Eds.), The biomedical Engineering
Handbook, Vol. 1, 2
nd
edition. CRC Press, New York.
cap. 14.
Jain, A. K. and Chandrasekaran, B., 1982, Dimensionality
and Sample Size Considerations in Pattern
Recognition Practice. In: Krishnaiah, P. R. and Kanal,
L. N. (Eds.), Handbook of Statistics, Vol. 2. North-
holland, Amsterdam. pp. 835-855.
Kleissen, R. F. M., Buurke, J. H., Harlaar, J., Zivold, G. ,
1998. Electromyography in the biomechanical analysis
of human movement and its clinical application. Gait
and Posture, 8(2), pp.143-158.
Thomaz, C. E. and Gillies, D. F., 2005. A Maximum
Uncertainty LDA-based approach for Limited Sample
Size problems - with application to Face Recognition.
In: Proceedings of SIBGRAPI’05, IEEE CS Press, pp.
89-96.
Thomaz, C. E., Gillies, D. F. and Feitosa, R. Q., 2004. A
New Covariance Estimate for Bayesian Classifiers in
Biometric Recognition, IEEE Trans. Circuits Syst.
Video Techn., 14(2), pp. 214-223.
BIOSIGNALS 2009 - International Conference on Bio-inspired Systems and Signal Processing
232
