
2.4GHZ WIRELESS ELECTROMYOGRAPH SYSTEM
WITH STATISTICALLY OPTIMAL AUTOMATIC GAIN CONTROL
Design and Performance Analysis
Andrea Morici, Giorgio Biagetti and Claudio Turchetti
DIBET — Dipartimento di Ingegneria Biomedica, Elettronica e Telecomunicazioni
Universit`a Politecnica delle Marche, I-60131 Ancona, Italy
Keywords:
Wireless sensors, Surface EMG, IEEE 802.15.4, LR-WPAN, AGC, Laplacian distribution.
Abstract:
In this paper a wireless system for non-invasive surface electromyography (SEMG) is presented. The use of a
wireless technology, that substitutes cabled electrodes with a wireless link, allows the number of sensors on the
body to be increased without affecting the patient’s freedom of movement. Problems in this setup, that extend
from energy consumption minimization, to satisfaction of wireless link operational bandwidth and distance
requirements, and from the necessity of embedding hardware in an appreciably small device, to making it not
too expensive to final customers, have been deeply analyzed and solved. In this context, low rate wireless
personal area networks (LR-WPANs) proved to be a good choice for the realization of low-cost embedded
wireless electrodes for electromyography. Following these considerations, a low-cost electromyographical
wireless device, based on an off-the-shelf IEEE 802.15.4-compatible RF transceiver, have been designed and
realized, and optimized signal processing algorithms developed to enhance the system accuracy. In particular,
due to the wide range of possible amplitudes for the SEMG signal, an optimal automatic gain control, based on
a detailed statistical signal analysis, have been developed to reduce the distorsion at the output of the quantizer.
1 INTRODUCTION
Electromyography (EMG) is a useful diagnosis tech-
nique in the field of neurophysiology, used for evalu-
ating and recording physiologic properties of muscles
both at rest and while contracting. EMG can either
use needle electrodes (intramuscular EMG) or sur-
face electrodes (surface EMG) (Berzuini et al., 1985).
Naturally, only the latter is a non-invasive technique,
and is the one with which we deal in this paper.
The prediction of muscle force from EMG (Stau-
denmann et al., 2006) may aid with the diagnosis of
some medical conditions in which the electrical ac-
tivity of the muscles or nerves is not normal, such as
nerve compression or injury, nerve root injury, and
with other possibly muscle-related problems such as
deambulation difficulties. This technique is not only
useful in hospital environments, but also in rehabili-
tation and motion analysis laboratories, as well as in
fitness centers, as it provides an assessment of the
electrical activity generated by contracting muscles
during movements (Jansen et al., 2003). Today the
non-invasive Surface Electromyography (SEMG) has
become very popular owing to the great variety of
applications it can be used in. Recently, to mention
just few examples, EMG has proven to be useful as a
sensor for measuring everyday playing behaviour of
children (Kawakami et al., 2007), as an interface for
inputting characters to a computer (Miyazawa et al.,
2006) and for studies of gait dynamics in free-running
insects (Lemmerhirt et al., 2006).
A typical SEMG analysis may exercise multi-
ple sensors positioned on the patient’s body, each of
which may require one or more data channels. A
wireless recorder system is thus demanded so that the
patient’s freedom of mobility does not decrease with
the number of sensors applied. Some issues that an
SEMG recorder system must face are related to its
input sensivity, as it is well established that the am-
plitude of the EMG signal ranges from 0 to 10mV
(peak-to-peak) or 0 to 1.5mV (rms) and that is con-
taminated by several sources of noise, thus a high-
gain differential amplifier with a CMRR of at least
80dB is required. Other problems are related to the
number of channels to be acquired: successful anal-
ysis of motion activity involving a group of muscles
39
Morici A., Biagetti G. and Turchetti C. (2009).
2.4GHZ WIRELESS ELECTROMYOGRAPH SYSTEM WITH STATISTICALLY OPTIMAL AUTOMATIC GAIN CONTROL - Design and Performance
Analysis.
In Proceedings of the International Conference on Biomedical Electronics and Devices, pages 39-45
DOI: 10.5220/0001511300390045
Copyright
c
SciTePress

needs a multiple channel recording, able to evaluate
more than one EMG channel simultaneously. In this
paper a multi-channel SEMG recorder system, con-
sisting of a wireless wearable sensor interfaced to a
standard PC for back-end data analysis, has been de-
veloped to satisfy the requirements of portability, high
sensivity and low-cost.
The research objectives of this article is to pro-
pose a new design of an embedded system made with
off-the-shelf components and suitable for the above
purposes. A statistical analysis of the EMG signal
is provided and exploited to optimize the algorithms,
used to enhance the performance of the low-cost com-
ponents employed in the system, to levels adequate
for the application. This is done by means of statisti-
cally optimized gain adjustment system that is able to
achieve a better SNR respect to fixed-gain implemen-
tations.
2 ELECTROMYOGRAPHIC
SIGNALS
A brief introduction on the EMG signals is neces-
sary before presenting the hardware structure of the
system. The source of EMG signal is the electrical
potential generated by muscle cells when they con-
tract. Using a surface electrode, only the general pic-
ture of muscle activation is monitored, whereas the
activity of just a few fibers can be observed using nee-
dle electrodes. The amplitude of the resulting sig-
nal can range from less than 50 uV to about 5 mV.
As the usable energy of the signal is limited to the
0 to 500 Hz frequency range, with the dominant en-
ergy being in the 50 to 150Hz range, the sampling
frequencies needed for its acquisition are in the or-
der of kilohertzs, generally from 1 kHz upwards. In
order to get EMG voltage signals, a differential pair
of Ag/AgCl electrodes is commonly used. These will
pick up the voltage difference and through two very
short shielded conductors it will be fed to an instru-
mentation amplifier on the acquisition device, that ad-
justs the amplitude of the EMG signal to an appropri-
ate range for the analog to digital converter (ADC) as
will be shown next.
An example of a typical EMG signal is shown in
Figure 1, which reports its time progress as acquired
by our system at a sample rate of 2kHz.
The periods where the signal amplitude is low and
flat correspond to the muscle being at rest, and the
recorded signal is dominated by electrical noise from
both the environment and the acquisition system. The
parts in which the amplitude is increased above such
noise floor correspond to muscle contractions. The
0 5 10 15
−4.5
−3
−1.5
0
1.5
3
4.5
time [s]
amplitude [mV]
Figure 1: EMG signal recorded on a biceps muscle with the
presented system.
subject of the acquisition is a biceps humerus muscle
of a young adult male who was asked to perform re-
peated liftings of his arm following a randomised se-
quence. Some contractions have been kept for several
seconds. The exercise was executed in a non stressed
condition.
2.1 Statistical Analysis for Optimal
Automatic Gain Control
A detailed knowledge of the statistical EMG signal
amplitude is necessary to devise optimum strategies
to properly amplify the EMG signals before feeding
them to the quantizer used for the analog to digital
conversion, since for proper evaluation of muscle ac-
tivity it is of utmost importance that the possibility of
saturation is kept to a minimum, while not degrading
the signal too much due to quantization.
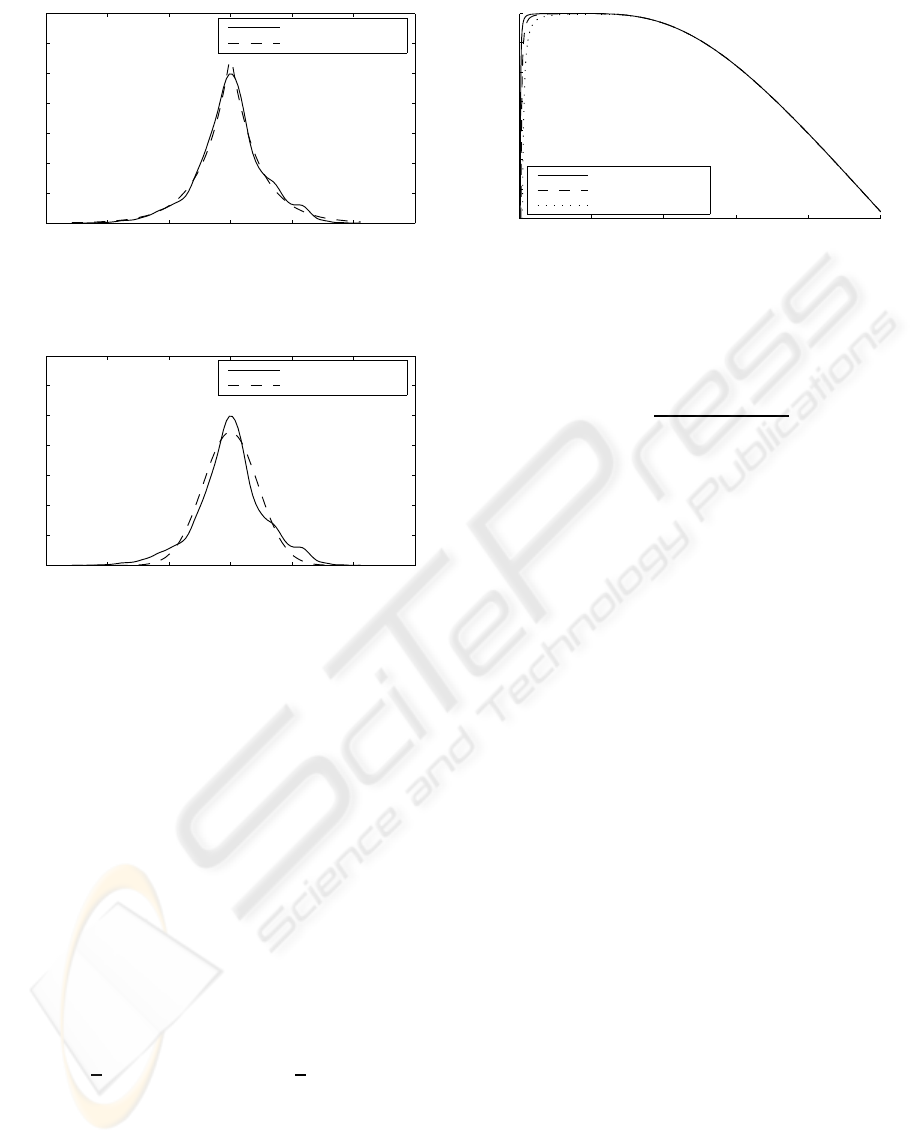
To analyze the statistical properties of an EMG
signal it is necessary to separate the two main parts
previoulsy mentioned: rest condition and activation.
The former is primarily dominated by the noise gener-
ated by the electrical devices in the acquisition board,
and by their susceptibility to irradiated emissions. In-
deed, it can easily be verified that it is white noise
with a Gaussian probability density function (PDF).
The latter part consists in the recording of the over-
all effect of the activation potentials during the mus-
cle contraction. Figure 2 shows an estimate of the
PDF of the recorded signal cleared of the noise-only
portions. Confirming already known findings (Clancy
and Hogan, 1999), the EMG signal, let us call it x(t),
displays a Laplacian PDF, defined as
f
x
(x) =
1
2b
exp
−
|x− µ|
b
(1)
where µ is the mean value, supposedly zero, and b is
the mean absolute value (MAV), that is, b = E{|x|},
and is usually one of the most important features to
be extracted from the EMG signal.
For reference, Figure 3 reports the same
experimentally-obtained distribution plotted against
BIODEVICES 2009 - International Conference on Biomedical Electronics and Devices
40
−3 −2 −1 0 1 2 3
0
0.2
0.4
0.6
0.8
1
1.2
amplitude [mV]
probability density [1/mV]
pdf estimate from data
interpolated Laplacian
Figure 2: Probability density function of the EMG signal of
Fig. 1 compared to its best fitting Laplacian distribution.
−3 −2 −1 0 1 2 3
0
0.2
0.4
0.6
0.8
1
1.2
amplitude [mV]
probability density [1/mV]
pdf estimate from data
interpolated Gaussian
Figure 3: Probability density function of the EMG signal of
Fig. 1 compared to its best fitting Gaussian distribution.
the best-fitting Gaussian distribution. There is a clear
mismatch between the two, confirming that the Lapla-
cian better describes the EMG signal statistics.
From a statistical point of view, as the non-
linearity affects the signal amplitude, an optimal au-
tomatic gain control (AGC) must be able to minimize
the distorsion at the output of the quantizer.
Let us then suppose that the quantizer has a satura-
tion level L, and that in between it performs the ideal
staircase quantization described by
y =
⌊x+ 1/2⌋ |x| < L
L sign(x) |x| ≥ L
(2)
then, the expected MAV at the quantizer’s output is
E{|y|} =
1
b
Z
L+1/2
0
⌊x+ 1/2⌋e
−x/b
dx+
1
b
Z
+∞
L+1/2
Le
−x/b
dx
(3)
where the second term at the right hand side is the
contribution due to saturation effects. The first inter-
gral can easily be evaluated as follows
Z
L+1/2
0
⌊x+ 1/2⌋ e
−x/b
dx =
L
∑
n=1
Z
n+1/2
n−1/2
ne
−x/b
dx (4)
0 0.1 0.2 0.3 0.4 0.5
−14
−12
−10
−8
−6
−4
−2
0
relative input MAV
MAV estimate relative error [%]
1024−levels quantizer
512−levels quantizer
256−levels quantizer
Figure 4: Error of MAV estimate after quantization and sat-
uration as a function of input MAV (relative to full scale)
for different quantizer resolutions.
which, after a few simple manipulations, yields
E{|y|} =
1− e
−L/b
e
1/(2b)
− e
−1/(2b)
(5)
Ideally, we would like to operate the quantizer
with an input signal whose amplitude b is such that its
post-quantization estimate E{|y|} is as close as pos-
sible to b. A measure of the error introduced by the
quantizer is the relative MAV error (E{|y|} − b)/b,
shown in Figure 4 for different quantizer resolutions
as a function of the relative input signal amplitude
b/L. As can be seen from the graphs, if the input
level is kept close to about 0.1L with a proper AGC
mechanism, which will be described in a following
section, even low resolution quantizers can give ex-
tremely good results.
3 WIRELESS SENSOR NODE
The wireless node we propose comprise all the elec-
tronics needed to measure the biological parameters
of interest, processing them both prior and after their
conversion to the digital domain, and to transfer them
through a wireless link to a nearby observation sta-
tion. All wireless board components were chosen
keeping in mind energy saving, low-cost, high inte-
gration and good electrical property, for the analog
parts, consistently to EMG signal requirements.
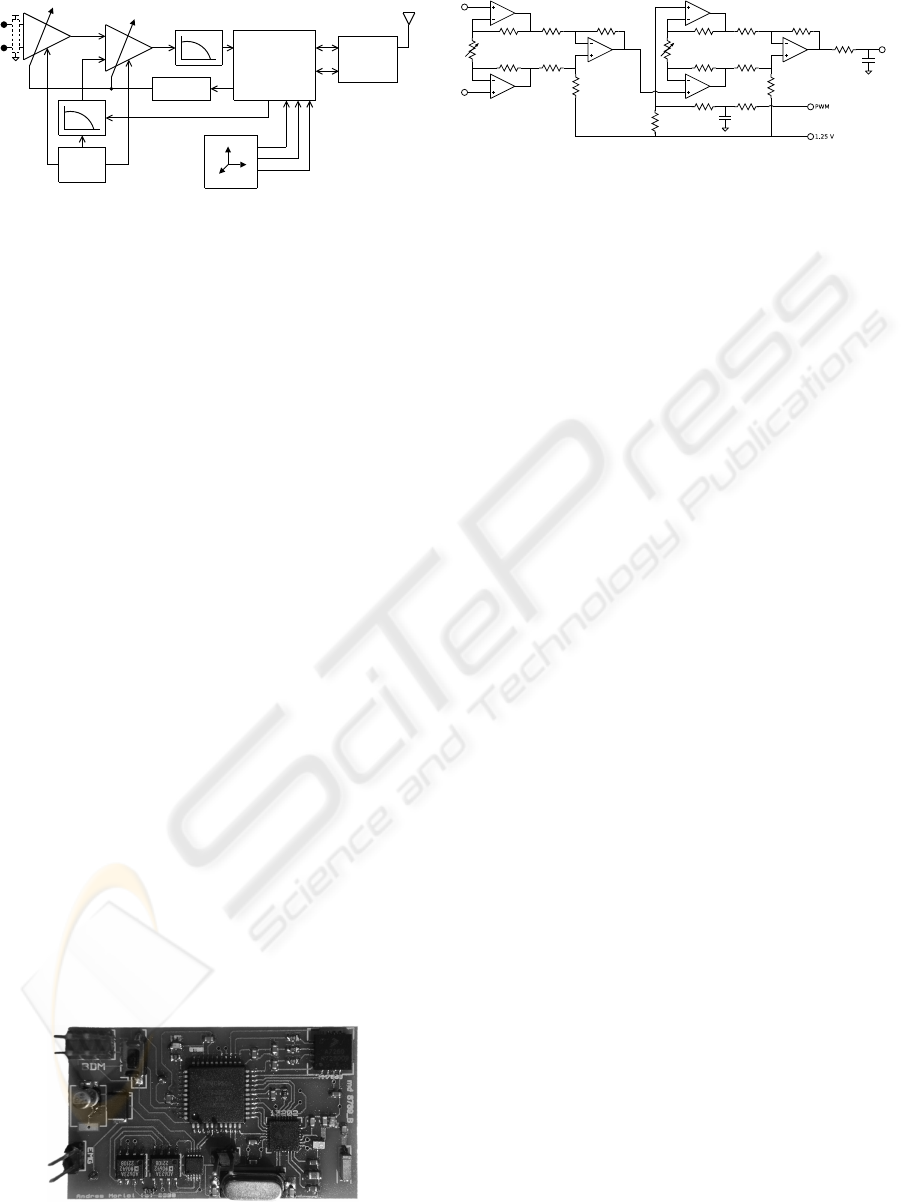
Figure 5 shows the block diagram of our wireless
node, while Figure 6 shows a photo of a prototype of
the wireless embedded board for electromyography.
The sensor, that was designed to be of peel-and-
stick type, detects at the skin surface a differential
voltage signal that is amplified by a low-noise dif-
ferential amplifier and low-pass filtered in the band
of interest. This is a solution known as “active elec-
trode,” for the differential amplifier is placed as close
as possible to the detection surface of the electrodes,
2.4GHZ WIRELESS ELECTROMYOGRAPH SYSTEM WITH STATISTICALLY OPTIMAL AUTOMATIC GAIN
CONTROL - Design and Performance Analysis
41
uC
VOLTAGE
REFERENCE
A1
A2
DIGITAL
POTENTIOMETER
LPF
LPF
G1
G2
IIC
ADC
PWM
ADC
GPIO
SPI
IEEE 802.15.4
PHY
ACCELEROMETER
BIASING
SEMG
Figure 5: Block scheme of the wireless electromyograph
node.
so as to improve the immunity to the noise induced by
external radiated interferences. The signal, so ampli-
fied, is fed through an RC anti-imaging low-pass filter
that limits the upper bound of the frequency spectrum
to be acquired. It’s cut-off frequency was chosen to
be approximately 530Hz.
The active sensor prototype used a two chip so-
lution for the microcontroller part and for the wire-
less physical (PHY) transceiver, to facilitate labo-
ratory testing and debugging, but in future realiza-
tions it will more convenient to switch to Platform-in-
Package (PiP) solutions, where the above mentioned
two chips are integrated into one package, in order to
save cost, space, and PCB design difficulties.
The board also comprise the off-chip RF part, in-
cluding PCB traces designed for impedance match-
ing and discrete components chosen to achieve good
impedance matching between the PHY transceiver
and the chip antenna. This kind of antenna was cho-
sen because of its small size and characteristics opti-
mized for our operating wireless band.
The node also includes a three-axis accelerometer
that can provide useful data for motion analysis when
combined to EMG measurements. Moreover, it pro-
vides three additional data channels to demonstrate
the bandwidth capacity in streaming four simultane-
ous real-time channels from the sensor node.
Acceleration data can also be an efficient way to
give commands to the board, for instance to enable
low power operation modes by putting the electronic
devices of the board in standby during inactivity peri-
ods.
Figure 6: The wireless electromyograph embedded board.
Actual size is 50 mm × 30 mm.
Figure 7: Details of the instrumentation amplifier configu-
ration used.
3.1 Signal Acquisition and Conditioning
The analog signal chain for the EMG signal requires
special attention. Because of the wide range in which
EMG signals can vary, a cascade of two variable
gain intrumentation amplifiers was used. A detailed
schematic diagram of their connection is shown in
Figure 7.
These amplifiers are also capable of convertingthe
differential EMG signal to single ended, with a high
CMRR, and although the circuit was optimized for
operation with a gain close to 1000 (60 dB), by vary-
ing both gains it is possible to change the overall gain
by ±40dB to accomodate very different and possibly
extreme application conditions.
Indeed, the algorithm in the sensor can choose
gains appropriate to different condition of use: for ex-
ample, if you are walking, sensor board will have to
set sensivity parameters to adequate values to sense
low level excitation potentials. On the contrary,
during sport trainings muscles are probably more
stressed, and so the sensor node can adjust gain pa-
rameters to achive best measuring performance.
A dual digital potentiometer serves to make the
gain variable, changing between a set of 256 different
values of resistance for each stage. This level of pre-
cision is very useful when the node is moved between
different muscle masses that need different gain lev-
els, and allows for the fine-grained AGC that ensures
optimal quantization.
The analog signal so amplified is subsequently
converted to a digital signal by the ADC included
in the microcontroller, operating at a 2 kHz sampling
rate and with a maximum resolution of 10bits.
To provide a voltage bias to the output of the am-
plifiers, an integrated low-cost, band-gap reference
was used. The resistance seen between the output ter-
minal of the band-gap reference and ground is only
a fraction of an ohm, ensuring that the amplifier in-
trinsic insensibility to common-mode voltages is not
reduced because of it. With a high-CMRR input stage
and a small battery-powered sensor node mounted
close to the patient’s skin, so as to minimize stray ca-
pacitance to ground, the use of a reference electrode
BIODEVICES 2009 - International Conference on Biomedical Electronics and Devices
42

to set the patient’s body potential was deemed unnec-
essary. Proper biasing of the input stage is provided
directly to the main electrodes by means of a resistive
network connected to the internal reference potential.
Despite all these precautions, it is still possible
that the detected signal presents a DC component, or
an input bias, high enough to cause saturation of some
amplifier. To avert this possibility the circuit employs
an active bias control, fed between the two amplifying
stages by means of a PWM signal, that is able to can-
cel both amplifier bias and (small) DC components
that can arise when the patient moves other parts of
their body.
This active offset compensation technique was
deemed to be superior to simple AC coupling, for it
can use more complex filters. Moreover, since the
communication channel between the node and the
base station is bidirectional, these filters can be run
on the PC side and thus there are potentially no lim-
its to their complexity. For instance, we made use of
fourth-order elliptical digital filters running on the PC
side, with their group delay properly compensated in
the reported plots. Such a solution proved to be very
good at removing the spikes, usually due to patient’s
motion, commonly found in EMG traces, but would
have been much more costly to implement in hard-
ware.
3.2 AGC Algorithm
AGC poses a different problem than offset and bias
compensation, since the latter are usually slowly
time-varying phenomena for which the round-trip de-
lay, due to the communication with the base station
system, does not cause harmful degradation of the
control loop stability and performance. On the con-
trary, the EMG signal can have quite abrupt transis-
tions. As a consequence, a simple but yet effective
AGC algorithm was devised, so that it could be run
on the wireless node to offer the quickest possible re-
sponse time.
As previously stated, the purpose of the AGC is
to keep the input MAV level to the quantizer as close
as possible to 0.1L, where L is the ADC saturation
level. To this end, an estimation
e
b(t) of the MAV is
computed with a first-order recursive digital filter,
e
b(t) = (1− α)
e
b(t − 1) + α|z(t)/g(t)| (6)
with z(t) being the ADC output, g(t) the amplifier
gain, and α controls the filter bandwidth. Good re-
sults have been obtained with α ≃ 1/64, which corre-
sponds to a cut-off frequency of about 5Hz.
The optimum gain is then calculated as
eg(t + 1) =
0.1L
e
b(t)
(7)
from which the actual gain g(t + 1) to be used next
is chosen among the available gains, in steps of ap-
proximately 2 dB, with the help of a 22-entry look-up
table.
3.3 Wireless Data Transmission
LR-WPAN are emerging technologies for medium
distance low data rate communications. A protocol
to manage this kind of networks has been defined by
IEEE 802.15.4, which describes both a MAC layer
and a PHY layer. The operating frequencies of the
wireless link can be 868MHz, 915MHz or 2.4 GHz,
for an available data rate respectively of 20 kbps,
40 kbps and 250kbps. Our active sensor operates
at 2.45 GHz in the ISM band to achieve maximum
throughput. In this band there are 16 channels, each
5MHz wide. Typical distances covered by this tech-
nology ranges from 30m to 70 m in open spaces. It
can be easily extended by the use of an RF power am-
plifier joined to an LNA. Typically they are the same
as for other ISM wireless technologies such as Blue-
tooth and Wi-Fi. In customized applications IEEE
802.15.4 could imply difficulties in respecting timing
constraints posed by real-time streaming of data, such
as the one we need to perform in this context. We
hence decided to only use the capabilities of the PHY
layer of IEEE 802.15.4, customizing the MAC layer
to our purposes. A number of active SEMG sensors,
depending on how many data channels each uses, can
comunicate to the base station (BS) in a star topology
on the same RF channel, using a custom beaconed
time-division multiple access (TDMA) MAC scheme.
The BS is itself composed by an IEEE 802.15.4 com-
pliant transceiver and its task is to make data available
to the PC by the use of an USB link. For stream-
ing data from multiple sensors and for achieving full-
duplex operation it is necessary to assign time slots
to each sensor and to transmit/receive transactions.
Transmission and reception has to be scheduled by
devising an adequate timing of the active sensor con-
sidering the strict requirements of the ADC sampling
time. The adopted transceivers have particular tim-
ings regarding the transmission over the air of a data
packet. There is a warmup period t
warmup
= 144µs be-
fore the effective bitstream can be relayed, followed
by a t
cooldown
= 10 µs cooldown period. Timings are
then coherent with those reported in Figures 8 and 10:
t
pkt
(B) = t
warmup
+ t
header
+ B·t
byte
+ t
trailer
+ t
cooldown
(8)
t
tx
≈ t
pkt
(B)
B=B
tx
(9)
with t
byte
= 32 µs as per IEEE 802.15.4 specifications,
and where the payload length B
tx
is comprised of the
EMG data bytes B
EMG
and of the acceleration data
2.4GHZ WIRELESS ELECTROMYOGRAPH SYSTEM WITH STATISTICALLY OPTIMAL AUTOMATIC GAIN
CONTROL - Design and Performance Analysis
43
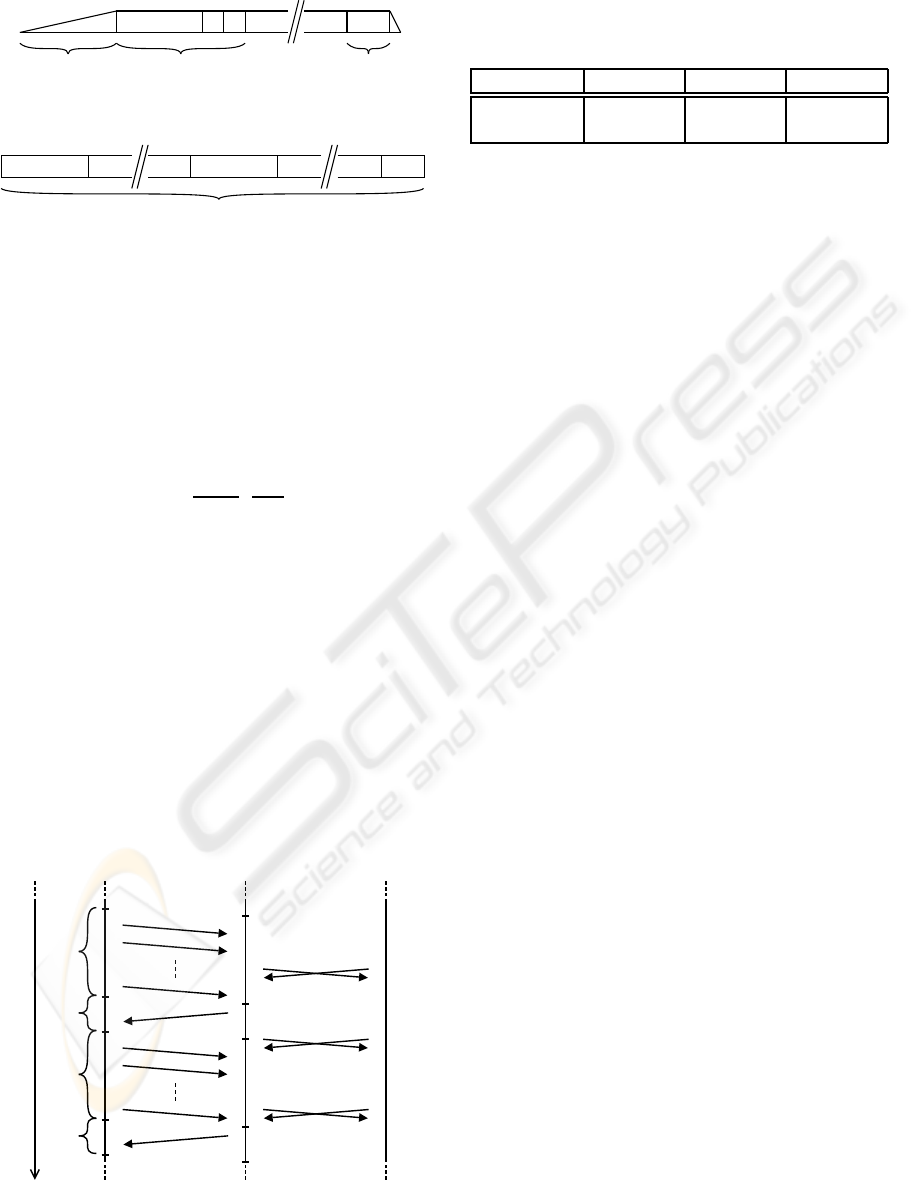
Preamble SFD FLI CRC
144 us 192 us 64 us
4 bytes
1
byte
2 bytes
Payload
1
byte
Figure 8: PHY packet transmission timings.
Header
3.968 ms
4 bytes 96 bytes 2 bytes
EMG
Z / BATT
18 bytes
ACCGains
4 bytes
Figure 9: Packet payload content.
bytes B
ACC
, apart from side channels (e.g. gain lev-
els) and node status information, as shown in Fig. 9.
Packet length must be chosen as a compromise be-
tween latency and channel bandwitdth utilisation, as
shown below.
Let us call t
adc
the time needed by the ADC to fill
B
i
bytes of the payload, for the EMG and each of the
three accelerometer channels:
t
adc
=
B
i
N
s
·n
i
·
1
F
s
(i)
(10)
where N
s
is the number of bytes per sample, n
i
the
number of channels per sensor type in each node,
sampled at a sample rate F
s
(i)
(usually n
EMG
=1 for the
single EMG channel sampled at F
s
(EMG)
= 2 kHz, and
n
ACC
=3 for the three accelerometer channels sam-
pled at a much lower sample rate F
s
(ACC)
=125 Hz).
Then we have the constraint
t
rx
> t
pkt
(B)
B=B
rx
, t
rx
= t
adc
− m·t
tx
(11)
where B
rx
is the number of bytes needed for the con-
trol channel, and m is the maximum number of wire-
less nodes simultaneously active.
Sensor
Boards
Base
Station
Timeline
Wireless
Link
TX
RX
TX
RX
RX
TX
RX
TX
Personal
Computer
~4.4 ms
x m
~1 ms
~4.4 ms
x m
~1 ms
Cabled
Link
#1
#2
#m
Figure 10: Communication flow scheduling of the various
system components.
Table 1: Relative mean square error of the post-quantizer
MAV estimate, for different quantizer resolutions, and for
either a fixed gain of 60dB and for AGC-determined gains.
gain policy 8 bit 9 bit 10 bit
fixed gain −36.3dB −47.5dB −55.1dB
AGC −57.1dB −63.8dB −67.1dB
The samples of the myo-electric and acceleromet-
ric signals are packed for a better efficiency of trans-
mission. Each packet has a header defined by means
of a protocol that has been developed for this specific
application, in order to perform the temporal synchro-
nization and the recovering of data flow in a sensor
network. With the payload structure shown in Fig. 9,
defined for ADC resolutions of up to 12 bits, and with
the previously mentioned sample rates, the theoret-
ical maximum number of nodes m operating on the
same RF channel is 6, with an extra time slot available
for retransmissions in case of errors. The actual limit
depends on the particular RF environment and back-
ground noise, which affects the need and frequency of
retransmissions, and is currently being investigated.
4 EXPERIMENTAL RESULTS
The prototype board was tested and used to acquire
a sample EMG signal, reported in Fig. 1. Although
proper shielding of the prototype was not employed
due to the presence of auxiliary debugging and de-
velopment connections, a quite good signal-to-noise
ratio was achieved. Power consumption resulted in
about 10mA, with many power-saving optimizations
that can still be implemented in the control software,
thus making it possible to achive a battery life of 5
to 10 hours of continuous operation out of a standard
coin-size rechargeable Li-ion cell.
In order to show the effectiveness of the proposed
AGC for EMG signal acquisition, some other experi-
ments were also made. Figure 11 shows some of the
results. It displays an EMG signal used as a refer-
ence, and the amplifier gains that were chosen by the
AGC algorithm for each portion of the signal. The re-
sult was then quantized, and the quantized signal used
to compute an estimate of the MAV. The MAV was
smoothed with a fourth-order elliptical filter and the
result shown in the same figure, and compared with
that obtained from the unquantized version.
The results of the comparisons are shown in Ta-
ble 1, which compares the errors made with different
gain policies and different quantizer resolutions. As
can easily be seen, the adoption of AGC permitted
us to obtain an increase in the accuracy of the MAV
BIODEVICES 2009 - International Conference on Biomedical Electronics and Devices
44
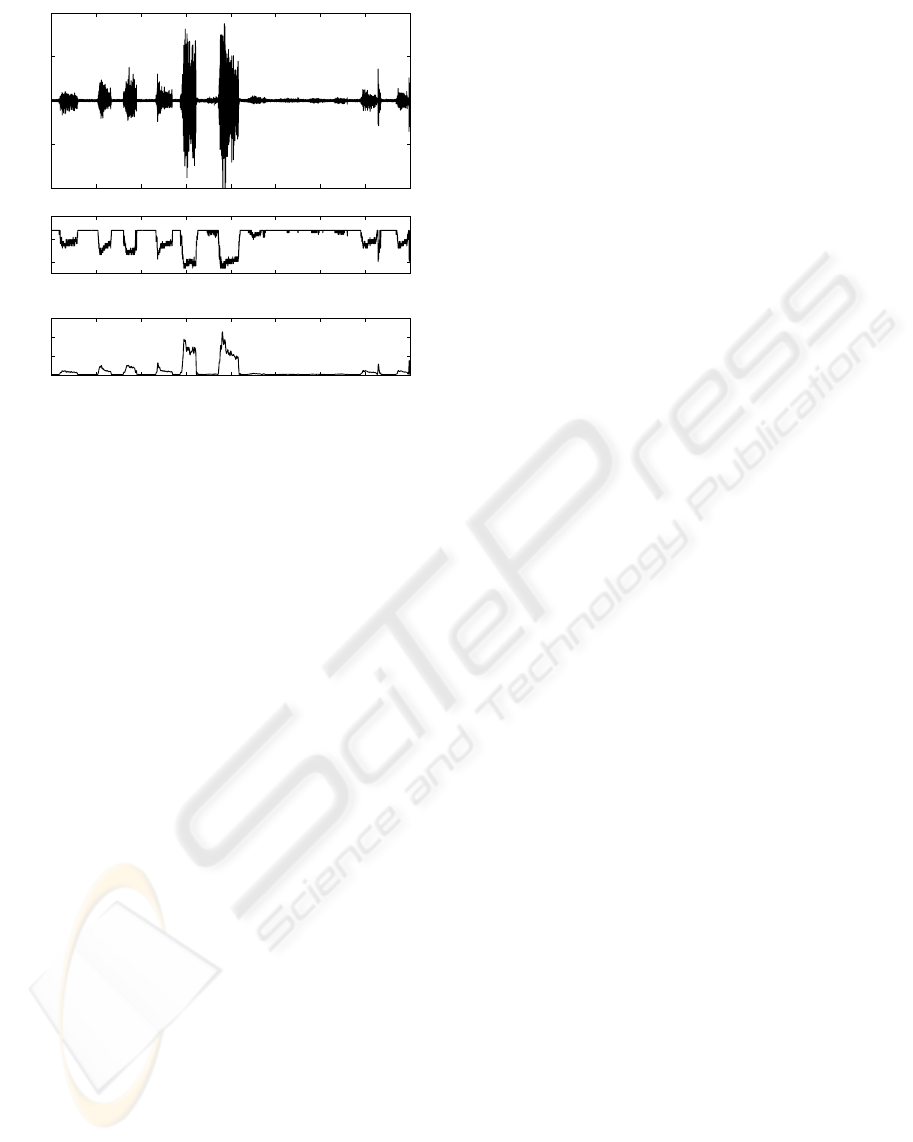
0 10 20 30 40 50 60 70 80
−1.0
−0.5
0.0
0.5
1.0
time [s]
amplitude [mV]
0 10 20 30 40 50 60 70 80
60
80
100
time [s]
gain [dB]
0 10 20 30 40 50 60 70 80
0.0
0.1
0.2
0.3
time [s]
MAV [mV]
Figure 11: Operation of the AGC and resulting MAV es-
timate. From top to bottom: original EMG signal, optimal
gain as selected by the AGC algorithm, post-quantizer MAV
estimate.
estimation equivalent to more than two extra bits of
resolution in the ADC, thus making it possible to use
cheaper components without any serious degradation
of the performance.
5 CONCLUSIONS
A complete wireless electromyographic system was
developed, comprising a wearable sensor board, in-
teracting with software running on a common PC for
elaboration of the acquired data, and remote control
of the acquisition circuitry for optimal system perfor-
mance.
Moreover, the employed technology offers the ca-
pability of configuring reasonably large sensor net-
works for the analysis of several concurrent muscle
fiber activities, also with base stations distributed in
large area laboratories, and for example makes the
analysis of running patients easier. The wireless EMG
sensor makes the patients free of cumbersome wires
and heavy transmitters and, as their movement are
more natural, the resulting analysis is more adherent
to reality. In comparison with other wireless technolo-
gies, these devices have a lower powerconsumption, a
longer battery life, and the networks they realize can
have a greater number of nodes and cover a longer
distance.
In future works the microcontroller will be substi-
tuted by a low-cost DSP, embedding all the peripher-
als on it and augmenting the on-board signal process-
ing capabilities.
REFERENCES
Berzuini, C., Figini, M. M., and Bernardinelli, L. (1985).
Evaluation of the effectiveness of EMG parameters in
the study of neurogenic diseases-a statistical approach
using clinical and simulated data. IEEE Transactions
on Biomedical Engineering, BME-32(1):15–27.
Clancy, E. A. and Hogan, N. (1999). Probability density
of the surface electromyogram and its relation to am-
plitude detectors. IEEE Transactions on Biomedical
Engineering, 46(6).
Jansen, B. H., Miller, V. H., Mavrofrides, D. C., and Jansen,
C. W. S. (2003). Multidimensional EMG-based as-
sessment of walking dynamics. IEEE Transactions
on Neural Systems and Rehabilitation Engineering,
11(3).
Kawakami, G., Nishidaa, Y., and Mizoguchi, H. (2007).
In situ measurement of playing children by wireless
wearable electromyography. In Proc. IEEE Sensors
Conference 2007, Atlanta, GA, USA.
Lemmerhirt, D. F., Staudacher, E. M., and Wise, K. D.
(2006). A multitransducer microsystem for in-
sect monitoring and control. IEEE Transactions on
Biomedical Engineering, 53(10).
Miyazawa, K., Ueno, A., Mori, H., Hoshino, H., and
Noshiro, M. (2006). Development and evaluation of a
wireless interface for inputting characters using lapla-
cian EMG. In Proc. 28th IEEE EMBS Annual Inter-
national Conference, New York City, NY, USA.
Staudenmann, D., Kingma, I., Daffertshofer, A., Stegeman,
D. F., and van Die¨en, J. H. (2006). Improving EMG-
based muscle force estimation by using a high-density
EMG grid and principal component analysis. IEEE
Transactions on Biomedical Engineering, 53(4).
2.4GHZ WIRELESS ELECTROMYOGRAPH SYSTEM WITH STATISTICALLY OPTIMAL AUTOMATIC GAIN
CONTROL - Design and Performance Analysis
45
