
ELECTRONIC DEVICE FOR SEISMOCARDIOGRAPHY
Noninvasive Examination and Signal Evaluation
Zdenek Trefny
1
, Milan Stork
2
and Martin Trefny
1
1
Cardiological laboratory in Prague U Pruhonu 52, 17000 Praha, Czech Republic
2
Univeristy of West Bohemia, Univerzitni 8, 30614 Plzen, Czech Republic
Keywords: Quantitative seismocardiography, Heart rate, Systolic force, Direct digital Synthesis, Analog/digital
converter, Savitzki-Golay filter.
Abstract: The Quantitative seismocardiography (Q-SCG) opens a new field of cardiovascular dynamics examination.
Using this absolutely non-invasive method, a new field of monitoring heart rate variability was opened up.
Systolic forces as well as heart rate variability in relation to changes in external stimuli are registered. Q-
SCG probably offers a more complex view of both isotropic and chronotropic heart functions. It will be
suitable for: examining operators exposed to stress; for assessing the effect of work, fatigue and mental
stress; for monitoring persons as part of disease prevention; for determining a person’s ability to carry out
their duties both on the ground and in the air. An electronic system for acquisition of data for noninvasive
Q-SCG and signal processing is also presented. The measuring system is based on analog filter,
analog/digital converter, microcontroller and personal computer. A special digital smoothing polynomial
filter is used for signal processing. The example of real measured and evaluated signal is also shown.
1 INTRODUCTION
1.1 Balistocardiography
In balistocardiography (BCG), the body vibrations
caused by the heart activity are registered.
Balistocardiography is a non-invasive method
enabling the examination of the cardiovascular
dynamics. This field has a longer history than is
commonly known. William Harvey (1578-1657)
who discovered blood circulation called his work,
published in 1628, „Exercitatio anatomica de motu
cordis et sanguinis in animalibus.“ As the title
suggests, this work covers two main topics:
a) Movement of the heart
b) Movement of the blood
Harvey also states that movement is one of the basic
functions that sustain circulation. This process
requires impulse and force (impetus et violentia),
which are produced by the heart (impulsor). The
heart itself may produce force and impulse, while
blood is propelled and forced to leave its source and
home, towards the peripheral parts of the body.
In 1936, Starr took part in a conference held by the
American Society of Physiology which dealt with
methods of determining cardiac output. For this
purpose, he used a bed with tight springs, whereby
by the movement against these springs increased the
instrument’s natural frequency to values higher than
the heart rate. Thus began the era of high-frequency
balistocardiography, which lasted approximately 15
years. Other types of instruments were developed
later on which measured the displacement, velocity
or acceleration of a body lying on a bed. Later
studies showed that there are difficulties when
comparing records registered on different
apparatuses. This is mainly caused by two factors:
a) The instrument’s natural frequency
b) The instrument’s damping
The instrument’s natural frequency lies within the
range of the frequencies caused by the cardiac
activity that we wish to observe. This leads to
interference and the subsequent recording is a
summation of the oscillations of the instrument and
those of the heart. The other factor that significantly
affects the shape of the registered curve is the
damping installed in these instruments (which are
basically oscillatory systems) in order to prevent the
periodic oscillations of the instruments themselves.
Records of heart activity are therefore deformed.
204
Trefny Z., Stork M. and Trefny M. (2009).
ELECTRONIC DEVICE FOR SEISMOCARDIOGRAPHY - Noninvasive Examination and Signal Evaluation.
In Proceedings of the International Conference on Biomedical Electronics and Devices, pages 204-208
DOI: 10.5220/0001534602040208
Copyright
c
SciTePress

Figure 1: Principle of the noninvasive quantitative
seismocardiography measuring: PT - piezoelectric
transducer, ES - electronic system, PC - personal
computer.
1.2 Quantitative Balistocardiography
Following the critical evaluation of all these facts, in
1952 it was begun with our own experiments related
to the construction of an apparatus which would lack
the aforementioned shortcomings. Thus, over the
years, an apparatus was constructed whose
advantages lie not only in the simplicity of its
design, but also in its important functional qualities.
The properties of the pick-up device and bearing
structure, the subject’s sitting position in close
contact with the seat and an amplifier with a
sufficiently long time constant reduce the possibility
of shape, phase and time deformation of the records.
All this enabled to conduct a physical and
mathematical analysis of the balistocardiographic
system and to calibrate our instrument. Based on
these processes, the apparatus was designated a
quantitative balistocardiograph. This was chiefly to
distinguish it from previous instruments that
registered displacement, velocity and acceleration
and were designed to determine cardiac output on
one hand, and also because our instrument was
calibrated so that force expressed in Newton's
registers an amplitude measurable in mm, whereby
the relationship between the size of the active force
and the registered amplitude is linear, on the other
hand. The quantitative balistocardiographic method
enabled to introduce two characteristic quantities:
systolic force (F) and minute cardiac force (MF),
thus using quantitative balistocardiography in an
exact manner when studying cardiovascular
dynamics at rest and during stress. Current
applications of quantitative balistocardiography (Q-
BCG) in papers published to date the fact that the
relationship between the force acting on the pick-up
device and the amplitude of the balistocardiographic
curve is linear was proved. This enabled to study the
evolution of systolic force in relation to age and
ageing, the influence of hypoxia and hyperoxia. It
was also possible to follow the changes in Q-BCG
indices at rest and under workload in various groups
of volunteers, and to determine the linear
relationship between the skeletal muscle force and
systolic force, and determine changes in Q-BCG
indices in various pathological states. Our
parameters, determined by Q-BCG, with parameters
determined using other non-invasive methods were
compared. (
Trefny at all, 1996).
1.3 Quantitative Seismocardiography
During a visit to the Flight Psychophysiology
Laboratory at Wright-Patterson Airforce Base, a new
application field for Q-BCG emerged. This made
use of the fact that our method enables the recording
of force applied without phase or time deformation.
Thus, heart rate may be monitored and analyzed
using the method of heart rate variability. The
method of Q-BCG was designated by the laboratory
employees as absolutely non-invasive, as the persons
examined did not have any electrodes attached to the
body surface and was not connected by cables to the
registering instrument. This new field of monitoring
heart activity, whereby we determine both
amplitude-force and time-frequency relationships, is
termed Quantitative Seismocardiography (Q-SCG).
(
Trefny at all, 1998). Thus, one may determine the
force-response of the cardiovascular system to
changes in external stimuli, as well as the
autonomous nervous system regulation of the
circulation and the activity of the sympathetic and
parasympathetic systems. The basic part of the Q-
SCG is a rigid piezoelectric force transducer resting
on steel chair. The examined person sits on the seat
placed on the transducer and force caused by the
cardiovascular activity is a measured (Figure 1). The
natural frequency of the chair is higher then 1 kHz
so that there is no interference with the vibrations
caused by the heart activity. Neither damping nor
isolation from building vibrations are necessary.
These properties enabled to calibrate
seismocardiographic system and determine the
absolute value of force acting upon the pick-up-
device. (
Trefny at all, 1999).
The system described in the present study enable
better signal evaluation based on high resolution
analog/digital converter (ADC), digital filtration and
digital correction of nonlinearities and noise
suppression by means of personal computer (PC).
The heart rate (HR), systolic force (F), minute
ELECTRONIC DEVICE FOR SEISMOCARDIOGRAPHY - Noninvasive Examination and Signal Evaluation
205
cardiac force (MF) and breathing frequency (BF) is
non-invasively measured.
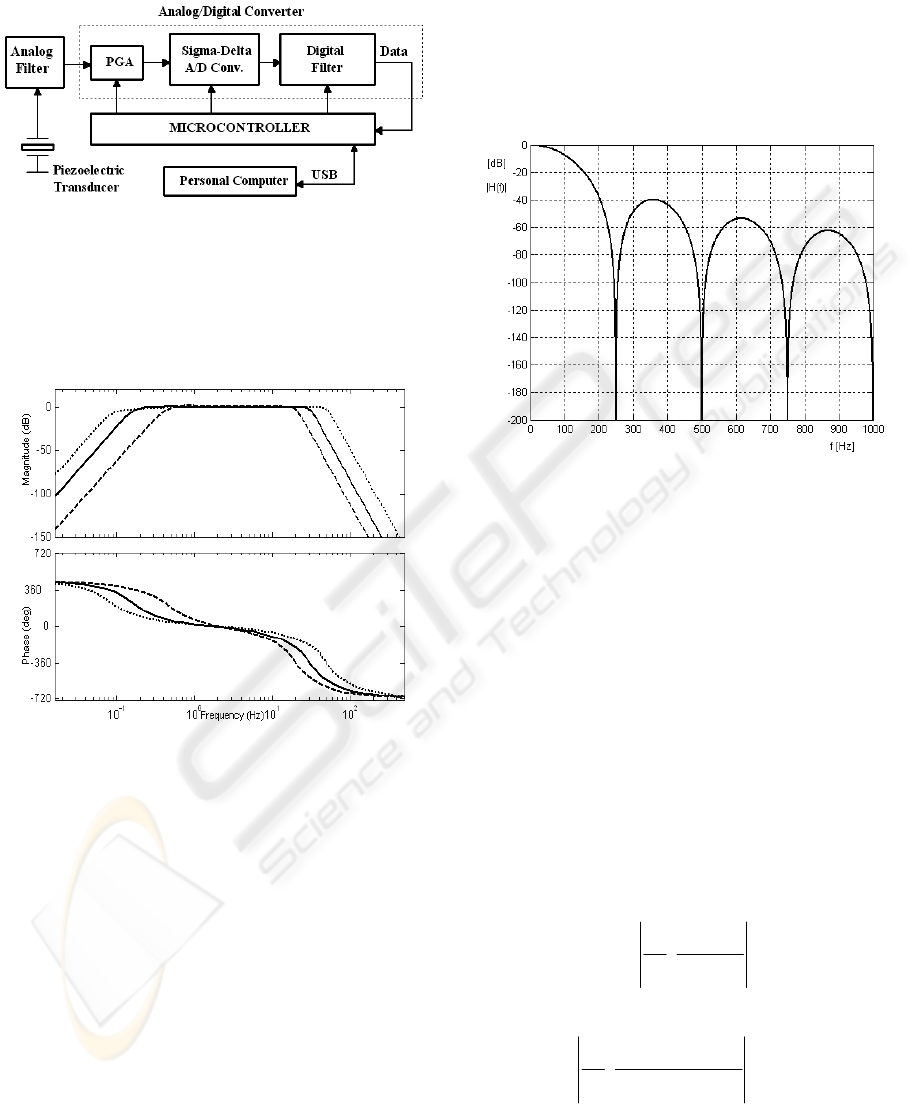
Figure 2: The simplified block diagram of the electronic
system for Q-SCG measuring. The main parts of the
system are: Piezoelectric force transducer, Analog Filter,
PGA - programmable gain amplifier, Sigma-Delta A/D
converter, Digital Filter, microcontroller and Personal
Computer connected to system by means of USB
(Universal serial bus).
Figure 3: The frequency and phase responses of analog,
electronically controlled filter.
2 MATERIALS AND METHODS
The electronic system used for data acquisition
consists of a piezoelectric force transducer (PT),
analog front end for low frequency measurement
applications (containing ADC), microcontroller and
PC. The block diagram of the whole system is
shown in Figure 2. It is important to note, that
amplitude of measured signal from PT is sometimes
under 1 mV (depend on subject heart activity) and
desired frequency spectrum is lower then 30 Hz.
The measured signal is corrupted by strong noise,
baseline wander, etc. therefore the analog and digital
signal processing (DSP) are used for signal
denoising. The frequency and phase responses of
electronically controlled analog bandpass filter are
shown in Figure 3. The analog front end of A/D
converter can accept either 2 low level input signals
(± 10 mV to ±1.225 V, depends on PGA setting) and
produce serial digital output. (AD7707, 2000). It
employs a sigma-delta conversion technique to
realize up to 16 bits of no missing codes
performance.
Figure 4: The frequency response of on-chip digital filter
in A/D converter.
The sigma-delta modulator output is processed by an
on-chip digital filter. The first notch of this digital
filter can be programmed via an on-chip control
register allowing adjustment of the filter cutoff (1.06
Hz to 131 Hz) and output update rate (4.054 Hz to
500 Hz). The -3 dB frequency f-3dB is determined
by the programmed first notch frequency according
to the relationship (1):
f
-3dB
= 0.262 f
FN
= 0.262 f
s
[Hz] (1)
where f
FN
is filter first notch frequency and f
s
is
output update rate (sampling rate). The AD7707’s
digital filter is a low-pass filter with a (sinx/x)
3
response (also called sinc
3
). The transfer function for
this filter is described in z-domain by:
and in the frequency domain by:
3
1
11
() .
1
N
z
Hz
Nz
−
−
−
=
−
(2)
and in the frequency domain by:
3
sin( / )1
() .
sin( / )
s
s
Nf f
Hf
Nff
π
π
= [Hz]
(3)
where N is the ratio of the modulator rate to the
output rate (modulator rate is 19.2 kHz for
Xtal=2.4576 MHz).
BIODEVICES 2009 - International Conference on Biomedical Electronics and Devices
206
The frequency responses of the digital filter are
shown in Fig. 3 and Fig. 4. Phase response is given
by (4):
Phase(f) = -3
π
(N -2) f/f
s
[Rad]
(4)
The data from A/D converter are next filtered also
by Savitzky-Golay Smoothing filter (SG).
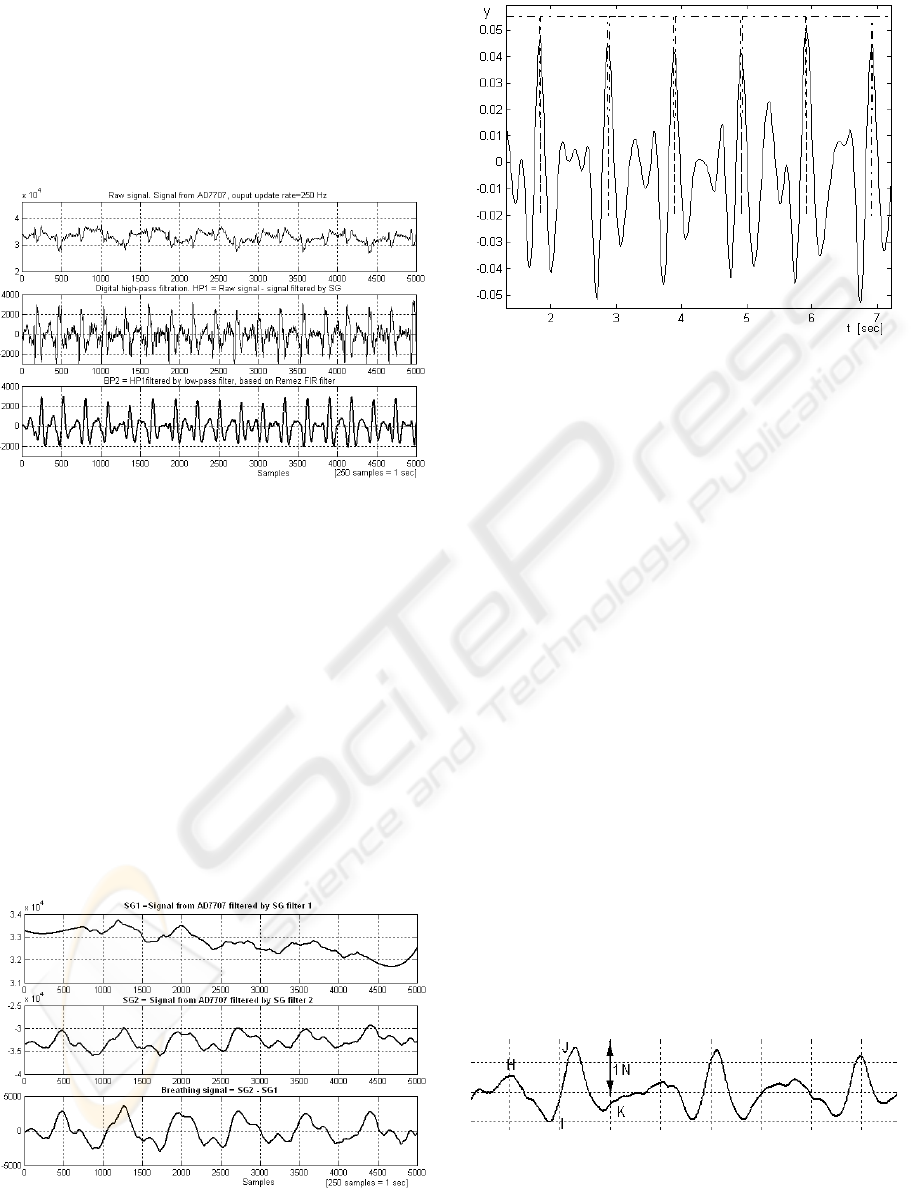
Figure. 5: Record of the Q-SCG in normal man, age 45
years, 78 kg, after lowpass and highpass filtration. Raw
signal is filtered by SG filter and Remez, finite impulse
response (FIR) filter; 250 samples = 1 sec.
Savitzki and Golay defined a family of filters which
are suitable for smoothing and/or differentiating
sampled data (commonly called Savitzki-Golay,
DISPO - Digital Smoothing Polynomial, or least-
square smoothing). (
Savitzki and Golay, 1994). The
data are assumed to be taken at equal intervals. The
smoothing strategy is derived from the least squares
fitting of a lower order polynomial to a number of
consecutive points. (
Madden, 1998). For example, a
cubic curve which is fit to 5 or more points in a least
squares sense can be viewed as a smoothing
function. (
Bromba, Ziegler, 1998), (King at all, 1999).
Figure 6: Breathing frequency derived from raw signal by
means of two SG filters.
Figure 7: The heart rate variability can be also detected
from Q-SCG signal.
An example of Q-SCG measurement is illustrated in
Figure 5. The output update rate was 250 Hz, f
-3dB
was 62.5 Hz. The tree SG filters with different
window length were used for Q-SCG and breathing
signal processing. Data on Y axis are decimal values
of A/D converter. The breathing signal detection is
shown in Figure 6.
The heart rate variability (HRV) can be also
evaluated from Q-SCG signal. The signal processing
example for beat to beat detection is shown in short
time slice of signal in Figure 7. After calibration (Y
axis in Newton), the systolic force F and minute
cardiac force MF can be computed according (5) and
(6):
F = (F
HI
+ F
IJ
+ F
JK
)/3 [N]
(5)
MF= F * HR [N. beats/min]
(6)
where HR is heart rate and F
HI
, F
IJ
, F
JK
can be find
according Figure. 8. The systolic force represent the
force response caused by the heart activity and is
expressed in units of force [Newton]. For the total
intensity of the heart activity is introduced the
minute cardiac force which equals the systolic force
multiplied by the HR.
Figure 8: The systolic force (F) determination from Q-
SCG measured signal from points: H, I, J K.
ELECTRONIC DEVICE FOR SEISMOCARDIOGRAPHY - Noninvasive Examination and Signal Evaluation
207

3 DISCUSSION
The anatomy and function of single organs of human
organism are in correlation. This is true for muscle
mass, the body weight and the muscle force too. The
reason of this fact is that higher body weight needs
for the defined movement greater force, which
cannot be realised but by the development of the
skeletal musculature. Consequently greater
musculature needs more energy which is transported
and distributed by the cardiovascular system. In
addition, the increased performance of the
cardiovascular must be adjusted by the heart muscle.
From these relationship it can be concluded that
there must be not only the correlation between the
skeletal muscle force and the heart mass but also
between the skeletal muscle force and the systolic
cardiac force as it was observed in the present study.
According to our opinion these results may be
extrapolated generally for healthy men without
pathological changes in cardiovascular system.
4 CONCLUSIONS
The principles of Q-SCG, measuring system for
noninvasive measuring of heart activity, breathing
and heart rate variability was presented. Also signal
processing for Q-SCG evaluation was described.
ACKNOWLEDGEMENTS
Zdenek Trefny preparing this paper has been
supported by: Grant Eureka E! 2249.
Milan Stork's participation has been supported by:
Department of Applied Electronic and Tele-
communication, University of West Bohemia and
from GACR (grant No. 102/07/0147).
REFERENCES
Trefny Z., Trefny M., David E., Machova J., Svacinka J.,
1996. Some physical aspects in cardiovascular
dynamics, J. Cardiovaasc., Diag. and Procedures, 13,
No: 2, pp. 141-45.
Trefny Z., Svacinka J., Trefny M., Trojan S., Slavicek J.,
Kittnar O., 1998. Relation between cardiac force and
maximal sceletal muscle force, Journal of Physiology,
Cambridge University Press.
Trefny Z., Svacinka J., Trefny M., David E., David V.,
Trojan S., Slavicek J., Kittnar O., 1999. Noninvasive
method - quantitative balistocardiography (Q-BCG)
and its value, XIII. Congres of the Cardiovascular
System Dynamics Society, Gent., Belgium.
AD7707, 3-Channel 16-bit, Sigma-Delta ADC, Analog
Devices, 2000, Internet site address:
http://www.analog.com.
Savitzki and Golay, 1994. Smoothing and Differentiation
of Data by Simplified Least Squares Procedures,
Analytical Chemistry, vol. 36, no. 8, pp. 1627-38.
Madden H., 1998. Comments on Smoothing and
Differentiation of Data by Simplified Least Square
Procedure, Analytical Chemistry, vol. 50, no. 9, pp.
1383-86.
Bromba U., Ziegler H., 1998. Application Hints for
Savitzki-Golay Digital Smoothing Filters, Analytical
Chemistry, vol. 53, no. 11, pp. 1583-86.
King R., Ruffin C., LaMastus F., Shaw D., 1999. The
Analysis of Hyperspectral Data Using Savitzki-Golay
Filtring - Practical Issues (Part 2), IEEE IGARSS ’99
proceedings.
BIODEVICES 2009 - International Conference on Biomedical Electronics and Devices
208
