
TOWARDS UNIFIED ANALYSIS OF EEG AND FMRI
A Comparison of Classifiers for Single-trial Pattern Recognition
Simon Bergstrand, Malin
˚
Aberg, Timo Niiniskorpi and Johan Wessberg
Institute of Neuroscience and Physiology, University of Gothenburg, Box 432, SE-40530 G
¨
oteborg, Sweden
Keywords:
fMRI, EEG, Pattern recognition, Support vector machines, Artificial neural networks.
Abstract:
Pattern recognition methods, which recently have shown promising potential in the analysis of neurophysio-
logical data, are typically model-free and can thus be applied in the analysis of any type of signal. This study
demonstrates the feasibility of, after suitable pre-processing steps, applying identical state-of-the-art pattern
recognition method to single-trial classification of brain state data acquired with the fundamentally different
techniques EEG and fMRI. We investigated linear and non-linear support vector machines (SVM) and artificial
neural networks (ANNs), and it was found that the SVM is highly suitable for the classification of both fMRI
and EEG single patterns. However, the non-linear classifiers performed better than the linear ones on the EEG
data (linear ANN: 66.2%, SVM: 78.9% vs. non-linear ANN: 71.8%, SVM: 83.2%), whereas the opposite was
true for the fMRI dataset (linear ANN: 74.4%, SVM: 77.2% vs. non-linear ANN: 70.5%, SVM: 74.2%). The
exciting possibility of concurrent EEG and fMRI registration warrants a need for a unified analysis method for
both modalities, and we propose pattern recognition for this purpose. The ability to identify cortical patterns
on a single-trial basis allows for brain computer interfaces, lie detection, bio-feedback, the tracking of mental
states over time, and in the design of interactive, dynamic fMRI and EEG studies.
1 INTRODUCTION
The utility of pattern recognition in the analysis of
neuroscience data has long been understood within
the electroencephalography (EEG) community, es-
pecially with the advent of brain-computer inter-
faces demanding online data analysis (Pfurtscheller
et al., 1992). More recently, similar approaches have
shown great potential in functional magnetic reso-
nance imaging (fMRI) (Norman et al., 2006).
EEG and fMRI signals, although both connected
to brain processing, signal different types of activ-
ity. The EEG is the electrical signal, measurable at
the scalp with electrodes, resulting from the summa-
tion over thousands of synchronously activated post-
synaptic potentials in the cortex, with time-resolution
at the millisecond level but with poor spatial resolu-
tion. On the contrary, fMRI is the measure of blood
flow changes in the brain (indirectly) related to cor-
tical processing. fMRI suffers from poor temporal
resolution, partly due to the inherent hemodynamic
response delay, but, on the other hand, provides ex-
cellent spatial resolution.
Traditional analysis approaches to EEG and fMRI
differ fundamentally. Research EEG is typically
treated as time-series, where event-related potentials
are formed from averaging over hundreds of events
(Fisch, 1999). These are projected onto scalp models,
the frequency content is determined, or dipole sources
are estimated. Clinically, continuous EEG might be
monitored by a highly trained physician. In fMRI,
the governing approach is anatomically locating aver-
age activity using statistical techniques based on the
general linear model and extensive t-testing (Friston
et al., 1994). Both fields are thus dominated by the
mapping of average, often visual, phenomena in the
acquired signal to the experimental condition in ques-
tion. Moreover, much qualitative interpretation is left
to the experimenter or clinician.
High-level pattern recognition, however, does not
discriminate between data types. Instead, each in-
stance of the data (‘pattern’, e.g. an fMRI volume)
is treated generically in terms of input features, typi-
cally a pre-processed variant of the data variables (e.g.
fMRI voxels), with corresponding categories (such
as experimental conditions). An algorithm is trained
to discriminate between the categories using a desig-
nated training dataset where the categories are known.
273
Bergstrand S., Åberg M., Niiniskorpi T. and Wessberg J. (2009).
TOWARDS UNIFIED ANALYSIS OF EEG AND FMRI - A Comparison of Classifiers for Single-trial Pattern Recognition.
In Proceedings of the International Conference on Bio-inspired Systems and Signal Processing, pages 273-278
DOI: 10.5220/0001535002730278
Copyright
c
SciTePress

The training and classifier function is automatic and
follows standardized algorithms: the procedure is en-
tirely data-driven and thus no models are required.
The trained classifier is subsequently applied to
new, unseen data to detect and identify patterns which
corresponds to the categories. These methods can be
used both to localize informative features, for exam-
ple in fMRI activation detection (
˚
Aberg et al., 2008),
for visual inspection, but, importantly, they also pro-
vide a means to directly map the signal (as measured
with EEG or fMRI) to the actual brain state of the sub-
ject. That is, a quantitative measure of the brain pat-
terns in question is obtained. The method can be used
for lie-detection(Davatzikos et al., 2005), the tracking
of subjects mind states over time (Polyn et al., 2005)
and more (Norman et al., 2006).
A number of proficient classification algorithms
have emerged from the research as the most suc-
cessful, including support vector machines (SVMs)
and artificial neural networks (ANNs). Both exist in
implementations capable of discriminating both lin-
ear and non-linear data-structures. Typically, linear
classifiers perform relatively satisfactorily, especially
when time constraints are taken into account (Cox
and Savoy, 2003). Non-linear classifiers, however,
are in theory superior, especially in combination with
a properly pre-processed and selected feature subset
(
˚
Aberg and Wessberg, 2007).
The increasing interest in combining fMRI and
EEG – utilizing the high spatial resolution of the for-
mer and the high temporal resolution of the latter –
calls for a system which is capable of handling both
types of data equally well and conceptually on simi-
lar grounds. We therefore present a generic approach
to model-free pattern analysis of neuroscientific data.
The study aims to evalutate the performance of lin-
ear and non-linear state-of-the-art classifiers, namely
SVMs and ANNs, on EEG and fMRI data, investigat-
ing subject and data differences in parameter and fea-
ture selection. This study has in part been previously
presented in master’s thesis format.
2 METHODS
2.1 EEG Acquisition and
Pre-processing
The study was performed in accordance with the Dec-
laration of Helsinki and approved by the University of
Gothenburg ethics committee.
Four healthy subjects, three female and one male,
one left-handed, participated in the study. The sub-
jects, comfortably seated in a chair, were instructed
to move either the left or the right index finger in
a brisk, self-paced manner according to cues pre-
sented on a screen. The interval between the ran-
domized cues was four seconds, and each cue was
presented for three seconds. Between 250-900 move-
ments were registered for each subject. Movements
were recorded with accelerometers attached to the
fingers (EGAX-5 monoaxial, Entran Inc., Fairfield,
NJ, USA). The EEG was acquired at a sampling
rate of 256Hz using active electrodes and the Active
Two digital EEG amplifier and recording system from
Biosemi, Inc. (Amsterdam, The Netherlands), with
32 scalp electrodes positioned according to the ex-
tended 10/20 system.
The acquired data was high-pass filtered with cut-
off frequency of 1Hz and a reference average of all
channels was subtracted. Epochs of -1000 to +500
ms relative to movement were extracted and visually
inspected for eye blink artifacts. All data process-
ing was performed with Matlab
TM
(The Mathworks,
Massachusetts, USA) software. For every subject,
400 epochs were randomly selected and divided into
training (80%) and validation (20%) data sets contain-
ing equal numbers of left and right finger movements.
The wavelet transform, shown to be more effective
in single-trial EEG characterization than traditional
processing approaches (Trejo and Shensa, 1999), was
then used to extract EEG features with the standard
Debauchies function (level 3) as mother wavelet. The
transform was applied to the data channel by chan-
nel for the pseudo-frequencies 1:1:10 Hz, after which
the asolute of the obtained 2-dimensional coefficient
map was downsampled to 10 by 64 bins. Thus, 640
coefficients were extracted for each of the 32 EEG
channels, resulting in a total of 20480 features. The
processing was performed using the Matlab wavelet
toolbox.
2.2 fMRI Acquisition and
Pre-processing
A 1.5 T fMRI scanner (Philips Intera, Eindhoven,
Netherlands) with a sense head coil was used to
acquire brain scans in five healthy human volun-
teers, three female and two male. Anatomical scans
were collected using a high-resolution T1-weighted
anatomical protocol (TR 22ms; TE 10ms; flip angle,
30
◦
; FOV 256mm). Functional scans were collected
using a BOLD (blood oxygenation level dependent)
protocol with a T2*-weighted gradient echo-planar
imaging sequence (TR 3.5s; TE 51ms; flip angle 90
◦
).
The scanning planes (6mm thickness, 2.3 x 2.3mm in-
plane resolution) were oriented parallel to the line be-
BIOSIGNALS 2009 - International Conference on Bio-inspired Systems and Signal Processing
274

tween the anterior and posterior commisure and cov-
ered the brain from the top of the cortex to the base
of the cerebellum. Each functional scan included 117
volume acquisitions and 25 slices at a spatial resolu-
tion of 128 x 128 voxels.
Following a cue from the scanner, an experimenter
stroked a seven cm wide soft brush over a 16 cm dis-
tance on the right thigh or arm in the distal direction.
Each stimulus lasted 3.5 seconds (one single scan vol-
ume) and was repeated three times. Arm, thigh and
no stimulation of equal duration were performed ran-
domly during the scan.
Data pre-processing was carried out with soft-
ware developed at the Montreal Neurological Insti-
tute. Functional data were motion corrected and low-
pass filtered with a 6mm full-width half-maximum
Gaussian kernel. The data was shifted by one volume
to correct for hemodynamic delay.
Volumes containing thigh stimulation were ig-
nored, resulting in six functional scans including 38
volumes of arm stimulation and 38 volumes of rest.
The study was limited to the axial slice most repre-
sentative of the primary somatosensory cortex, highly
involved in the processing of tactile stimuli. For each
volume, voxels not containing tissue were discarded
and the BOLD-values in the remaining voxels were
linearly normalized to the range [0 1]. All volumes
were randomized before used in training.
2.3 Feature Ranking
A simple univariate method was implemented for fea-
ture ranking and subsequent selection as follows:
f
i
= abs(
µ
0
− µ
1
σ
0
+ σ
1
) (1)
where µ
0
and µ
1
represent the mean value of feature
i over the patterns (volumes and epochs, for fMRI
and EEG respectively) belonging to class 0 and 1 re-
spectively, and σ
0
and σ
1
are the standard deviations
within each class. The feature ranking value is thus a
measure of feature stability, over the patterns, as well
as how well it separates the data classes. For subse-
quent feature selection, the features were thus ranked
and a given number was selected accordingly (see the
results section).
2.4 Classifiers
Two state-of-the-art classifiers, including support vec-
tor machines (SVMs; The Matlab
TM
toolbox LS-
SVMlab; Suykens et al., 2002) and artificial neural
networks (ANNs; Matlab
TM
and the neural network
toolbox) were used in this study. For the SVMs,
Table 1: Resulting classifier parameters for fMRI data.
Method Features Parameters
Linear SVM 550 γ = 2
−2.5
Non-linear SVM 90 γ = 2
7
Linear ANN 260 nHidden = 0
Non-linear ANN 260 nHidden = 2
both linear and RBF kernels were evaluated and com-
pared. For the ANNs, fully connected feed forward
networks with a backpropagating training algorithm
(Levenberg-Marquardt) and the mean square error
(MSE) as error function was used. The ANN output
was thresholded to yield binary outputs.
3 RESULTS
All results below refer to the five-fold cross-validation
score as averaged over all subjects. There are equal
number of categories in each dataset, and the level of
chance is thus 50%.
3.1 Number of Features and Classifier
Parameters
Table 2: Resulting classifier parameters for EEG data.
Method Features Parameters
Linear SVM 1400 γ = 2
−2.5
Non-linear SVM 500 γ = 2
7
, σ
2
= 2
9
Linear ANN 60 nHidden = 0
Non-linear ANN 440 nHidden = 2
For the SVMs, the number of features to include,
the margin γ, and, for the non-linear RBF kernel,
the bandwidth parameter, σ
2
, require explicit spec-
ification. In order to establish a proper parameters
a grid search was performed. For each dataset, the
specified number of features were selected from the
feature ranking list (see equation 1). For the lin-
ear SVM, the search was performed with the num-
ber of features in the range 10-1000 in combination
with γ = 2
−19
− 2
21
. For the non-linear SVM, the
feature subset size was varied in the range 10-1000,
γ = 2
−15
− 2
50
and σ
2
= 2
−5
− 2
55
. Smaller steps
close to the identified local maxima were investigated.
The grid search was repeated for each of the five-
fold datasets, and the subsequent parameters were ob-
tained from the maximum average score. Similar re-
sults were obtained for the fMRI and EEG data. For
the linear SVM, a maxima was obtained at γ = 2
−2.5
.
For the nonlinear SVM all pairs in a diagonal range
TOWARDS UNIFIED ANALYSIS OF EEG AND FMRI - A Comparison of Classifiers for Single-trial Pattern
Recognition
275
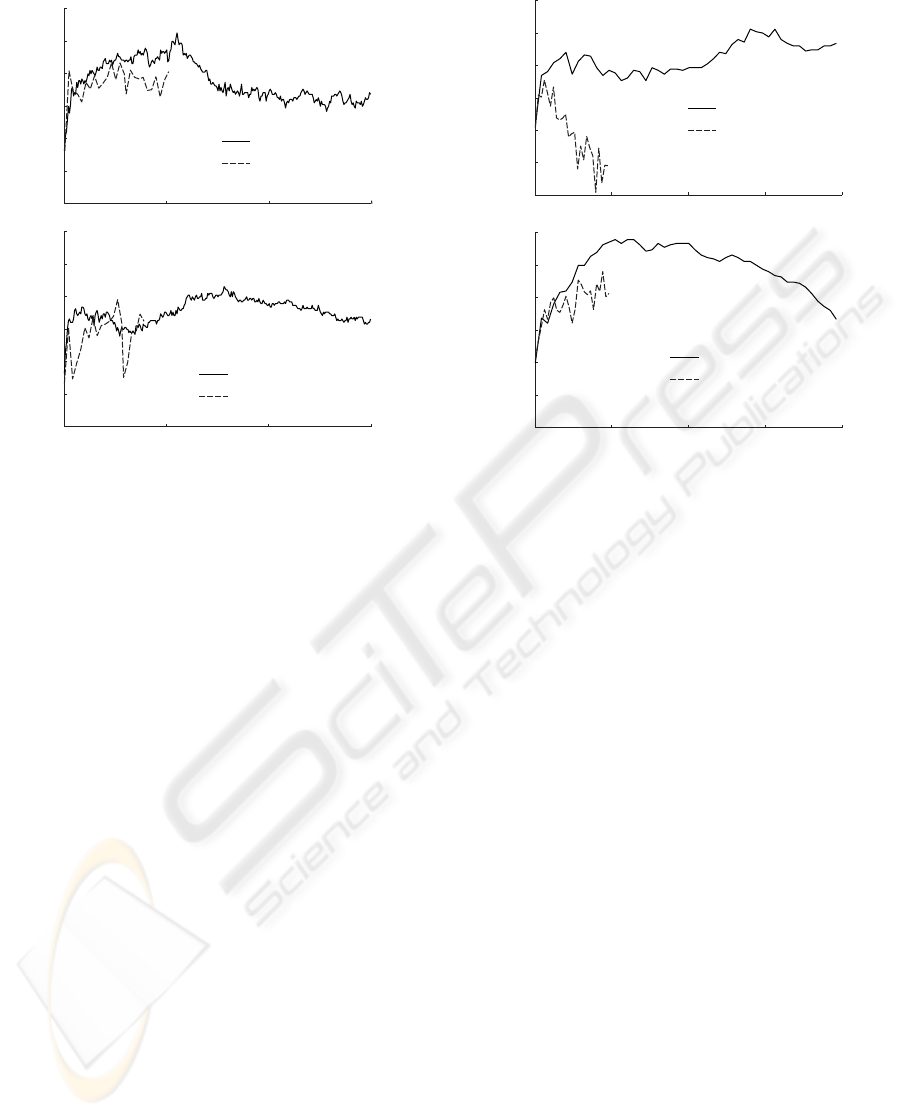
Classification performance
fMRI
Number of features
15000 500 1000
Non-linear ANN
Non-linear SVM
55
65
75
85
15000 500 1000
55
65
75
85
Linear ANN
Linear SVM
Figure 1: Classification performance as a function of the
number of included features for fMRI data.
performed well. For reduced complexity and maxi-
mal speed of computation, the lowest parameter val-
ues were chosen along the high performing diagonal,
resulting in γ = 2
7
and σ
2
= 2
9
.
For the ANN, the number of layers, number of
neurons in each layer and type of transfer functions
require specification. Due to time constraints, we lim-
ited the non-linear, multilayer network to contain only
two hidden neurons. We also investigated a (linear)
single layer network with only an output neuron. Em-
pirically, the tan-sigmoid function was found suitable
for all nodes. The obtained parameters are summa-
rized in tables 1 and 2.
The effect of the number of features included for
classification on the performance is presented in fig-
ure 1 and 2 for the fMRI and EEG data respectively.
Due to excessive time requirements for training of
large ANNs, the maximum feature subset sizes were
restrained compared to the SVMs.
For the fMRI data, all classifiers show drastic im-
provement in classification accuracy with the addi-
tion of 1 up to 50 voxels (figure 1). Both the linear
and non-linear ANNs, however, continue improving
slightly and eventually reach a plateau at 100 voxels,
without apparent decrease in performance. It is pos-
sible that the classification accuracy continues to in-
crease with further addition, but the excessive time re-
quirements renders this unfeasible to investigate. The
linear SVM peaks at around 500 voxels, whereas the
Classification performance
Number of features
2000
55
65
75
85
0
500 1000 1500
Linear ANN
Linear SVM
20000 500 1000 1500
Non-linear ANN
Non-linear SVM
55
65
75
85
EEG
Figure 2: Classification performance as a function of the
number of included features for EEG data.
non-linear SVM continues to increase until 700 vox-
els. After the peak both classifiers behave similarly,
and declines.
On the EEG dataset, the behavior of the classi-
fiers is quite different (figure 2). The linear ANN
increases sharply initially, peaks at 50 and 150 fea-
tures respectively, and then declines in performance
rapidly. Where there is a reasonably steep increase
until 500 features, and henceforth a sharp decline in
performance for the linear SVM fMRI classification,
the corresponding EEG data performance sees a steep
increase until 250 features and then an alternating per-
formance, that, eventually, beings to increase again.
The maximum appears to be reached at 1500 features.
The non-linear SVM, on the other hand, peaks at 500
features, after which it declines continuously. Simi-
larly, the non-linear ANN increases continuously, al-
beit not as sharply as the SVM, until 500 features,
after which no further testing was feasible.
3.2 Classification Performance
The algorithms were evaluated using fivefold cross
validation and the classifier parameters established
above (see tables 1 and 2). In all trials there are equal
numbers of patterns from each class so the level of
chance is 50%.
As is shown in figure 3, the SVM with a linear
kernel and 550 features proved most successful of
BIOSIGNALS 2009 - International Conference on Bio-inspired Systems and Signal Processing
276

Classification
performance
Non-linear
SVM
Non-linear
ANN
Linear
SVM
Linear
ANN
fMRI EEG
85
75
65
Figure 3: Subject mean classification results on the EEG
and fMRI data.
all the methods on the fMRI data with a mean clas-
sification rate over all five subjects of 77.2% (range
69.2-83.3%). Second best, the linear ANN with 260
features achieved a mean classification rate of 74.4%
(range 65.2-81%). The non-linear classifiers per-
formed worse: the SVM, in combination with 780
features scored 74.2% (range 65.8-81.6%) correct,
and the non-linear ANN achieved a subject mean clas-
sification rate of 70.5% (range 57.4-78.9%).
For the EEG data, on the other hand, the non-
linear classifiers performed better than the linear ones.
The SVM, with 500 features, achieved a classification
performance of 83.2% (range 71.7-94.7%), whereas
the ANN with two hidden neurons and 440 features
resulted in a 71.8% (range 66.1-78.7%) correct per-
formance. The linear SVM, in combination with 1400
features, classified 78.9% (range 67.6-91.6%) of the
epochs correctly, and the single layer ANN, with 60
features, scored 66.2% (range 62-73.3%).
4 DISCUSSION
In this study we have showed that is is feasible to
apply identical pattern recognition algorithms to the
analysis of both fMRI and EEG signals. Moreover,
we have compared state-of-the-art classifiers, investi-
gated whether non-linear or linear classifiers are suit-
able for either modality, as well as determined the
effect of the number of features on the classification
performance on all classifier approaches.
The EEG and fMRI data do, naturally, require dif-
ferent preprocessing methods. Subsequently, how-
ever, the proposed analysis method is identical for
both modalities and, importantly, the signals are
treated in conceptually similar manners. Furthermore,
the resulting classifier outputs can be used for instant
and direct comparison between the EEG and fMRI
signals, which opens up for exciting exploration pos-
sibilities. Also, the resulting EEG classifier output
can be used as a regressor in various types fMRI anal-
ysis, such as standard general linear model activation
localization or for pattern recognition purposes.
It was found that, regardless of classifier, the non-
linear schemes performed best on fMRI data, while
non-linear classifiers achieves higher scores on EEG
data. The fact that non-linear classifiers are not supe-
rior to linear ones in classifying fMRI data was also
observed by Cox and colleges (Cox and Savoy, 2003)
using a cubic polynomial SVM. It is likely that the lin-
ear separability of the data is a result of the inherent
smoothing of the fMRI data, as opposed to the under-
lying neural signal. The BOLD response is smoothed
over some seconds, and the blood flow is increased
in a volume with active neurons rather than to single
neurons. The EEG features, on the other hand, con-
sist of distinct representations of wavelet scales and
points in time, allowing for non-linear relationships
to persist.
The superiority of the SVM is expected – al-
though ANNs are represented in fMRI classification
literature (Polyn et al., 2005), the SVM has been
the successful classifier of choice for a large num-
ber of studies made on fMRI-data (Cox and Savoy,
2003; Mitchell et al., 2004; Kamitani and Tong, 2005;
Mour
˜
ao-Miranda et al., 2005; LaConte et al., 2005).
Not only does SVM generalize better than the ANN in
the present study, but the excessive time requirement
for large scale ANN training renders proper evalu-
ation problematic. The ANN classifiers used here,
however, verify the suitability of non-linear classifiers
for fMRI classification, and vice versa for EEG data.
It should also be noted that, within individuals, the
fMRI data was randomized and the temporal smooth-
ing over volumes was not taken into account. Thus,
the absolute classification numbers achieved on the
fMRI data are somewhat exaggerated.
The performance behaved differently as a function
of the number of included features, with respect to
the linearity of the classifiers and the datasets. In-
terestingly, for the EEG data, the linear ANN peaked
rapidly at a relatively the low number of 50 features
and then declined drastically, whereas the same clas-
sifier on the fMRI dataset continued to increase in
performance until 100 voxels and then leveled out.
Moreover, the non-linear SVM behaves very similar
on the fMRI data, as does the linear SVM on the EEG
data. The detailed mechanisms behind these behav-
iors require more research, but it is evident that the
SVM, both linear and non-linear, on the EEG data as
well as the fMRI data, is less sensitive to the data di-
mensionality than any of the other classifiers.
The feature selection approach, being univariate,
is non-optimal for multivariate pattern classification.
It has been shown in EEG that with feature selection
TOWARDS UNIFIED ANALYSIS OF EEG AND FMRI - A Comparison of Classifiers for Single-trial Pattern
Recognition
277

specifically tailored to a given classifier, the choice
of linear or non-linear classifiers become less impor-
tant (
˚
Aberg and Wessberg, 2007). However, stochas-
tic feature selection methods tend to be computation-
ally intensive, and since the univariate feature selec-
tion method is substantially faster it can be preferred
in time-limited circumstances such as real-time anal-
ysis.
This study does not use concurrently registered
EEG and fMRI data. In fact, different experimen-
tal conditions are used (motor actions versus tactile
stimulus), but the underlying problem of single-trial
classification and the implications thereof remain. A
simultaneous EEG and fMRI registration study is cur-
rently in progress, as is further research into the uti-
lization of a unified pattern recognition approach to
the analysis of both modalities.
5 CONCLUSIONS
Pattern recognition, where classification models are
entirely data-driven, is a suitable approach to a uni-
fied, conceptually identical analysis of fMRI and EEG
data. Using classifier-based techniques, it is possi-
ble to automatically identify and label cortical pat-
terns related to given experimental conditions present
in singe-trial data – for signals acquired with EEG as
well as with fMRI. Investigating state-of-the-art clas-
sifiers, the support vector machine was found to out-
perform the artificial neural networks, whereas non-
linear classifiers performed better than linear such for
EEG data and vice versa for fMRI data.
ACKNOWLEDGEMENTS
This study was supported by the Swedish Research
Council (grant 3548), the Sahlgrenska University
Hospital (grant ALFGBG 3161), and the foundation
of Magnus Bergvall.
REFERENCES
˚
Aberg, M. C., L
¨
oken, L., and Wessberg, J. (2008). An evo-
lutionary approach to multivariate feature selection for
fMRI pattern analysis. Proceedings of the Interna-
tional Conference on Bio-inspired Systems and Signal
Processing.
˚
Aberg, M. C. and Wessberg, J. (2007). Evolutionary op-
timization of classifiers and features for single trial
EEG discrimination. BioMedical Engineering Online,
6(32).
Cox, D. D. and Savoy, R. L. (2003). Functional magnetic
resonance imaging (fMRI) ’brain reading’: detecting
and classifying distributed patterns of fMRI activity
in human visual cortex. Neuroimage, 19(2 Pt 1):261–
270.
Davatzikos, C., Ruparel, K., Fan, Y., Shen, D., Acharyya,
M., Loughead, J., Gur, R., and Langleben, D. (2005).
Classifying spatial patterns of brain activity with ma-
chine learning methods: Application to lie detection.
Neuroimage, 28:663–668.
Fisch, B. J. (1999). Fisch & Spehlmann’s EEG Primer;
Basic Principles of Digital and Analog EEG. Elsevier
Science, third edition edition.
Friston, K. J., Holmes, A. P., Worsley, K. J., Poline, J. P.,
Frith, C. D., and Frackowiak, R. S. J. (1994). Statisti-
cal parametric maps in functional imaging: A general
linear approach. Human Brain Mapping, 2(4):189–
210.
Kamitani, Y. and Tong, F. (2005). Decoding the visual and
subjective contents of the human brain. Nature Neu-
roscience, 8(5):679–685.
LaConte, S., Strother, S., Cherkassky, V., Anderson, J., and
Hu, X. (2005). Support vector machines for temporal
classification of block design fMRI data. Neuroimage,
26(2):317–29.
Mitchell, T. M., Hutchinson, R., Niculescu, R. S., Pereira,
F., Wang, X., Just, M., and Newman, S. (2004). Learn-
ing to decode cognitive states from brain images. Ma-
chine Learning, 57(1-2):145–175.
Mour
˜
ao-Miranda, J., Bokde, A. L., Born, C., Hampel, H.,
and Stetter, M. (2005). Classifying brain states and de-
termining the discriminating activation patterns: Sup-
port vector machine on functional MRI data. Neu-
roImage, 28(4):980–95.
Norman, K. A., Polyn, S. M., Detre, G. J., and Haxby, J. V.
(2006). Beyond mind-reading: multi-voxel pattern
analysis of fMRI data. Trends in Cognitive Sciences,
10(9):424–430.
Pfurtscheller, G., Flotzinger, D., Mohl, W., and Peltoranta,
M. (1992). Prediction of the side of hand movements
from single-trial multi-channel EEG data using neural
networks. Electroencephalography and Clinical Neu-
rophysiology, 82(4):313–5.
Polyn, S. M., Natu, V. S., Cohen, J. D., and Norman,
K. A. (2005). Category-specific cortical activity
precedes retrieval during memory search. Science,
310(5756):1963–6.
Trejo, L. and Shensa, M. (January 1999). Feature extraction
of event-related potentials using wavelets: An appli-
cation to human performance monitoring. Brain and
Language, 66:89–107(19).
BIOSIGNALS 2009 - International Conference on Bio-inspired Systems and Signal Processing
278
