
PULMONARY PRESSURE-VOLUME CURVES OF
ELASTASE-TREATED AND CONTROL RATS
Angelos Kyriazis, Jes
´
us Ruiz-Cabello, Ignacio Rodr
´
ıguez
Instituto de Estudios Biofuncionales, CIBER de Enfermedades Respiratorias
Paseo Juan XXIII 1, Universidad Complutense de Madrid, Madrid, Spain
Sandra P
´
erez-Rial, Laura del Puerto Nevado, Germ
´
an Peces-Barba
Fundaci
´
on Jim
´
enez-Diaz, CIBER de Enfermedades Respiratorias, Avda. Reyes Cat
´
olicos 2, Madrid, Spain
Keywords:
Elastase induced emphysema, rat lung mechanical properties, respiratory pressure-volume curve.
Abstract:
The objective of this experiment is to test if the emphysematous and the control rats can be classified according
to the pulmonary pressure-volume curves. Emphysema was simulated by instilling elastase to the rat lungs
and leaving them to develop the disease for 6 weeks. The pressure-volume curves were acquired by a custom-
designed ventilator. The pressure at the inflection point of the inhalation limb of the curves has been used as
a feature to separate the two classes of animals. The extension of emphysema in the rat lungs was assessed
post-mortem by measuring the mean surface of the alveoli. This was possible after extracting the lungs, slicing
them, photographing them and analysing the pictures. The mean surface of the alveoli distinguishes clearly the
control from the emphysematous rats, which verifies the deteriorating effect of elastase over the lung alveoli.
However, no clear correlation was found between the pressure-volume curves inflection-points and the animal
classes.
1 INTRODUCTION
The pressure-volume (PV) curve of the lungs has been
an extensive object of research by many groups for
different purposes (Jose G. Venegas, 1998)(R. Peslin,
1996)(R. Scott Harris, 2000). PV curves of the hu-
man lungs, as measured by spirometry, are a useful
tool to the clinicians as they provide with useful infor-
mation for the disease state of patients suffering from
lung diseases such as chronic obstructive pulmonary
disease, acute respiratory distress syndrome, asthma,
cystic fibrosis and emphysema (Lumb, 2005)(West,
2008). In the intensive care unit the PV curves anal-
ysis of mechanically ventilated patients helps to de-
termine the optimum level of positive end-expiratory
pressure to prevent side-effects such as acute lung in-
jury (R. Scott Harris, 2000)(Roy G. Brower, 2004).
Based on PV curves measurements on mechanically
ventilated rabbits, (R. Peslin, 1996) developed a
model to study the mechanical properties of the lungs.
In (R. Scott Harris, 2000) a model for the quan-
tification of PV curve parameters is introduced. In
this publication an attempt is made to classify con-
trol and emphysematous rats by using data that have
been extracted from pulmonary PV curves using the
afore mentioned model. The advantages of the used
method are the simplicity of the used equipment and
the straight-forwardness of both the mathematical and
the disease model. The measurements are based on
the ventilator as described in (Rigoberto Perez de
Alejo, 2005). The ventilator that was actually used
is an updated version that has the possibility of PV
curves acquisition.
A sensitive method to measure the mechanical
properties of the rat lungs would prove useful for the
effectiveness evaluation of new drugs tested on rats.
2 METHODS
In this study the experimental results of two experi-
ments are analysed. The first, referred to as experi-
ment 1, was performed in April 2008 and the second,
referred to as experiment 2, in June 2008.
480
Kyriazis A., Ruiz-Cabello J., Rodríguez I., Pérez-Rial S., del Puerto Nevado L. and Peces-Barba G. (2009).
PULMONARY PRESSURE-VOLUME CURVES OF ELASTASE-TREATED AND CONTROL RATS.
In Proceedings of the International Conference on Bio-inspired Systems and Signal Processing, pages 480-486
DOI: 10.5220/0001537604800486
Copyright
c
SciTePress
2.1 Animal Preparation
The race of rats is male Wistar, weighting between
250 and 350 g.
In experiment 1 ten animals were used: 5 controls
and 5 elastase-induced. At 6 weeks prior to the ex-
periment 5 of the animals were treated with elastase
and 5 with saline. The time before the experiment
was enough for emphysema to develop in the lungs of
the elastase-treated animals. (Joseph P. Dugas, 2004)
and (Stefanida Kononov, 2001) reported that emphy-
sema was detectable 2 and 4 weeks respectively after
elastase instillation. The control animals were treated
with saline to ensure that the difference of behaviour
between the two categories is not due to the stress of
washing the lungs with the fluid (Stefanida Kononov,
2001).
15 units of fresh elastase SIGMA# E0127 in a fi-
nal volume of instillation of 0.5 mL was instilled to
the rats after they were anaesthetised with isoflurane.
The liquid was instilled through a catheter, which was
inserted all the way to the lungs with a viewing tool
similar to an otoscope.
In experiment 2 ten animals were used: 7 elastase-
induced and 3 controls. 6 weeks prior to the experi-
ment 7 of the animals were treated with elastase and
the other 3 were treated with saline.
The elastase that was used to instill the animals
in June was the same as the one used in April. In the
meantime, it was preserved at 4
o
C. 30 units of elastase
were dissolved in a final volume of 0.5 mL. The con-
centration of elastase used in experiment 2 was higher
than in experiment 1 because in experiment 1 elastase
was fresh, whereas in experiment 2 it was not. Elas-
tase is known to lose its effectiveness after it is re-
moved from its package. Therefore, a larger concen-
tration of old elastase is necessary to reach the same
effect as with fresh elastase.
The instillation was performed by placing the ani-
mal with an angle on a specially designed ramp. The
liquid was then introduced through the mouth to the
lungs. It was ensured that the liquid went to the tra-
chea and not the oesophagus by blocking the rat’s
nose with a pair of pliers.
2.2 Experimental Procedure
The experimental procedure was the same both in ex-
periment 1 and 2.
The animals were initially anaesthetised first with
isoflurane and subsequently peritoneally with a NAR-
COREN (sodium pentobarbital) dose of 100 µL/100
g. Then they were tracheotomised and a tube was in-
serted and tied at their trachea. The exterior part of
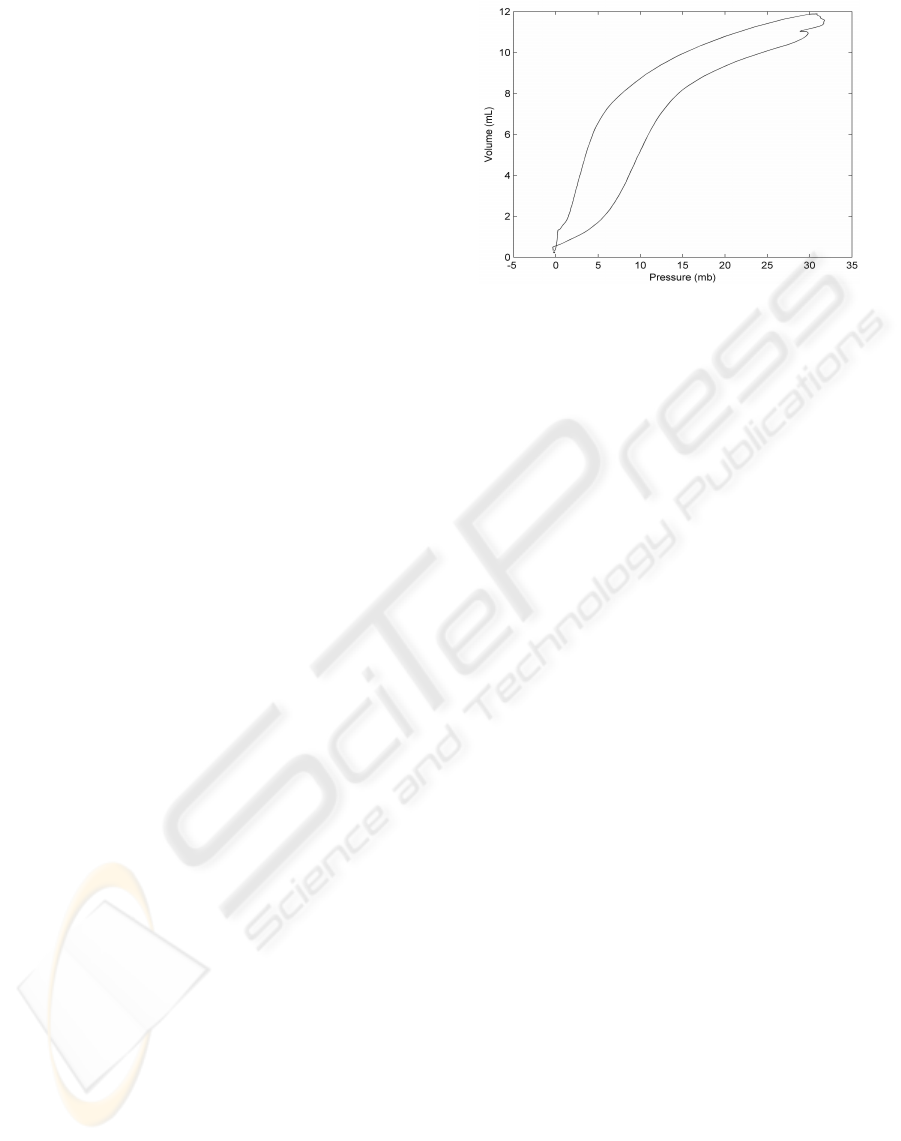
Figure 1: A PV curve of control 3 rat from experiment 1.
this tube is suitable for the connection of the ventilator
(section 2.3). The animal was firstly imaged in a MRI
scanner and after 20-30 minutes it was brought to the
ventilator for the PV curve acquisition. The acquisi-
tion lasted 10-20 minutes depending on the animal’s
response to the mechanical respiration. Some animals
need longer time than others to adapt to the exterior
pace of breathing without counteracting. Finally, the
rats were scanned by CT and after that their lungs
were perfused with saline and subsequently extracted
and fixed with a 10% paraformaldehyde solution for
24 h. The fixed lungs were brought to the Fundaci
´
on
Jimenez-Diaz, Madrid, Spain and cut with a micro-
tome in 5 µm slices, which were photographed with
a LEICA DFC290 camera. 54 pictures correspond to
the lungs of each animal.
In this study the PV curve measurements data as
well as the morphometry data from the lung pictures
are analysed.(section 2.4.2)
2.3 Ventilator
The device that was used to acquire the pressure-
volume curves is a ventilator that has been designed
and manufactured in the Universidad Complutense de
Madrid (Rigoberto Perez de Alejo, 2005). The ver-
sion that was actually used is an update of (Rigoberto
Perez de Alejo, 2005). An important difference be-
tween the first and the second version that was used
in the present study is that the now PV curves ac-
quisition is possible. Reliability of the pressure and
volume indications of the ventilator has been verified
with a water column and a syringe.
Before each measurement the ventilator was cal-
ibrated and system tightness and integrity was veri-
fied. A slightly positive drift of the volume indica-
tion was maintained to ensure proper function of the
auto-reset-volume feature of the ventilator. The sig-
nals were converted to digital at a frequency rate of
PULMONARY PRESSURE-VOLUME CURVES OF ELASTASE-TREATED AND CONTROL RATS
481
50 Hz and each acquisition lasted 30 s, correspond-
ing to 1500 datapoints (measurements of pressure and
volume).
Each animal was connected to the mechanical
ventilation initially in normal mode of respiration.
The breathing rate was set at 60 breaths per minute,
the tidal volume at 3 mL and the ratio of the inspira-
tory time to total cycle duration ratio was 0.33. Un-
der this volume the recorded pressure inside the lungs
was 10 mbars. Correct volume was constantly veri-
fied through the sensor indications.
The PV curves were acquired in the acquisition
mode of the ventilator. The air was pushed inside the
lungs of each animal until it reached either 15 mL or
30 mbars of pressure. In this way it was ensured that
maximum lung capacity was reached without risking
injuring the animal. Because the time of inspiration
is not controlled by the ventilator, this implies that in
each acquisition a different number of curves was reg-
istered. Just after the inhalation ended, without any
apnoea, each animal was allowed to expire without
obstruction for 2 s. Subsequently, the new PV curve
cycle started by pushing again air inside the lungs.
This process was repeated for 30 s before the animal
returned to normal mode of respiration. In this way
a total of 7 to 8 consecutive, full PV curves were ac-
quired. Such a group of curves consists one set of
measurements. Each set of measurements comprises
1500 points, which are the number of measurements
that the ventilator performs in 30 s at a sampling rate
of 50 Hz. The 1500 points of each acquisition were
stored in a different ASCII format file.
For each animal a different number of sets of mea-
surements was acquired. This number as well as the
total acquired PV curves for all the sets of measure-
ments appear in tables 1 and 2. The time between
consecutive sets of measurements varied from 3 to 10
minutes depending on the response of each animal to
the mechanical ventilation and to the stress of inhal-
ing consecutively, many times volumes equal to the
total lung capacity.
In experiment 1 more sets of measurements were
acquired than in experiment 2. The reason for this is
discussed in section 4.1.
2.4 Data Processing
2.4.1 PV Curves
After the experiment the data was analysed by fitting
a sigmoidal function ((Jose G. Venegas, 1998) and
(R. Scott Harris, 2000), equation 1) to the inflation
limb of each PV curve. According to (Jose G. Vene-
gas, 1998) the deflation limb does not provide useful
Table 1: Experiment 1. C: control animal. E: elastase-
treated animal.
C/E Sets Total cycles
C1 5 33
C2 4 29
C3 5 37
C4 5 36
C5 2 14
E1 4 27
E2 6 40
E3 5 35
E4 6 42
E5 4 26
Table 2: Experiment 1. C: control animal. E: elastase-
treated animal.
C/E Sets Total cycles
C1 2 17
C2 2 17
C3 2 17
E1 1 7
E2 2 16
E3 2 16
E4 2 19
E5 2 17
E6 2 16
E7 2 16
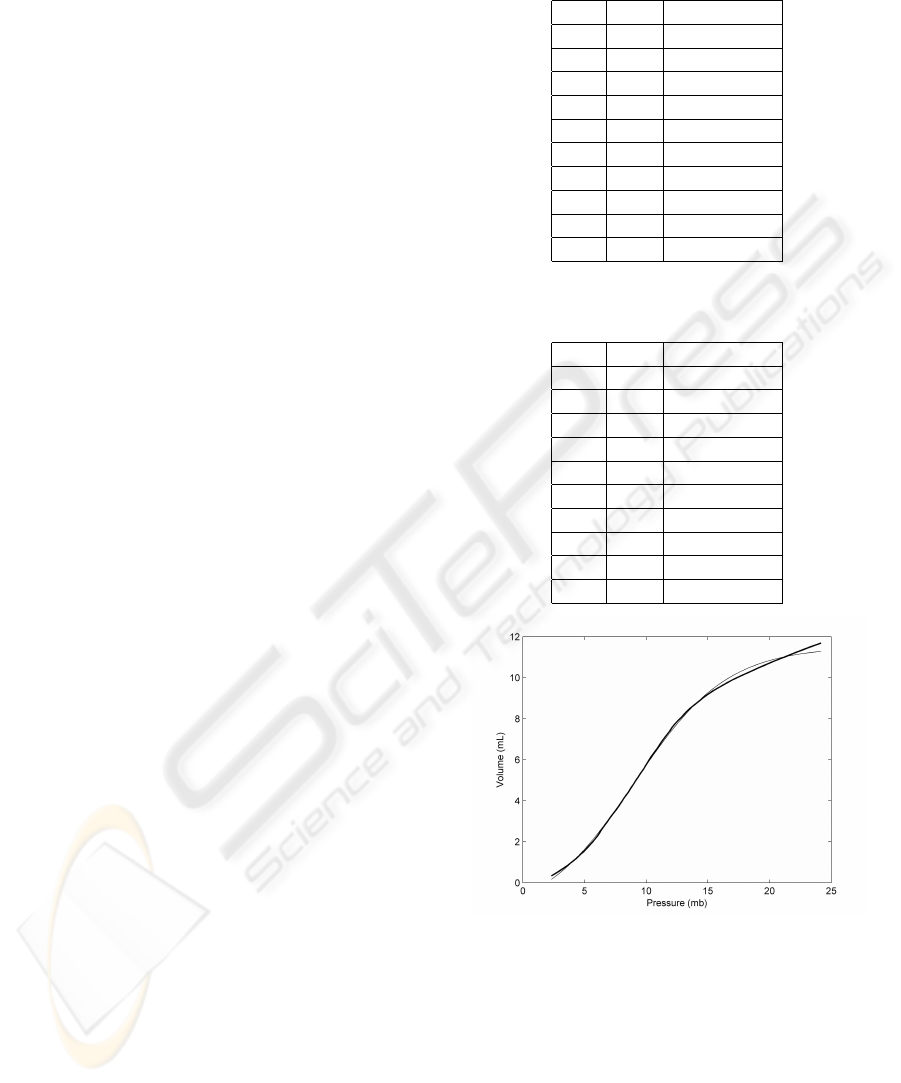
Figure 2: The thick line corresponds to the inflation limb
of a PV curve. The thin line represents the fitted sigmoidal
function. The pressure of the inflection point is 9 mb.
information because exhalation was allowed to occur
without obstruction.
The model to fit the pulmonary PV curves of
(Jose G. Venegas, 1998) and (R. Scott Harris, 2000)
was preferred from others (R. Peslin, 1996) for its
simplicity and comprehensive physical interpretation
of its parameters.
BIOSIGNALS 2009 - International Conference on Bio-inspired Systems and Signal Processing
482
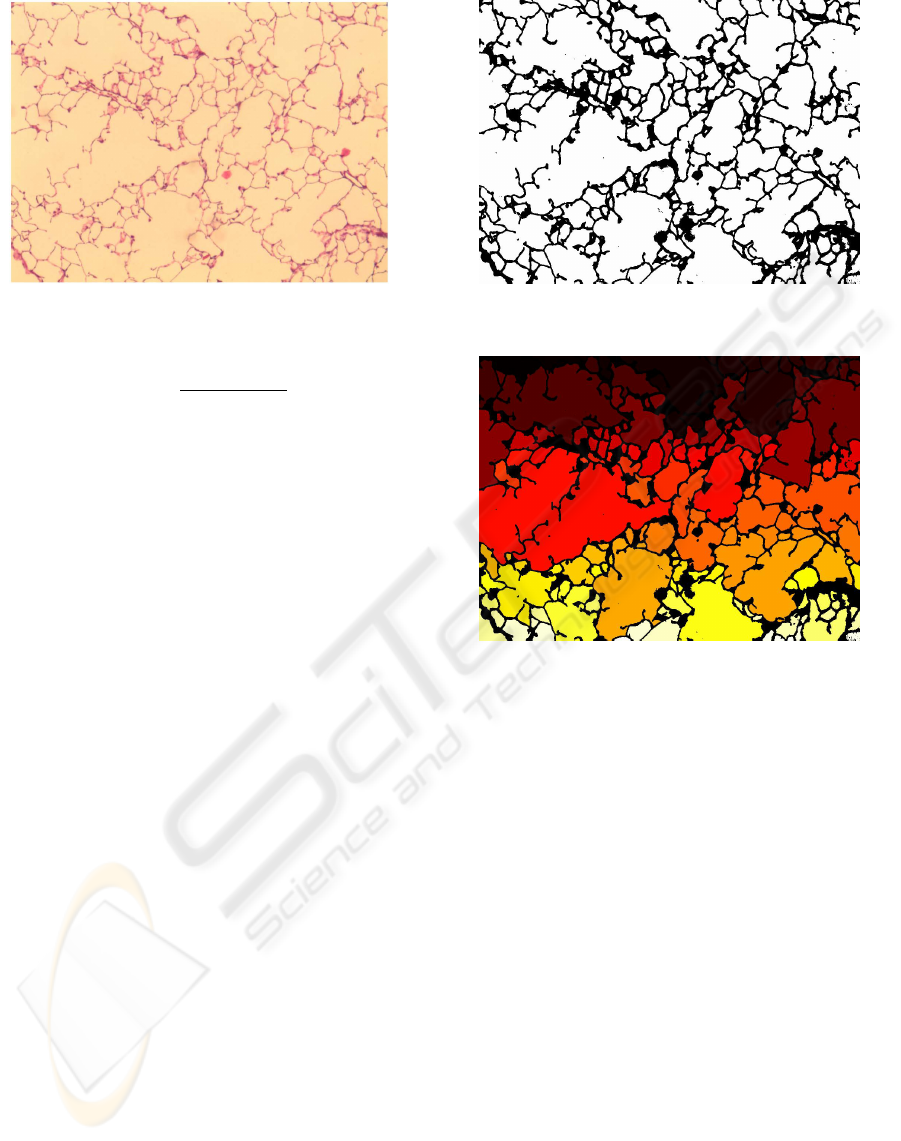
Figure 3: An image of the upper left lobe of the control 4
rat.
V = a +
b
1 +e
−(P−c)/d
(1)
Parameter c in equation 1 equals the value of the
pressure at the inflection point, which is defined as the
point where the second derivative changes sign. In the
case of the PV curves it corresponds to the maximum
compliance point (West, 2008).
The inflation limbs of the PV curves were fitted
by equation 1 by using two different error minimisa-
tion algorithms: the simplex Nelder-Mead algorithm
(Jeffrey C. Lagarias, 1998) and a genetic algorithm.
The function fminsearch of MATLAB
R
was
used with initial conditions [a,b,c,d] = [1, 15,10,3]
sufficiently close to the values of each parameter. The
termination criteria were either a final mean squared
error 10
−4
or 10000 iterations.
For the genetic algorithm 10000 genes have been
generated at each step. The fitting process in every
case was interrupted after 100 steps. The used appli-
cation has been implemented in the C programming
language.
2.4.2 Morphometry
The pictures of the lungs that have been shot as de-
scribed in section 2.2 were analysed to assess the
mean surface of the alveoli. For this purpose the pro-
gram MIPAV (Medical Image Processing, Analysis,
and Visualisation, http://mipav.cit.nih.gov) was used
and the following image analysis strategy was used:
1. entropy minimisation,
2. colour to grey-scale conversion,
3. thresholding (figure 4),
4. object extraction and object size measurement
(figure 5).
Entropy minimisation in step 1 is aiming to re-
move shading from the image (B. Likar, 2000)(Russ,
Figure 4: Image 3 thresholded.
Figure 5: The extracted objects from image 4.
2000). According to (B. Likar, 2000) most of the
shading effects of microscopy images are successfully
removed by this technique.
The corrected image was converted from RGB
(red-green-blue) format to greyscale. Each channel
contributes to the final greyscale image with the same
weight, that is 1/3 (Edward R. Dougherty, 2003).
Until this point all the images were processed
identically. The greyscale image was converted to bi-
nary (figure 4) with a different threshold for each case.
Thresholds have been chosen for each image accord-
ing to their contrast and brightness. Optimum value
has been decided each time by the user. The crite-
rion was to distinguish clearly each alveolus from its
neighbours.
To calculate the mean surface of the alveoli, first
the surface of each alveolus is measured. For this pur-
pose the function “ID objects” of MIPAV was applied
to the binary image. Its output appears in figure 5. “ID
objects” measures the number and number of pixels of
enclosed areas in the binary image. These areas cor-
respond to the alveoli. The dimensions of each pixel
are (1.28µm)
2
, therefore its surface equals 1.638 µm
2
.
PULMONARY PRESSURE-VOLUME CURVES OF ELASTASE-TREATED AND CONTROL RATS
483

The objects with size less than 130 pixels have
been considered that do not correspond to alveoli but
to artifacts of the image analysis and therefore ex-
cluded from the processed data.
3 RESULTS
The experimental results of both PV curve measure-
ments and morphometry appear in tables 3 and 4.
The mean values C and C
gen
include all the PV
curves that have been measured for each animal.
C =
1
N
N
∑
i
c
i
, (2)
where c
i
is the c parameter of equation 1 that cor-
responds to the i PV curve. N is the number of PV
curves acquired for each animal.
C
gen
corresponds to
the results of the genetic algorithm.
S is the mean alveoli surface for each animal.
The mean alveoli surface for all the control rats is
S
c
= 3911.4 µm
2
, σ(S
c
) = 1192 µm
2
. The mean alve-
oli surface for all the elastase rats is S
e
= 7438 µm
2
,
σ(
S
e
) = 3044 µm
2
.
In tables 3 and 4 the first and the third column hold
the pressure at which inflection occurs as assessed by
the simplex and the genetic algorithm respectively.
Units are mbar. Columns 2 and 4 hold the standard
deviations of the respective parameters. The last col-
umn holds the mean surface of the alveoli in µm
2
.
Tables 5 and 6 hold the mean-squared fitting error
for each experiment. Specifically, ε
1
and ε
2
equal
ε =
1
M
M
∑
j
1
N
N
∑
i
( ˆx
i
− x
i
)
2
, (3)
where x
i
is an experimentally measured value of pres-
sure, ˆx
i
is the estimated value for x
i
, N is the number
of measured points and M the number of sets of mea-
surements.
Figures 6 and 7 correspond to experiments 1 and
2 respectively. In both of them the x-axis represents
the inflection point pressure as given by the simplex
algorithm and the y-axis represents the mean alveoli
surface.
4 DISCUSSION
4.1 Number of Sets of Measurements
In experiment 1 more sets of measurements were
performed than in experiment 2, therefore more PV
Table 3: Experiment 1. C: control animal. E: elastase-
treated animal.
C/E C σ(C) C
gen
σ(C
gen
) S
C1 8.81 0.21 8.64 0.27 3866.4
C2 8.96 0.18 8.6 0.37 2052.4
C3 9.89 0.33 9.39 0.59 4723.4
C4 8.64 0.55 8.18 0.63 5153.7
C5 8.52 0.09 5.98 2.01 3760.9
E1 8.83 0.17 8.41 0.34 5750.6
E2 7.44 0.26 7.17 0.44 12773.9
E3 9.06 0.29 8.41 0.63 6256.8
E4 8.58 0.48 8.21 0.53 5396.4
E5 8.53 0.36 8.2 0.58 7012.2
Table 4: Experiment 2. C: control animal. E: elastase-
treated animal.
C/E C σ(C) C
gen
σ(C
gen
) S
C1 10.44 0.7 10.24 0.88 4556.5
C2 8.91 0.47 8.89 0.47 5063.3
C3 9.5 0.72 9.21 0.73 4040.1
E1 9.44 0.07 9.11 0.25 5502.1
E2 7.87 0.37 7.57 0.57 5921
E3 7.51 0.12 7.39 0.24 7647
E4 6.16 0.33 6.15 0.37 8943.1
E5 8.53 0.25 8.49 0.23 7610.3
E6 8.13 0.12 7.93 0.29 7576.8
E7 7.84 0.26 7.79 0.28 6020.2
curves and more data. These data appear analytically
in tables 1 and 2. The reason for this was that in the
first experiment it was sought whether the pressure of
the inflection point changes over time for the same
animal. It was observed that even though the breath-
ing behaviour of the animal may change over time,
this does not affect the inflection point. Therefore, in
the second experiment the sets of measurement were
restricted to 2 only.
4.2 Error-minimisation Algorithm
Two minimisation algorithms were used to model the
PV curves. The mean-squared error of the simplex
algorithm has always been lower than that of the ge-
netic, as it appears in tables 5 and 6.
4.3 Morphometry
The mean alveoli surface of every control rat is less
than 5153.7 µm
2
(C4). The same value for the elastase
rats is greater than 5396.4 µm
2
(E4). This means that
knowing the mean alveoli surface of a rat it can be
deduced with certainty whether it is control or treated
BIOSIGNALS 2009 - International Conference on Bio-inspired Systems and Signal Processing
484
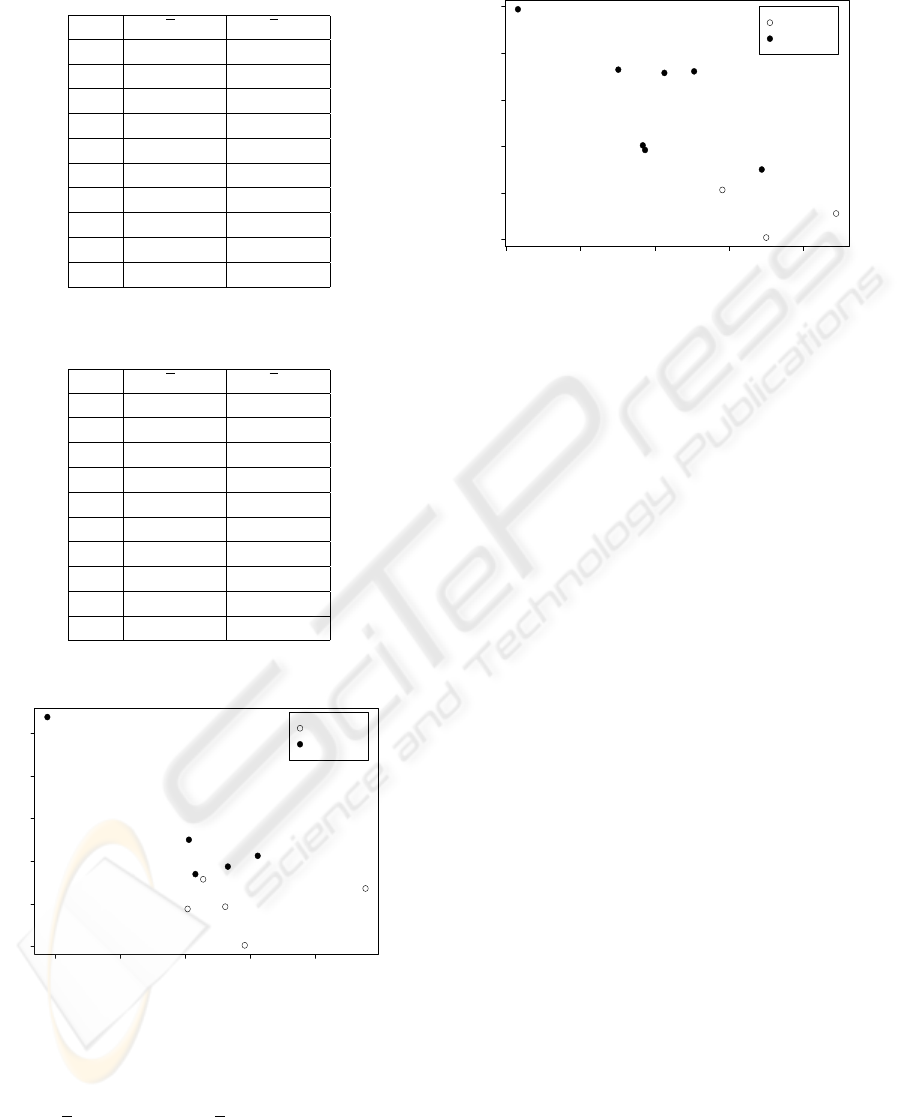
Table 5: Experiment 1. C: control animal. E: elastase-
treated animal.
C/E ε
1
ε
2
C1 1.49 10
−2
1.66 10
−2
C2 1.76 10
−2
2.38 10
−2
C3 1.4 10
−2
2.99 10
−2
C4 1.9 10
−2
2.53 10
−2
C5 1.02 10
−3
4.86 10
−3
E1 1.06 10
−2
1.41 10
−2
E2 2.57 10
−2
2.69 10
−2
E3 1.5 10
−2
2.37 10
−2
E4 3.41 10
−2
3.66 10
−2
E5 3.48 10
−1
3.5 10
−1
Table 6: Experiment 2. C: control animal. E: elastase-
treated animal.
C/E ε
1
ε
2
C1 7.46 10
−2
7.72 10
−2
C2 5.13 10
−2
5.14 10
−2
C3 7.38 10
−3
1.17 10
−2
E1 1.74 10
−2
2.37 10
−2
E2 4.17 10
−2
4.32 10
−2
E3 2.37 10
−2
2.41 10
−2
E4 3.47 10
−2
3.52 10
−2
E5 1.61 10
−1
1.62 10
−1
E6 1.43 10
−2
1.5 10
−2
E7 2.3 10
−2
2.32 10
−2
7.5 8.0 8.5 9.0 9.5
2000 4000 6000 8000 10000 12000
Experiment 1
Pressure (mb)
Surface (micrometers^2)
control
elastase
Figure 6: Inflection points pressure over mean alveoli sur-
face for elastase and control rats for experiment 1.
with elastase. The mean values of the two classes of
animals (S
c
= 3911.4 µm
2
, S
e
= 7438 µm
2
) show a
clear separation as well.
6 7 8 9 10
4000 5000 6000 7000 8000 9000
Experiment 2
Pressure (mb)
Surface (micrometers^2)
control
elastase
Figure 7: Inflection points pressure over mean alveoli sur-
face for elastase and control rats for experiment 2.
4.4 PV Curve Data
No clear connection between the inflection points and
the disease state of the animals appears. It seems that
an inflection point with pressure less than 8.5 mb (E2,
E4, E5) is an indication of disease, but the results are
not statistically significant to draw this conclusion as
secure.
4.5 Induction Methodology
In experiment 1 no ramp was used for the induction
of the disease, as it was done in experiment 2. The
morphometrical results (section 4.3) showed that even
in experiment 1 the elastase had an important effect to
the rat lungs.
5 CONCLUSIONS
The accuracy of the inflection point pressure measure-
ment is high because the pressure sensors are proven
to give accurate estimates. The volume at which the
inflection occurs is measured less accurately because
the volume indications are less accurate. For this rea-
son the inflection point volume is not mentioned.
The inflection point pressure represents the point
of maximum alveoli recruitment. It is the critical
pressure at which the lungs totally dilate to reach their
total capacity (Jose G. Venegas, 1998). After this
point the inflation of the PV curve turns its curvature
downwards and enters a relatively flat area. The posi-
tion of the inflection point is directly affected from
the mechanical properties of the lungs and specifi-
cally from its compliance. An emphysematous lung is
PULMONARY PRESSURE-VOLUME CURVES OF ELASTASE-TREATED AND CONTROL RATS
485

more compliant than a healthy lung, which means that
the same volume is achieved with less pressure (West,
2008). This means that the volume that corresponds
to the maximum recruitment point, same for subjects
of similar size, should be achieved with less pressure
for the elastase-treated animal. However, this is not
what was observed.
A reason that no difference is found between the
PV curves inflection points, which are related to the
viscoelastic properties of the lungs, could be that there
is no actual alteration in these properties. It should
be considered that either the rats have recovered in 6
weeks after the induction of elastase or that the elas-
tase, even though it destroys the alveolar walls, leaves
the elastic properties of the lungs unaffected.
To verify any of these assumptions, a long-term
study should be performed. For this purpose, the ani-
mals should not be tracheotomised and sacrificed but
intubated, so that the same rats can be measured and
their lung compliance registered over the course of
time. With intubation a pressure of 30 mbar, as was
used in this experiment, cannot be reached. In spite of
this, the inflection point of the PV curves can be still
calculated.
In a future experiment a higher inhalation time
should be tested, by increasing the airflow resis-
tance in the inspiration tube. In this way the inflec-
tion points may provide clearer classification between
normal and elastase-treated rats. For this purpose,
changes are already under development in the home-
made mechanical ventilation device.
ACKNOWLEDGEMENTS
The experiments are supported by the Marie-Curie
training network MRTN-CT-2006-03602, PHeLINet.
The experiments were performed in the facili-
ties of Boehringer Ingelheim Pharma in Biberach-an-
der-Riss, Germany. Special thanks to Detlef Stiller,
Thomas Kaulisch and Laura Carrero-Gonzalez.
REFERENCES
B. Likar, J. B. A. Maintz, M. A. V. F. P. (2000). Retrospec-
tive shading correction based on entropy minimiza-
tion. J Microsc, 197:285–295.
Edward R. Dougherty, R. A. L. (2003). Hands-on morpho-
logical image processing. Bellingham(Washington).
Jeffrey C. Lagarias, James A. Reeds, M. H. W. P. E. W.
(1998). Convergence properties of the Nelder-Mead
simplex method in low dimensions. S I A M, 9, No
1:112–148.
Jose G. Venegas, R. Scott Harris, B. A. S. (1998). A
comprehensive equation for the pulmonary pressure-
volume curve. J Appl Physiol, 84:389–395.
Joseph P. Dugas, Joel R. Garbow, D. K. K. (2004). Hyper-
polarized
3
He MRI of mouse lung. Magn Res Med,
52:1310:1317.
Lumb, A. (2005). Nunn’s applied respiratory physiology.
Elsevier/Butterworth Heinemann.
R. Peslin, M. Rotger, R. F. D. N. (1996). Assessment
of respiratory pressure-volume nonlinearity in rab-
bits during mechanical ventilation. J Appl Physiol,
80:163748.
R. Scott Harris, Dean R. Hess, J. G. V. (2000). An objec-
tive analysis of the pressure-volume curve in the acute
respiratory distress syndrome. Am J Respir Crit Care
Med, 161:432–439.
Rigoberto Perez de Alejo, Jesus Ruiz-Cabello, P. V. I. R.
J. M. P.-S. G. P.-B. M. C. (2005). A fully MRI-
compatible animal ventilator for special-gas mixing
applications. Magn Res Eng, 26B1:93–103.
Roy G. Brower, Paul N. Lanken, N. M. M. A. M. A. M. M.
A. D. S.-B. T. T. (2004). Higher versus lower positive
end-expiratory pressures in patients with the acute res-
piratory distress syndrome. N Engl J Med, 351:327–
336.
Russ, J. C. (2000). The image processing handbook. CRC
Press/Springer/IEEE Press.
Stefanida Kononov, Kelly Brewer, H. S. F. S. A. C. C. R.
S. E. P. I. B. S. (2001). Roles of mechanical forces
and collagen failure in the development of elastase-
induced emphysema. Am J Respir Crit Care Med,
164:1920–1926.
West, J. B. (2008). Respiratory physiology: the essen-
tials. Wolters Kluwer Health/Lippincott Williams &
Wilkins.
BIOSIGNALS 2009 - International Conference on Bio-inspired Systems and Signal Processing
486
