
A CONCEPTUAL DATA MODEL FOR DISEASE
SURVEILLANCE, MONITORING AND PREDICTION IN
NIGERIA
Peter Idowu, Dan Cornford and Lucy Bastin
Knowledge Engineering Group, School of Appplied Science and Engineering, Aston University
Birmingham,B4 7ET, U.K.
Keywords: Epidemiology, HIV/AIDS, Developing Countries, GIS, GML.
Abstract: Despite the fact that Sub-Saharan Africa is a region characterised by high rates of several deadly diseases,
there is relatively little consistent or reliable data that can be used for surveillance, monitoring and
management of these diseases in the region. In order to alleviate the problem of patchy and inconsistent
epidemiological data, a well structured, interoperable spatial data model for diseases surveillance and
monitoring is proposed in this paper. The model is motivated by HIV/AIDS monitoring and prediction in
Nigeria. We initially review some of the existing health data models which we modify and extend to
develop a conceptual data model for disease surveillance, monitoring, management and, potentially,
prediction. The data model captures information required for the development of diseases surveillance
systems. The model is developed using the Unified Modelling Language and we aim to make the model an
open standard in order to promote collaboration and encourage researchers in developing nations to
contribute to the maintenance of the data model. The model will be implemented in XML, and will be
applied to a system using service oriented architecture with a focus on HIV/AIDS surveillance and
monitoring in Nigeria.
1 INTRODUCTION
Currently, there are almost no easily accessible,
open data standards for disease surveillance, health
monitoring and management in developing countries.
In this paper, we describe a proposed data model for
disease surveillance, monitoring, management and
prediction for Nigeria, a country which has high
incidences of diseases such as Human
Immunodeficiency Virus/Acquired Immuno-
deficiency Syndrome (HIV/AIDS), malaria,
tuberculosis, etc. It is designed such that it can be
adopted by any country within sub-Saharan Africa.
Indeed it has the potential to be used globally.
HIV/AIDS has been a destructive epidemic and
threatens to continue to create health, social,
economic and developmental problems for
developing nations. This incurable disease is one of
the major causes of poverty in Africa, which, with
around 10% of the world’s population has over 75%
of the people living with HIV/AIDS (UNAIDS,
2004), and 72% of the world’s mortalities from
HIV/AIDS. An estimated 2.8 million Africans
became infected with HIV in 2006 alone - more than
all other regions of the world (UNAIDS, 2007).
Since the first case of HIV/AIDS in Nigeria was
reported in 1986, the prevalence rate has increased
steadily from 3.8% in 1991 to 5.8% in 2001 (Pyke
and Ali-Akpajiak, 2003) with a slight decline to
4.4% in 2007. Despite the decline, Nigeria still has
the largest HIV/AIDS epidemic in sub-Saharan
Africa. According to latest statistics on HIV/AIDS,
Nigeria, now ranks second in the world with disease
counts of over 3.0 million (UNAIDS, 2007) and
almost half a million annual deaths (Adegoke, 2008).
Some Nigerian states have a prevalence rate as high
as 10% (Federal Ministry of Health Nigeria, 2006;
Utulu & Lawoyin, 2007) but epidemiological data is
patchy and inconsistent (Lawoyin & Adewole, 2004).
Coping with recent HIV/AIDS increases in
Nigeria is consuming a large portion of the national
health budget, and threatens the health sector (FMH
and NACA, 2002). In 2000, Nigeria overall health
care system performance was ranked 187th out of
442
Idowu P., Cornford D. and Bastin L. (2009).
A CONCEPTUAL DATA MODEL FOR DISEASE SURVEILLANCE, MONITORING AND PREDICTION IN NIGERIA.
In Proceedings of the International Conference on Health Informatics, pages 442-449
DOI: 10.5220/0001538604420449
Copyright
c
SciTePress

the 191 World Health Organisation (WHO) member
states (WHO, 2000) and this shows that the Nigerian
health care system is weak. ICT facilities such as
email, Internet, and electronic surveillance systems
are vital for healthcare management and exchange of
information. ICT has been identified as the
backbone of health services to prevent, diagnose and
monitor diseases (WHO, 2004) and reduce the cost
of running hospitals (Remlex, 2007). However, there
is almost no existing ICT infrastructure in any
Nigerian hospital. The country faces a number of
obstacles in the use of ICT and its implementation in
the health sector, including an ‘epileptic’ electric
power supply, inadequate telecommunication system,
high cost of ICT equipment and the lack of reliable
Internet facilities (Idowu et al, 2008).
The control of any disease, in any country,
requires that the spatial and temporal rates and
trends of the disease must be determined. This
information will assist public health officials and
stakeholders to determine the locations and areas on
which to focus their attention (Myers et al, 2000). In
Nigeria at present, there is neither an electronic
surveillance system nor any electronic national
database for disease monitoring. As in most other
African nations, the monitoring and surveillance of
disease especially HIV/AIDS in Nigeria is limited to
biennial sentinel surveys at less than 100 sites which
focus on pregnant women between the ages 15 to 49
years attending antenatal clinics in health facilities
across the country (FMOH, 2006). The absence of a
reliable national database on HIV/AIDS compounds
the challenges facing the management of HIV/AIDS
in the country (USAID, 2002).
There is therefore a need for an effective and
efficient spatio-temporal health data model which
can be used as a guide for the systematic capture of
health related data, to provide the impetus for the
development of a national database that can be used
in the monitoring and management of disease,
especially HIV/AIDS in Nigeria. This is the focus of
this paper.
2 SCOPE OF DATA MODEL
A central requirement within any disease
surveillance system is the effective management of
patient information, diseases and location, for which
a good data model is imperative in order to capture
useful information. The immediate scope of the data
model is to:
• identify different types of information needed
for disease surveillance activities and the
corresponding entities
• represent and document the information
required for disease surveillance activities and
entities
• develop a formal Unified Modelling Language
(UML) description to show the relationship and
association between the entities
• provide enhanced support for flexible spatial
and spatio-temporal data
The future scope is to develop a disease surveillance
database system from the data model that will allow
easy query of pattern and distribution of diseases
based on geographical location such as city/town,
local government area and states and to make the
model open standard so as to encourage other
researchers to contribute, use, modify and extend the
system in order to have a standard disease
surveillance model for sub-Saharan Africa.
To achieve the immediate intention of the model,
we hope to build on existing data models that are
relevant to diseases surveillance and introduce
enhanced spatial support into the model. The model
is developed in UML, with the intention to automate
the generation of the XML schema, allowing easier
maintenance of the data model. An interesting issue
is the governance model for the data model. In the
Geospatial domain a strong governance mechanism
is provided by the Open Geospatial Consortium,
however in the health field it is less clear.
3 REVIEW OF EXISTING DATA
MODELS
A data model may be defined as a formal structured
representation of real world entities, focused on the
definition of an object and its associated attributes
(BIS, 2004). There are a number of existing health
data models such as EHR (Electronic Health
Record) and openEHR (Open Electronic Health
Record), DICOM (Digital Imaging and
Communication in Medicine); and Health Level 7
(HL7). Some of the models however, are not without
problems: both EHR and open EHR are still not
fully developed though EHR has made a significant
contribution to health data models by introducing
archetypes. DICOM, though fully developed,
focuses on medical imaging which is out of context
of the proposed data model. HL7 is also fully
developed and widely used by many vendors. HL7 is
an extensive, comprehensive data model that focuses
on general health care system, with a unique
specification of messages between health care
A CONCEPTUAL DATA MODEL FOR DISEASE SURVEILLANCE, MONITORING AND PREDICTION IN
NIGERIA
443

application systems. The HL7 messaging protocol is
widely adopted and implemented by several health
data models. Several health data models have built
parts of their model on HL7 not only because of the
messaging protocol, but because it is a widely
recognised and supported standard and many
commercial software vendors actively orient their
product development efforts to this model. In
addition, most international health data model
development organisations are using HL7 to
harmonize their standards effort. Two particularly
relevant data models built on HL7 are the Public
Health Conceptual Data Model and the Canadian
Conceptual Health Data Model which are reviewed
in the following section.
3.1 Summary of Existing Health Data
Models
In this section we present a summary of our review
based on scope, strengths and limitations of the most
relevant data models. The Public Health Conceptual
Data Model (PHCDM) focuses on data needs for
public health at all levels generally, while Canadian
Conceptual Data Model (CHDM) focuses on data
concepts that must be captured to meet the needs of
key stakeholders in the Canadian health system. The
two models develop conceptual models to
encapsulate the data needs of the health activities
they represent. PHCDM aims to develop a high level
process model that can be used in public health
while the CHDM aims to develop a process to
maintain and refine the Canadian model in order to
influence international health data models.
The two models support interoperability but
neither of the models is an open standard. CHDM
incorporates governance data which allows the
building of mechanisms to support accountability for
the use of data and for the processes that use the data.
CHDM does not include relationships and
associations between the entities in the model nor
does the specification discuss details of the attributes
of the classes that make up the data model, in
contrast to the PHCDM. The major inadequacy in
the two models, with respect to our requirements is
lack of formal support for spatial features. The major
contribution of this proposed model to existing
health data models is to provide a more structured
representation of the spatio-temporal aspects of
health data. We adopted, modified and extended the
PHCDM because it is more relevant to our proposed
model and focuses on public health systems and
diseases surveillance.
3.2 Geography Markup Language
Geography Mark-up Language (GML) is an XML
based language used to describe spatial and spatio-
temporal objects (Lake et al, 2004). GML is an
Open Geospatial Consortium (OGC) specification
that defines an XML encoding for geographic
information. GML is an international standard
designed to represent common spatial features and
describe spatial objects (including their geometry),
map projections, topology, time, etc (OGC, 2007).
It uses XML schema to define the geometry
elements needed to encode the geographic features.
GML is used to allow the interoperable exchange
of geographic data. It is mostly used in web feature
services as a mechanism for interaction with a
geospatial database (that is to send features between
servers and clients). In this work we employ GML to
provide the spatial embedding of the data. The use
of GML facilitates easy use of the data in a GIS
system, making the data more easily interoperable
with existing web GIS models. We note that in this
work we do not propose our model as a GML
application schema, since the primary issue we wish
to capture in the model is the health data, however it
seems likely that such an application schema would
have a potentially large impact, and allow much
easier interoperability with existing GIS systems.
The existing data model would require quite
significant revision to formulate as a GML
application schema.
4 THE PROPOSED MODEL
A conceptual data model gives the representation of
the real world phenomena in the context of a
database. The conceptual data model is designed to
describe relevant features and attributes of the
information, the methods from the user perspective
that will be stored in the database. The success of
any information system based project depends on
efficiency and effectiveness of conceptual data
model. There are different approaches that can be
used in developing conceptual data model including
semantic, entity relationship, and object oriented
approaches. In our model, we use an object oriented
approach encoding entities and relationships in the
domain. The main advantage of an object oriented
approach is that it allows representation and
definition of objects which provides a clearer
understanding of the conceptual data model. It also
allows easy representation of spatial information.
The formal language of the object oriented design is
HEALTHINF 2009 - International Conference on Health Informatics
444
typically UML (Hay, 1999).
4.1 Modelling using UML
UML is a standard, graphical language for object
modeling. UML is a general-purpose tool and
industry standard modelling language for specifying,
visualizing and documenting the artifacts of a
system intensive process. It offers standard methods
to create data models, database schemas, and
reusable software components amongst other things.
UML is used to develop the proposed data model for
diseases surveillance and monitoring in Nigeria.
4.2 Core Components
This model comprises of a number of classes and the
classes are grouped into three core components or
subject areas namely party, location and health
activity. These core components deal with health
activities, parties that are involved in the health
activities and the location where the parties reside
and health activity takes place. The core components
of the model are discussed below.
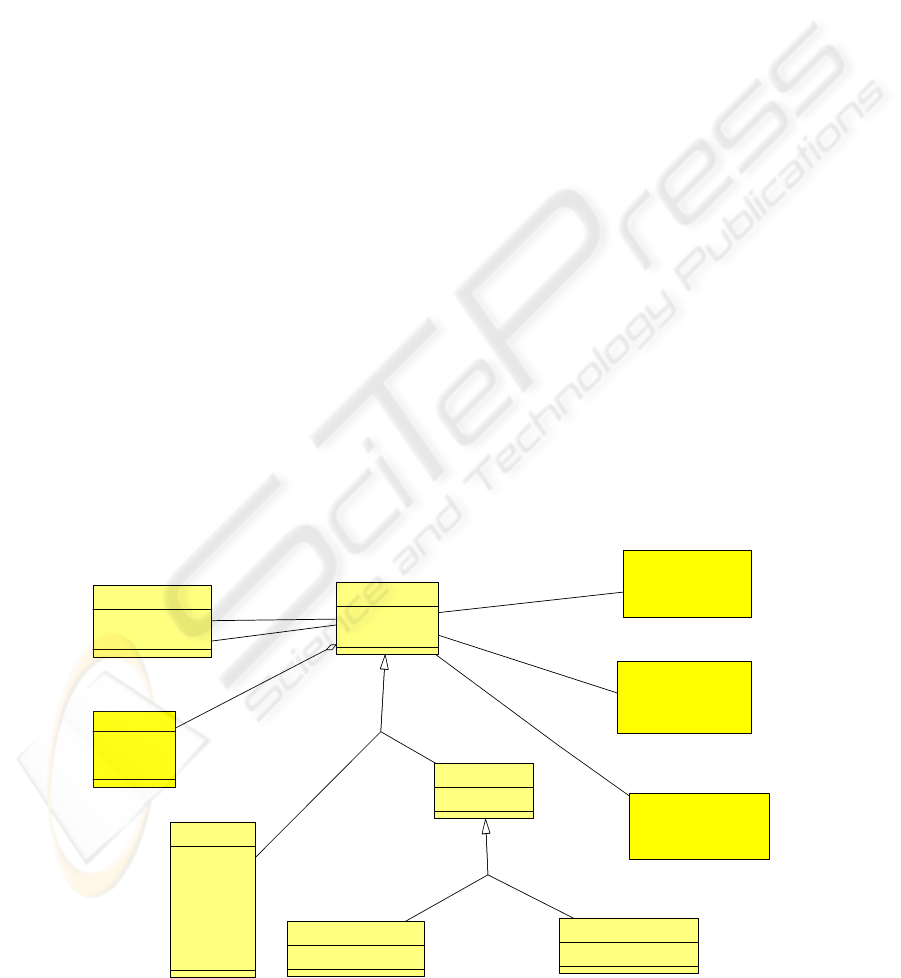
4.2.1 Party
This contains information about a person, groups
and any features that are of interest to the health
system. Examples of parties include physicians,
epidemiologists, public health workers, hospitals,
laboratories, patients, association of laboratory
scientists, people living with HIV/AIDS. All these
interact within the health system. The party
component of the model also captures information
about relationship within the parties. For example,
physicians employed in a particular hospital,
laboratory scientists in a particular hospital receiving
treatment in another hospital or the same hospital or
group of sex workers being counsel by public health
officers. It may also represent public health workers
telling people in a particular location how to prevent
disease in their locality. The classes that form the
party component of the model are shown in Figure 1.
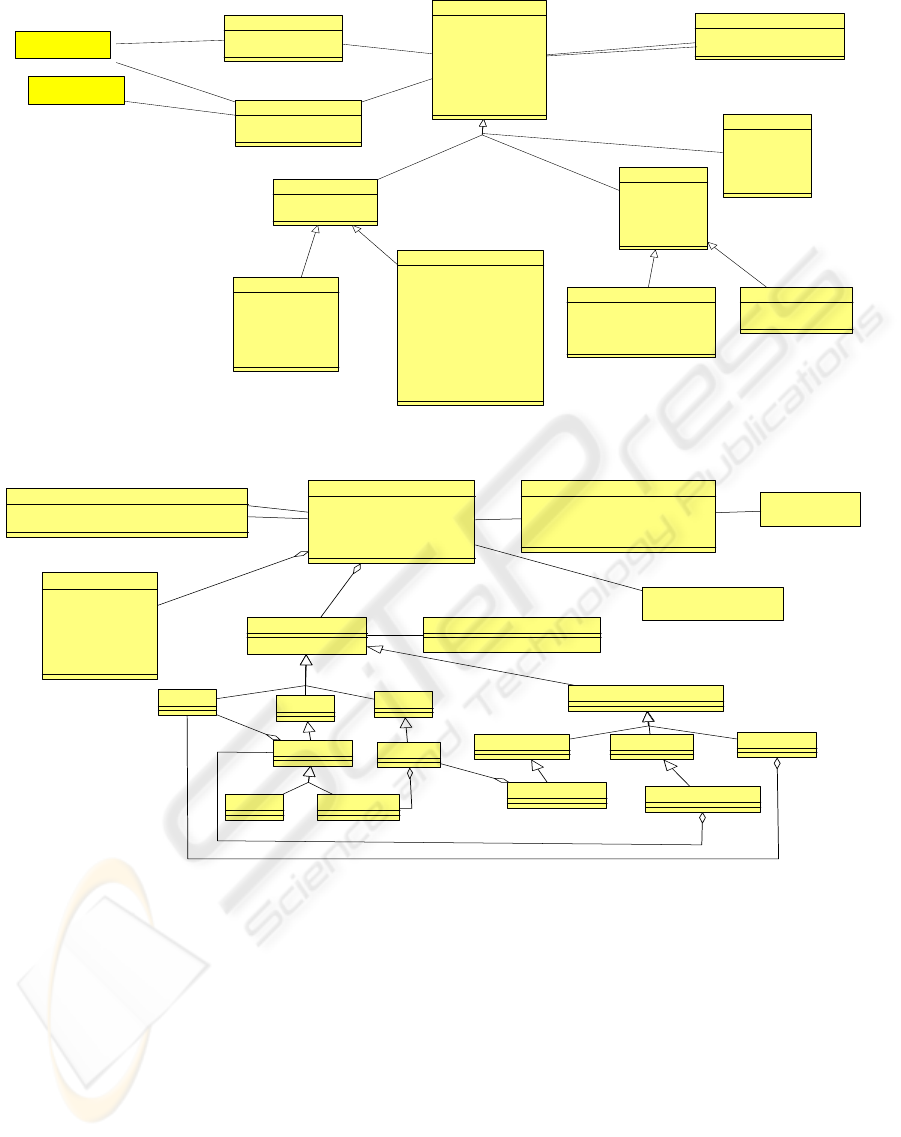
4.2.2 Health Activity
A health activity is the provision of a specific health
service to a health service recipient by a service
provider at a given place during a particular period
of time. It often intends to affect, or report on, the
health of a person or group. A health activity
component contains information about all the
activities that occur between patient and health
provider. The core health activities in this data
model include observation, diagnosis, laboratory test,
treatment, (which may result in admission or
referral) and intervention. For example, it can
capture information on how a patient is diagnosed
by a physician with a blood or urine sample.
Intervention which is a means of preventing diseases
or providing care is also part of the model.
Intervention includes educational and media
campaigns about the spread of diseases and how to
prevent this. For example, the distribution of
_Party
+PartyID
+PartyDescription
Person
+OccupationCode
+RaceCode
+EthnicityCode
+EducLevelCode
+GenderCode
+BirthDate
+DeathDate
_Group
+OrganizationName
Informal Group
+GroupCode
Formal Group
+IndustryCode
PartyRelationship
+RelationshipDTime
+RelationshipType
0..*
1
0..*
1
1
0..*
ActorParticipation
+ActorType
+ActorTimeRange
1
0..*
TargetP articipation
+TargetType
+TargetTimeRange
0..1
0..*
ActorParticipation
(from Health Activity)
TargetParticipation
(from Health Activity)
PartyLocationParticipation
(from Location)
Contact Details
+E-MailAddr
+Telephone
+Website
0..1
Figure 1: The party component of the data model. Classes begin with an underscore represent abstract classes.
A CONCEPTUAL DATA MODEL FOR DISEASE SURVEILLANCE, MONITORING AND PREDICTION IN
NIGERIA
445
_Health Activity
+ActCriticalTime
+ActTime
+ActId
+ActDescription
+ActStatus
+ActMethod
+ActType
+Confidentiality
Diagnosis
+PhysicianId
+PhysicianName
+DiaRoomNo
+DiaStatusCode
+DiseaseTypeCode
+DetectMethodCode
+TransMethodCode
+DiseaseImportCode
+DiseaseStatus
+DiseaseConfirmDTime
+Comment
LaboratoryTest
+PhysicianId
+TypeofTest
+TestResult
+RequestDTime
+ResultDTime
+Description
Treatment
+DrugDispense
+Quantity
+Procedure
+Counselling
+DTime
Intervention
+IntervCode
+IntervQty
+IntervReason
+IntervStrength
+IntervDTime
Admission
+AccCode
+LengthOfStay
+PatientStatus
+DeathDischargedDTime
Referral
+ReferalCode
+ReferalDescriptn
_Observation
+DTime
+ObservationCode
ActorParticipation
+ActorType
+ActorTimeRange
1
0..*
1
0..*
TargetParticipation
+TargetType
+TargetTimeRange
1
0..*
0..1
0..*
ActivityRelationship
+ActivityRelationshipType
+ActiityRelationshipTime
0..*
1
0..*
1
0..1
0..*
Party
(from Party)
Location
(from Location)
Figure 2: The health activity component of the data model.
_gml:Geometry SpatialReferenceSystem
Point
Surface
Curve
_GeometryCollection
LineString
Line LinearRing
MultiSurface MultiCurve
MultiPoint
MultiPolygon
MultiLineString
1..*
-2..*
*
Polygon
1..*
1..*
1..*
Location
+LocationId
+LocationCode
+LocationType
+LocationGranularityCode
+LocationDescriptn
Address
+HouseNo
+StreetName
+CityTown
+PostalCode
+LGA
+State
+Country
0..1
1..*
LocationRelationship
+LocationRelationshipTypeCode
+LocationRelationshipDateTimeRange
PartyLocationParticipation
+ParticipationDateTimeRange
+PartcipationTypeCode
+CurrentStatusCode
+CurrentStatusEffectiveDate
Party
(from Party)
TargetParticipation
(from Health Activity)
1
0..*
1
0..*
1
0..*
1
0..*
0..*
0..1
Figure 3: The location component of the data model.
condoms by public health workers or diseases
agencies among some groups of people (such as sex
workers, bus drivers, etc) and encouraging them to
avoid unprotected sex can be represented as a health
activity.
4.2.3 Location
The location component contains information about
the addresses and spatial positions associated with
the other two core components (Party and Health
Activity). Figure 3 below shows different types of
geometry that can be used to represent location in
the model. Location may be used to represent the
position of a range of parties and activities including,
for example, hospitals, buildings, cities, or local
government areas where patients reside. Address
(which contains information such as House No,
Street Name, City/Town, Postal Code, logical
government area, etc) and geometry are aggregated
to location. Geometry is represented using the GML
abstract geometry base element, which is
substitutable for a wide range of geometry types and
will allow easy query of diseases based on
geographical location.
HEALTHINF 2009 - International Conference on Health Informatics
446

4.3 Structure Of The Model
In our proposed model, we adopt, modify and extend
PHCDM as it is applicable to the need of diseases
surveillance in order to represent the data needs of
diseases surveillance.
Figure 1 above depicts party component which
provides information about data required in party
component. Party component contains information
about person and group. In order to provide useful
information for the database designer, it is important
to provide information about what to be stored
within the party component. Party components store
information about persons, groups, and, contact
details. A person include patient, physician, diseases
agent and person may be a member of more than one
group without necessarily knowing. For example, a
physician that just contacted AIDS and contact
details are aggregated to party in order to provide
more information about the parties such as website
address, e-mail address and telephone number.
Patients, physicians, hospitals, group of people may
have website that provide more information about
them and or their interest, for example National
Agency for the Control of AIDS in Nigeria
(www.naca.gov.ng).
The group party represents formal and informal
organization; it is formal when the group has an
administrative and functional structure with
common objectives such as Association of
Midwives, Nigeria Association of Resident Doctors.
It is informal group when the group is casual such as
group of sex workers.
In health activity of our model, classes like
notification or outbreak are not included as in
PHCDM because the model aims to be used by
diseases agent to query the pattern and distribution
of a particular disease based on spatial location and
other demographic data. So, there is no need to
notify any party about any disease, the stakeholder
will fetch necessary data about any disease from
database. Diagnosis, laboratory report and treatment
are included in our model since we focus on diseases
surveillance and it will assist the stakeholders to
know the type of disease that is prevalent in a
particular location, at a particular period of time. For
example, a particular location may be prone to a
particular disease in a particular time of the year
such as case of malaria during raining session.
Location is an important component in any
disease surveillance system because the occurrence
of any diseases will be based on location and the
stakeholders will query the diseases surveillance
database based on location so as to know the pattern
and distribution of any diseases and where
intervention is needed. Location component of this
model is unique as shown in Figure 3 compared with
location in PHCDM or any other health data models
because a spatial feature is included and aggregated
to location.
In order to show the relationship between the
three core classes or components, we use class
relationship methods so as to give clear
understanding of the model and the methods are
super class/sub class relationship, relationship
association and participation association.
Super class is a class from which other classes
are derived. It is also known as parent class and sub
class inherit from super class. The three core
components in the model have super class and the
sub class associated with them. The relationship
association is used in the model to show the
relationship between the super class and the sub
class. The symbols 1, 0..1 and 0..* on the association
line shows the multiplicity of the association
between the main class and relationship class. A
single health activity may be associated with zero or
more activity relationship relating it to another
health activity. For example diagnosis of chronic
typhoid fever in a particular patient may lead to
admission of such patient.
The participation association is used to show the
relationship between the main classes. Each of the
main classes has a many to many relationship to
other main classes and each of the class has
attributes that describe data items that can be
collected for a given class in the model. For example
roles play by physician in diagnosis HIV/AIDS and
role play by public health workers in distribution of
condom.
In the model, we use party relationship, actor
participation, target participation, party location
participation, activity relationship, and location
relationship to describe relationship between the
components.
Party relationship gives information about the
relationship that exists between parties in the health
activity. Example of party relationship includes a
relationship between health worker and patient,
health organization and a particular community,
disease agency and people living with a particular
disease such as relationship between National
Agency for the Control of AIDS (NACA) and
Network of People Living With AIDS in Nigeria
(NEPWHAN).
Actor participation is the major roles played by a
party in health activity. Examples include roles
played by a physician in order to diagnose a
A CONCEPTUAL DATA MODEL FOR DISEASE SURVEILLANCE, MONITORING AND PREDICTION IN
NIGERIA
447

particular disease, or role played by NACA to
distribute condom to hotels in Nigeria. Target
participation on the other hand is the minor roles
played by a party in health activity. For example, if a
person identified as a potential carrier of a disease
(which is a target) is unable to speak or express
himself/herself to a physician probably because of
language barrier, or the intensity of the illness or is
an infant, the person that speak for the potential
carrier (may be interpreter, parent or relative) is an
activity target.
Party location participation shows the
relationship between a location and a party. For
example, a hospital may have different health
facilities such as laboratories, consultation room,
female ward, etc. It may also be diseases agency that
have offices in all the states within the country. The
participation role would be that of the disease
agency that have office at a particular location.
Activity relationship is the relationship between
health activities, for example relationship between
observation and diagnosis, relationship between
diagnosis and treatment. Location relationship deals
with the relationship that exists between locations
and this relationship is important in diseases
surveillance. For example, relationship between
ward and operation room, or relationship between X
ray room and consultation room.
In addition, the model makes use of codes in
order to allow extensibility and flexibility. Codes are
alternative to using free text to describe an attribute
or features of a class. The use of code facilitates data
validation by the system when entered by the users.
Codes are used to allow each of the classes to be
more useful by allowing the class to have type codes
instead of defining new class for minor differences
in the properties of party, health activity or location.
4.4 Model Discussion
The purpose of this model is to document the
information needs of an information system for
effective diseases surveillance, monitoring,
management and prediction.
In the location component of this data model of
which we are aware that explicitly supports
geometry which is represented using the widely
accepted, open GML standard. The GML
representation of the hospitals and party features
allows different geometries such as points, curves,
surfaces and geometry collections which provides
flexibility of encoding.
With GML, user can query a point of interest on
a map in order to ascertain the pattern and
distribution of HIV/AIDS in the vicinity of that
location. A Web Feature Server could also be used
query to fetch the name of locations which has more
than certain prevalent rate for a particular disease,
for example, to fetch the name of state(s) with more
than 5% prevalent rate for HIV/AIDS.
This proposed data model will aid in capturing
comprehensive information about diseases, carriers
of the disease and their location. The model will
assist in developing an understanding of the basic
data required within the health care system in order
to build disease surveillance systems to aid effective
management, monitoring and surveillance of
diseases. It will assist the country to have a good and
reliable epidemiological data and increase the
efficiency of health record unit and this will help the
health policy maker in making favourable health
policies and decision. The model in future may give
birth to electronic health record which will
eventually increase the confidentiality and security
of health record.
This data model will be used to develop a
prototype system which aims to allow users to
spatially query and view data on any diseases in
order to ascertain the patterns, distribution and
prevalent rate of any disease such as HIV/AIDS,
malaria, tuberculosis, etc in any location in Nigeria.
When the system is developed, users will be able to
click on particular point or select a polygon on the
map and the features of the point or polygon such as
the name of the state(s), population at risk and
prevalence rates will be displayed. The prototype
will use aggregated data and focus on HIV/AIDS
because it is only aggregated HIV/AIDS data based
on state level that is currently available for this
research.
It is hoped that in the future when the diseases
surveillance system is fully developed, the
physicians in the hospitals will input patient
information such as demographic data, diseases
associated with each patient and information about
geographical location of each patient into the system
so that epidemiologists, disease agents, policy
makers, and any other authorised users will be able
to query, analyse, view, predict and generate
diseases information based on street, town/city, local
government area, year, population at risk, total
number of cases, prevalence rate, sex, marital status,
educational status and age distribution of disease
carriers in the country.
This system will hopefully aid effective and
efficient intervention in outbreaks of any disease,
which eventually will improve the population health
and reduce the expense on health service provision.
HEALTHINF 2009 - International Conference on Health Informatics
448

This will also reduce poverty, which has
characterised the sub-Saharan Africa region. Also,
the system will serve as a means to regularly publish
the patterns and distributions of diseases such as
HIV/AIDS, malaria, etc down to street, town/city,
local government, and state levels and produce
weekly, monthly, bi annual and annual reports as the
case may be on any disease for the use of
researchers, policy makers and stakeholders in hard
copy and on the Internet as against the report which
is published every two years and which only focuses
on sentinel survey in selected centres across the
country.
The process of developing the prototype will be
completely based on open standards, and the future
diseases surveillance system is aimed to be fully
open standard, and open source, so that researchers
and anyone interested in developing, using and
evaluating the system will be able to do so at
minimal cost.
5 CONCLUSIONS
This conceptual data model will aid the development
of national database which can be used in
management, monitoring and surveillance of
diseases in Nigeria. The model constitutes a basic
pattern for the design of database structure for
disease surveillance that can be queried easily. The
physical implementation of the data model using
postgreSQL will be discussed in the future.
We hope that the proposed model will form the
basis for the collaboration among researchers
interested in developing health standards for
developing nations and serve as a guide for
development of a standard health data model,
diseases surveillance system, and electronic health
record in Nigeria and sub-Saharan Africa as a whole.
ACKNOWLEDGEMENTS
We hereby acknowledge the referees, Iyinoluwa,
Titilope, Iyinoluwa and Commonwealth Scholarship
Commission
REFERENCES
Adegoke, R., 2008. HIV/AIDS Killed 400,000 in 2007.
Nigeria Tribune (online), Available from http://
www.tribune.com.ng/22042008/news/news10.html
(Accessed 22 April, 2008)
Business Intelligence Solution, 2004. Data Model, Data
Standards and XML, January 2004. Available from
http://www.knowledge-integrity.com/columns/bi2004
01.htm, (Accessed on June 12, 2008).
Federal Ministry of Health Nigeria, 2006. The 2005
National HIV seroprevalence sentinel survey among
pregnant women attending antenatal clinics in Nigeria:
summary position paper, Abuja.
FMH and NACA, 2002. HIV/AIDS: What it means for
Nigeria (Background, Projections, Impact, Interventions,
and Policy) 1
st
Edition.
Hay. David C. 1999., A Comparison of Data Modelling
Techniques, Essential Strategies, Inc
Idowu, P. Cornford D. and Bastin L., 2008. Health
Informatics Deployment in Nigeria. Journal of Health
Informatics in developing Countries, 2(1) p.20-21.
Lawoyin T., and Adewole D., 2004. Predictors of maternal
HIV/infection at the primary care level in inner city
Ibadan. International Journal of STD and AIDS, 15(3)
p.165-168
Myers M. F., Rogers, D. J., Cox J., Flahault A. and Hay S.
I. 2000. Forecasting Diseases Risk for Increased
Epidemic Preparedness in Public Health. Advances in
Parasitology 47 p. 309-330
Open Geospatial Consortium (2007): OpensGIS,
Geography Markup Language (GML) Encoding Standard.
Available from http://portal.opengeospatial.org/mo-
dules/admin/license_agreement.php?suppress Headers
=0&access_license_id=3&target=http://portal. Open
geospatial.org/files/index.php?artifact_id=20509
(Accessed June 12, 2008)
Pyke T. and Ali-Akpajiak S., 2003. Measuring Poverty in
Nigeria, Oxfam, Oxfam Working Papers.
Remlex 0., 2007. Information and Communication
Technology in chronic diseases care. Medical Care
Research and Review, 64(2) p 123-147.
UNAIDS 2004. Report on the Global AIDS Epidemic.
Geneva.
UNAIDS 2007. AIDS Epidemic Update: December 2007.
UNAIDS/07.27E/JC1322E, Geneva.
USAIDS, 2002. HIV/AIDS in Nigeria: A USAIDS brief.
Available from http://www.aegis.com/files/ syner-
gyaids/nigeria.pdf (Accessed 7 June 2008)
Utulu S, and Lawoyin T., 2007. Epidemiological features
of HIV infection among pregnant women in Makurdi,
Benue State, Nigeria. Journal of Biosocial Science,
39(3), p.297-408.
WHO, 2000. World Health Report Geneva.
WHO, 2004. eHealth for health-care Delivery: Strategy 2-
004-2007. Geneva. Available from http://www.
who.int/eht/en/Backbone.pdf (Accessed 7 June, 2008)
A CONCEPTUAL DATA MODEL FOR DISEASE SURVEILLANCE, MONITORING AND PREDICTION IN
NIGERIA
449
