
OPTIMIZATION OF EMG-SIGNAL SOURCE CLASSIFICATION
BASED ON ADAPTIVE WAVELETS K-MEAN ALGORITHM
Abbas K. Abbas
1
, Rasha Bassam
2
and Rana M. Kasim
3
1,3
Biomedical Engineering Dept. RWTH Aachen University, Germany
2
Biomedical Engineering Dept. Aachen University of Applied Sciences, Germany
Keywords: EMG decomposition, Spike overlapping, Wavelet coefficient, MUAP’s clustering, Firing spikes.
Abstract: In this paper the optimization of EMG signals segmentation and decomposition based on wavelet represen-
tation and k-mean clustering technique is presented. It is shown that wavelet decomposition can be usefull
in detecting particular spikes in EMG signals and the presented segmentation algorithm may be useful for
the detection of active segments in related MUAP’s action potentials. The algorithms has been tested on the
synthetic model signal and on real signals recorded with intramuscular multi-point electrode. The efficiency
of EMG signal decomposition and classification with adaptive wavelet algorithm were presented. Single
and multiple fibers MUAP patterns were tested and identified. By applying a Debauchies wavelet transfor-
mation and k-mean clustering algorithm to localize the action-potential source in the presence of specific
neuromuscular diseases like NMI neuropathy, muscular dystrophy and myasthenia gravis (MG), instead of
many decomposition and pattern recognition algorithm, wavelets and k-mean clustering have its flexibility
for robustly classify and localize the signal stochastic sources with a linear way, in addition to identify the
blind source for EMG bioelectric potential.
1 INTRODUCTION
Electromyography (EMG) signals classification and
processing can be used for varieties of clini-
cal/biomedical applications, spectral pattern classifi-
cation of intensity-based analysis, and modern hu-
man computer interaction. EMG signals acquired
from muscles require advanced methods for detec-
tion, decomposition, processing, and classification.
The resolution of a composite EMG signal into its
significant, constituent MUAPTs requires the ability
to detect the discharges (i.e., MUAPs) of the MUs
significantly correlating to the composite signal and
to correctly combine each detected MUAP with the
MU that generated it. EMG signal decomposition
therefore involves the two basic steps of detecting
MUAPs and recognizing detected MUAPs. To iden-
tify the occurrences of consecutive MUAP’s poten-
tial signal a parallel electrode should be placed in the
path of depolarization waveform, for recording such
activities, which considered as a vital point in
MUAP’s acquisition technique (D. Zazula, 1999).
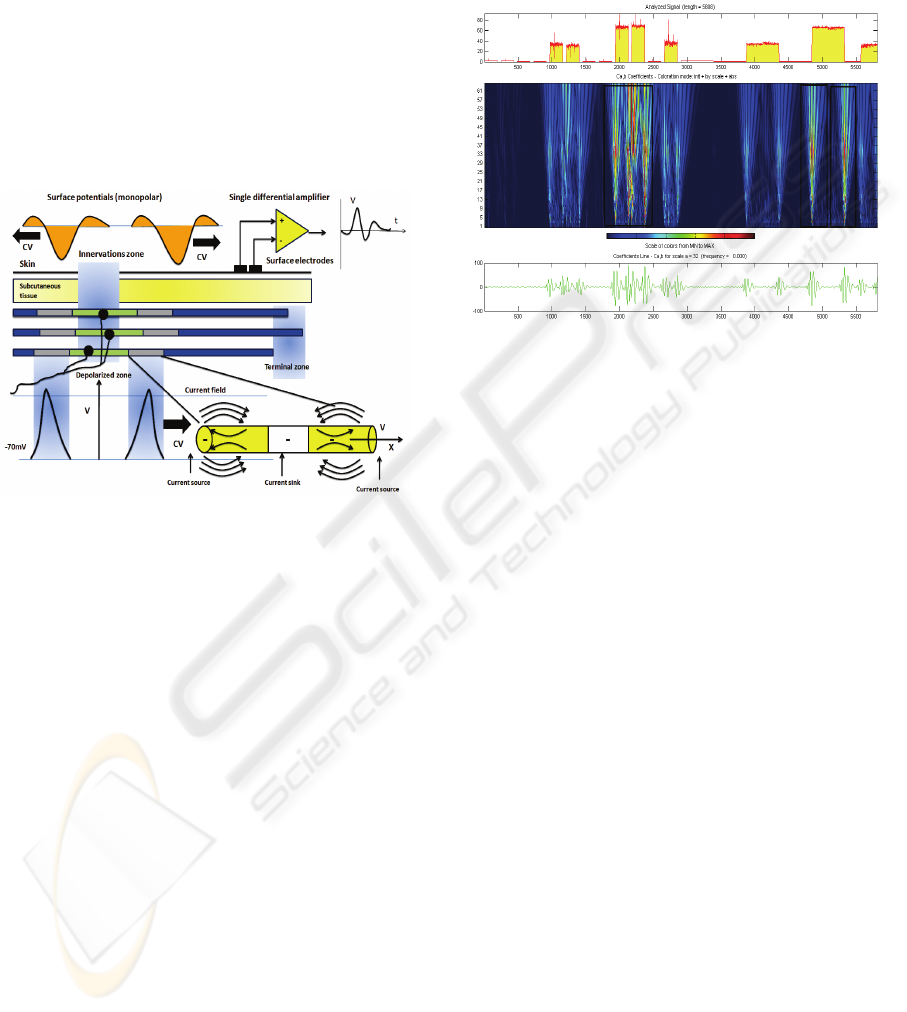
The basic steps of intramuscular EMG signal acqui-
sition was illustrated in fig.1 were the recording
electrode detecting spontaneous electrical activity of
different myofibers on the basis of three electrical
wave propagation zones (1) innervations zone ,(2)
depolarization zone and (3) terminal zone. These
will accumulatively constructing the different pat-
tern of EMG signals. The definition of MUAP’s
potential of this scheme, were the spontaneous elec-
trical activity to be recoded can be observed in real
time synchronous EMG signal recording technique
(Wang et. al, 1997). Adaptive signal decomposition
technique have a principal rule in defining elementa-
ry methods for EMG signals classification and
processing, which can be used for varieties of clini-
cal/biomedical applications, spectral pattern classifi-
cation of intensity-based development, and modern
human computer interaction. The purpose of this
paper is to illustrate the various methodologies and
algorithms for EMG signal pattern classification
based on wavelet signal decomposition to provide
efficient and effective ways of understanding the
signal and its physiological nature.
2 MATERIALS AND METHODS
EMG signal recorded using Delsys
®
system for
recording surface (sEMG) and needle EMG with
sensitivity between (0.2-10 uV). The suspected area
of disorder is identified for EMG recording, for
example, the biceps brachii in the upper arm. The
491
K. Abbas A., Bassam R. and M. Kasim R. (2009).
OPTIMIZATION OF EMG-SIGNAL SOURCE CLASSIFICATION BASED ON ADAPTIVE WAVELETS K-MEAN ALGORITHM.
In Proceedings of the International Conference on Bio-inspired Systems and Signal Processing, pages 491-497
DOI: 10.5220/0001542804910497
Copyright
c
SciTePress
EMG is then triggered to record for a predetermined
time after which the acquired signal is differentially
amplified, band pass filtered, and digitized. The
common feature for classifying intramuscular EMG
signal is the Euclidean distance between the MUAP
waveforms. For clinical interests, the main feature of
EMG signal is the number of active motor unit
(MUs), the MUAP waveforms, and the innervations
time statistics. According to De Luca method (D.
Zazula, 1999), the determination of the MUAP
waveform and the number of active MUs can be
considered as a classification problem, and for fur-
ther analysis of EMG signals
(Wang et. al, 1997;
Thompson et. al, 1996).
Figure 1: Intramuscular EMG signal acquisition with
typical MUAP action potential (Wang et. al, 1997).
The representation of time-triggered and no overlap-
ping MUAPs produce a shimmer. MUAP shimmer
is influenced by the time-offset of the sampled
waveforms, local fluctuation of the baseline and
background noise. Besides background noise and the
effects of signal offset, white noise influences the
classification. The classification with wavelet coef-
ficient needs the wavelet coefficient (Ff[m,n]) of
four frequency bands (m=2, 3, 4, 5) and not below
150 Hz. Classification performance depends also on
distance between the class means, therefore, the best
selection of these four frequency bands depends on
the Fourier transform of the MUAP waveforms
themselves. Boualem (Wang et. al, 1997) theorized
that the time frequency representation of wavelets
decomposition (WVD) provided high-resolution
signal characterization in time-frequency space and
good noise rejection performance as fig.2 illustrated
the continuous wavelet transformation for the EMG
signals using a Db-WT. This theory is useful for
EMG signal classification. For purpose of classify-
ing EMG patterns, EMG electrical model is used in
combination with wavelet decomposition by ex-
tracted and compared two types of features based on
signal processing for the purpose of classifying
EMG patterns. The two features were the coeffi-
cients of EMG signal the components of Fourier
frequency spectra. The method showed better results
while describing the EMG linear envelopes (LE)
method (McKeown et. al, 2002).
Figure 2: EMG wavelets transformation for single MUAP
using Db WT (McKeown et. al, 2002).
3 EMG PROCESSING METHOD
The complexity of a detected EMG signal and the
ease with which it can be decomposed depend on the
type of electrode, electrode positioning, profile of
muscle contraction, and muscle selected. The elec-
trode should be positioned so that it is close to active
muscle fibers and detects MUAPs of maximum
amplitude and sharpness in order to maximize the
relative differences in the distances between the
fibers of different MUs and the electrode surface.
MUAPs distinct from the background noise can be
detected in this way. The suggested procedure is to
initially position the electrode in a minimally con-
tracting muscle to detect MUAPs of maximum am-
plitude and sharpness, and then to increase muscle
contraction as isometrically as possible and initiate
data acquisition once the contraction is at the desired
level. If the decomposition system can process sig-
nals acquired during force-changing contractions,
data acquisition should start immediately after
needle positioning (McKeown et. al, 2002; M. J.
McKeown, 2002).
4 MUAPS VOLTAGE
DETECTION
AND RESOLUTION
Complete EMG signal decomposition requires the
BIOSIGNALS 2009 - International Conference on Bio-inspired Systems and Signal Processing
492
detection of all MUAPs generated by MUs active
during signal acquisition. In practice, however, there
are many MUAPs produced by MUs with no fibers
close to the detection surface. These MUAPs are
generally small, primarily of low-frequency content,
and similarly shaped. Therefore, it is difficult to
consistently assigning such MUAPs to their correct
MUAP and it is easy to miss the small MUAPs
when they occur in close temporal proximity to
larger MUAPs. Consequently, it is more useful to
only detect MUAPs that can be consistently correct-
ly assigned. MUAP detection usually involves calcu-
lating, for each sample of the composite signal ac-
quired, a statistic and comparing its value to a pre-
set threshold. Some of the signal statistics used in-
clude the raw or band pass-filtered signal amplitude
(M. J. McKeown, 2002; Fang et. al, 1999) or va-
riance (Thompson et. al, 1996; McKeown et. al,
2002), or a combination of both raw signal slope and
amplitude (Thompson et. al, 1996; Jung et. al, 2001).
When the threshold value is exceeded, a candidate
MUAP can be defined as a fixed length section of a
neighboring signal or a variable-length signal sec-
tion, assumed to possibly contain several significant
MUAP contributions (Wang et. al, 1997; Thompson
et. al, 1996). Any selected signal section may be an
isolated MUAP, a superposition of MUAPs from
two or more MUs, only a portion of a single MUAP,
or a spurious noise spike. Therefore, before further
processing, it is required that the composition of a
detected section be determined, and properly aligned
and represented.
0 5 10 15 20 25 30 35 40 45
64
66
68
70
72
74
76
78
Time msec
MUAP Amplitude uV
muap5
muap4
muap3
muap2
muap1
Maximum spike
amplitude of
MUAP
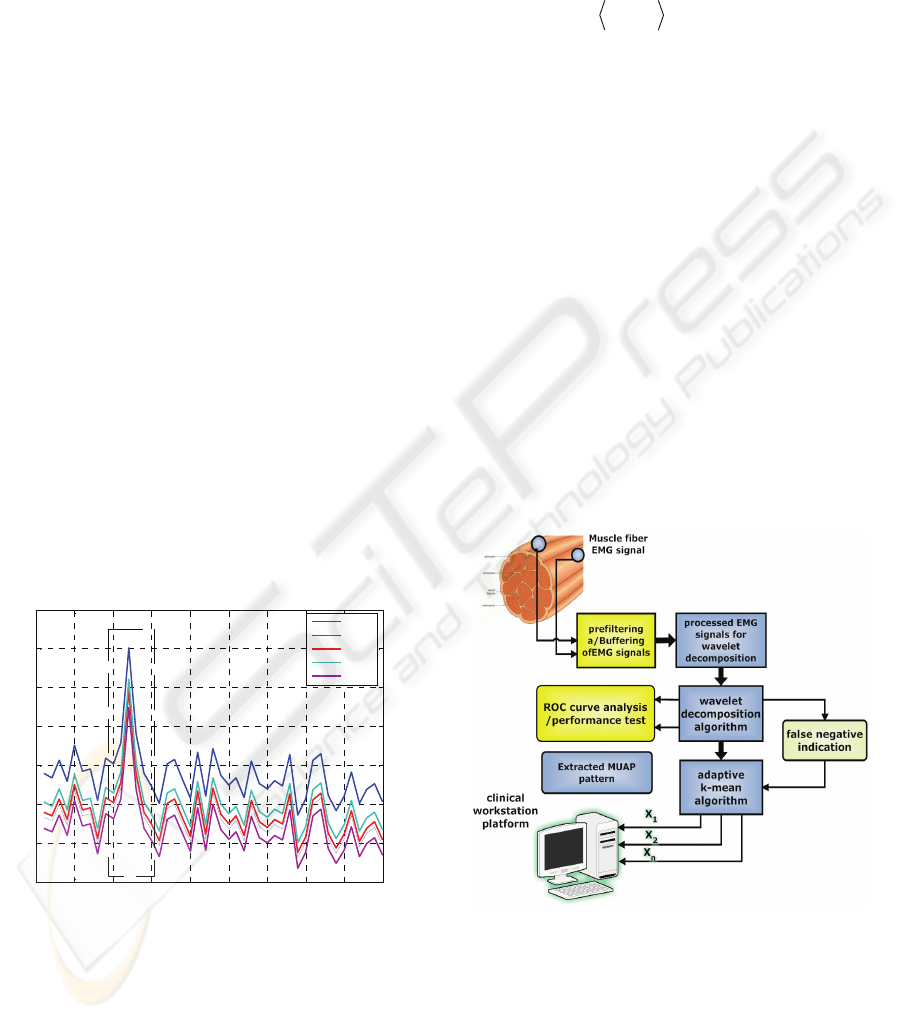
Figure 3: Localization of MUAP’s intensity profile within
repeated recording of single needle EMG electrode (Fang
et. al, 1999).
5 WAVELETS
TRANSFORMATION
The wavelet transform (WT) of signal S(t) corre
sponds to its decomposition with respect to a family
of function obtained by dilations and translations of
an analyzing wavelet denoted V(t). The coefficients
WS (a,b) deduced from this decomposition are ex-
pressed by:
dttstsbaWS
baba
)()(,),(
,,
∫
∞
∞−
∗
==
ψψ
(1)
where the superscript
* denotes the complex conju-
gate. The parameter a and b are the scale factor and
shift factor respectively. This transformation acts on
the signal as a filter bank whose frequency charac-
teristics are linked to
ψ(t) and to the parameter U. In
multiresolution signal analysis (Thompson et. al,
1996),
WT may be used to decompose a signal at
various resolutions. The details of a signal at differ-
ent resolutions generally characterize different
physical structures. From wavelet representation, the
exact reconstruction of the signal can be carried out.
This makes it feasible to compute and manipulate
data in compressed parameters via WT.
These parameters characterize the behaviour of the
signal and can be served as features. In our paper,
we select wavelet coefficient with the maximum
absolute value at each scale to be the features of
EMG signals. These values represent in some way
the correlation between the raw signals and the base
vectors of the corresponding detail subspaces.
Figure 4: EMG- decomposition and pattern clustering with
adaptive wavelet / k-mean algorithm.
6 ADAPTIVE WAVELET
DECOMPOSITION
The EMG is decomposed in a number of levels (dif-
ferent resolutions) of an appropriate wavelet basis.
OPTIMIZATION OF EMG-SIGNAL SOURCE CLASSIFICATION BASED ON ADAPTIVE WAVELETS K-MEAN
ALGORITHM
493
The Daubechies wavelet db5 from Daubechies
(Thompson et. al, 1996; McKeown et. al, 2002) has
been used with 5 decomposition levels. The wavelet
coefficients are roughly classified into two different
classes: a burst zone where artefacts and myoelectric
signals coexist and an inter-burst zone where only
artefact contribution is present. By using hard
thresholding the high-frequency components are set
to zero. In cases where there is no artefact superim-
posed to the myoelectric signal and associated
MUAP’s potentials, the coefficients are supposedly
lower so they will be set to zero with higher prob-
ability. The noisy components of the wavelet de-
composition are truncated and the signal is recon-
structed from the remaining components, addition-
ally the MUAP’s mapping feature with adaptive
wavelets reflects an accurate definition of pre and
post-firing interval identification with related
movement of the subjects (McKeown et. al, 2002;
Fang et. al, 1999).
7 ROC PERFORMANCE
ANALYSIS
As EMG signal inherited a vast number of noise
interference, this will affect result of clustering and
then need to characterize EMG sensor itself for
calibration and buffering purpose. Receiver operat-
ing characteristics (ROC) curve, is analysis of sensor
signals clustering were it is calculated through re-
peatable EMG recording which tend to be classified
in a specific classification algorithm (Jung et. al,
2001). The robustness of wavelet/k-mean algorithm
was tested in contrast to the amplifier gain of inter-
face (Andrzej Cichocki and Shun-ichi Amari, 2003)
.
Intramuscular EMG electrode which is used in clini-
cal experiment is reusable and composed of lined
conductive area used for increasing measurement
stability and reduction of parasitic noise associated
with physiological measurement session. The defini-
tion of sensitivity and selectivity with ROC analysis,
have the following criteria for recursive data cluster-
ing and pattern classification of biomedical and
clinical data.
As table 1. illustrated that the average efficiency
of classified MUAP’s potential in related EMG
signal , the obvious maximum asymptotic properties
Ω
EMG
(t) of 0.97716 and of minimum one of
0.011208 and this reflects high contrast between the
recorded EMG potential ,in which can be considered
as differentiated parameters in classifying associated
MUAP’s signal. For further investigation of this
effect, additional analysis was applied to the classi-
fied EMG signals using the non-negative matrix
decomposition after a k-mean clustering stage, in
which a relevant result of the EMG classification
shows the approximated results in relation to the
MUAP’s intensity. A performance test was applied
to the 9 clustered patterns, by which illustrate that,
the same maximum and minimum asymptotic prob-
abilities for the verified EMG patterns, which in
corresponding 25-test pattern that presented only a 3
EMG-MUAP’s pattern with relevant high voltage
intensity (A. J. Bell and T. J. Sejnowski, 1995),
(Kadefors et. al, 1999).
As observed from the performance index of
adaptive wavelet decomposition could be noticed a
well discriminated EMG pattern such as low firing
contraction, mid –firing contraction , and high firing
contraction and other elated MUAP’s biopotential
action signals associated with muscular fibers firing
schemes (Andrzej Cichocki and Shun-ichi Amari,
2003), (Micera et. al, 2001).
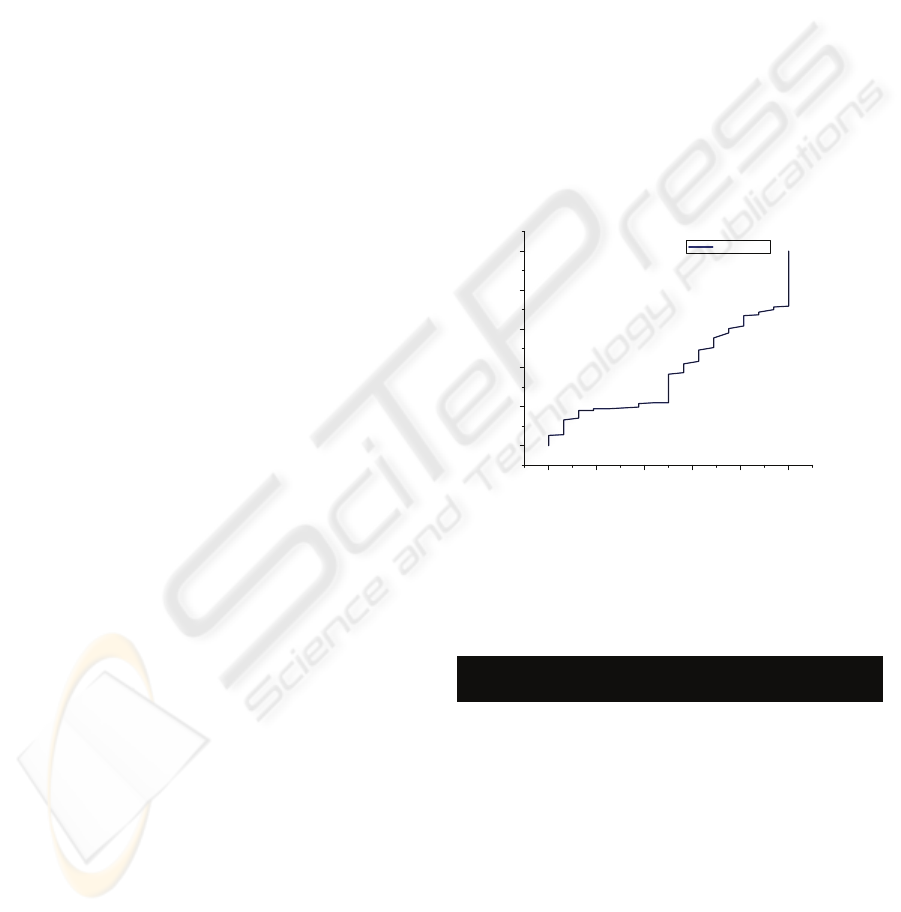
0.0 0.2 0.4 0.6 0.8 1.0
0.0
0.2
0.4
0.6
0.8
1.0
Sensitivity of EMG electrode
Specificity of EMG pattern
ROC curve
Figure 5: ROC curves analysis of 24 EMG pattern using k-
mean clustering algorithm after wavelet decomposition of
MUAP intensity patterns.
Table 1: ROC curve analysis of EMG signal patterns
based on wavelet k-mean clustering technique*.
EMG
pattern*
Area
Under
curve
Std.
Error
SE
Asymptotic
Prob
Ω(EMG)
95.%
LCL
95.%
UCL
EMG1
0.23013 0.1632 0.1083 -0.08975 0.55
EMG2
0.09751 0.29079 0.16498 -0.47243 0.66745
EMG3
0.3714 0.08492 0.08572 0.20496 0.53785
EMG4
0.5083 0.49786 0.97716 -0.46749 1.48409
EMG5
0.60189 0.19039 0.48479 0.22873 0.97505
EMG6
0.49024 0.23233 0.95367 0.03489 0.94559
EMG7
0.12033 0.32535 0.19027 -0.51734 0.758
EMG8
0.53122 0.19993 0.81122 0.13937 0.92307
EMG9
0.33194 0.20502 0.31729 -0.0699 0.73377
EMG10
0.59129 0.4909 0.75282 -0.37085 1.55342
EMG11
0.51452 0.49979 0.96004 -0.46505 1.49409
EMG12
0.09066 0.1331 0.01486 -0.17021 0.35152
EMG13
0.2125 0.24776 0.16159 -0.2731 0.6981
EMG14
0.57797 0.09307 0.42753 0.39556 0.76038
EMG15
0.73418 0.10483 0.07323 0.52872 0.93964
EMG16
0.28801 0.15334 0.20715 -0.01253 0.58854
EMG17
0.48729 0.05748 0.91535 0.37463 0.59995
EMG18
0.03942 0.19281 0.11208 -0.33849 0.41732
*18 subject were tested in the vicinity of ROC curve analysis.
BIOSIGNALS 2009 - International Conference on Bio-inspired Systems and Signal Processing
494
0 5 10 15 20 25
0
1
2
3
4
5
6
7
8
SIRs [dB]
Index of column in the original mixing matrix - A
Run : mean(SIR) = 2.0457 [dB]
Figure 6: Entropy index of EMG-wavelet k-mean decom-
position algorithm for 24 EMG pattern.
8 EVALUATION OF EMG
SIGNAL DECOMPOSITION
PERFORMANCE
Verification of the accuracy of an intramuscular
EMG signal decomposition requires the availability
of signals for which the decomposition result is
known and the definition of quantitative indexes that
allow comparison of performance. Moreover, for
completeness and to assess robustness, the perfor-
mance of a specific algorithm should be evaluated
based on a number of signals of different complexi-
ty. The reference results were obtained by manual
decomposition of a number of experimental signals
by expert operators. However, different patterns may
result when the same or different operators attempt
to decompose the same signal twice, especially if the
MU firing rates are irregular, the MUAPs are simi-
lar, superposition of MUAPs are frequent, and some
MUs may be intermittently recruited (Farina et. al,
2001; Kadefors et. al, 1999).
In addition different wavelet algorithms may
weigh different information, such as waveform simi-
larity or firing regularity; differently and therefore
produce different results. Furthermore specific algo-
rithms may be more appropriate in certain cases and
others in other cases. To assess accuracy, DeLuca
(Andrzej Cichocki and Shun-ichi Amari, 2003) pro-
posed to detect signals (using multiple electrode
surfaces) from the same MU at different locations
and to compare the results of the decomposition of
the two signals obtained. This way the probability of
incorrectly decomposing the different signals and
yet having the same firing pattern for an investigated
MU is low. When the decomposition results agree
for all the channels, the decomposition is considered
correct. The variability degree of different wavelet
algorithm was calibrated with each EMG–sensor
channel with reference ROC curve as illustrated in
Fig.5. The reference decomposition result can also
be obtained from synthetic signals generated by a
model. In this case the crucial issue is to describe all
the relevant characteristics of the experimental sig-
nals. A model is the only way to test the algorithms
with signals having selected characteristics in order
to evaluate the sensitivity of the decomposition algo-
rithms to different EMG signal parameters. Whatev-
er the approach for the generation of reference de-
composition results, it is necessary to introduce
indexes of performance computed from the compari-
son of the results obtained by the application of the
algorithm under test and the reference. Fig.8 that and
Fig.9 which illustrated the k-mean separation hyper-
plan for 24 MUAP’s signal recorded as synchro-
nized EMG recording system.
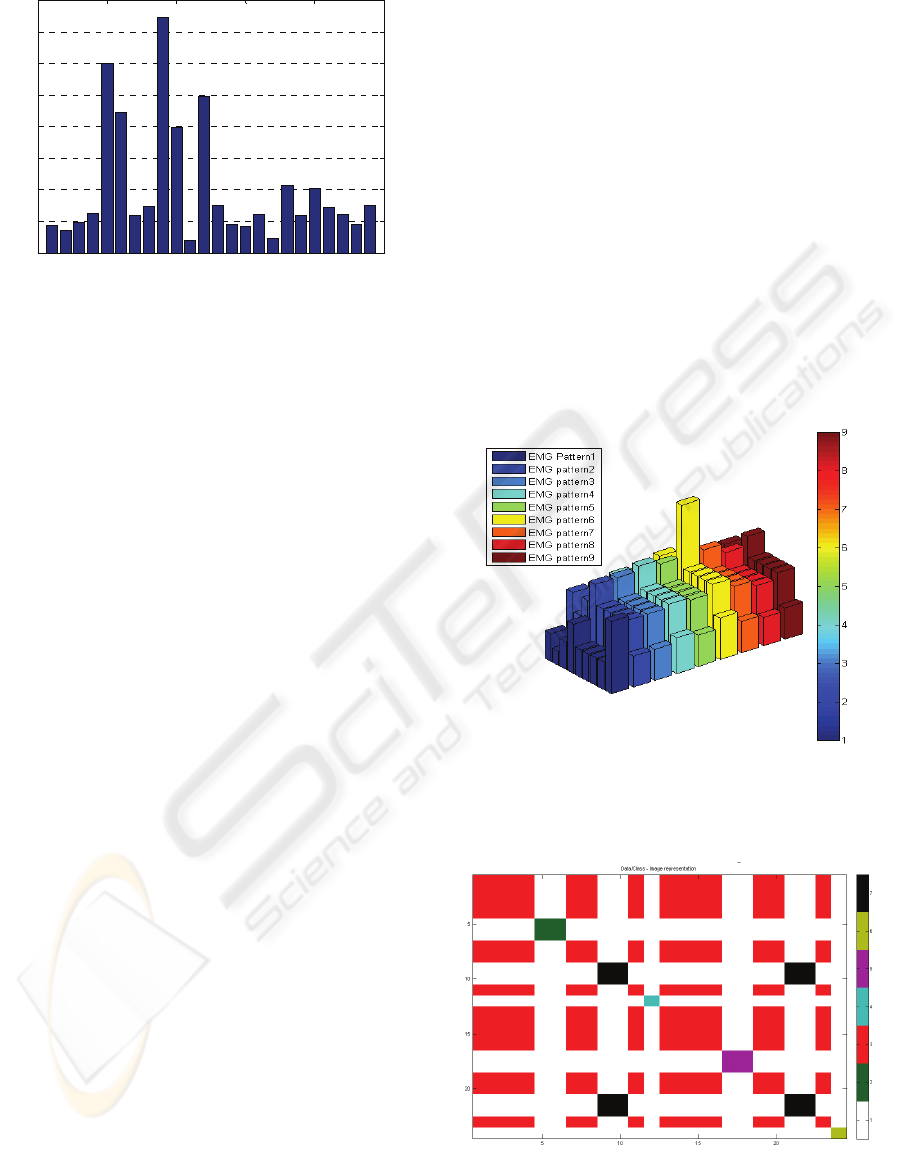
Figure 7: 3D Performance index of decomposed EMG
signal based on wavelet algorithm indicate main compo-
nents of 9 EMG extracted pattern from the 24 overall
EMG patterns.
Figure 8: k-mean clustering result for 24 MUAP’s record-
ed in needle EMG electrode, illustration of white cross and
red block pattern in the EMG signal for corresponding
MUAP’s clusters.
OPTIMIZATION OF EMG-SIGNAL SOURCE CLASSIFICATION BASED ON ADAPTIVE WAVELETS K-MEAN
ALGORITHM
495
9 RESULTS AND DISCUSSION
Adaptive Wavelet-decomposition for EMG signal
illustrates optimality in clustering efficiency of
about (p=0.0128) for spontaneous EMG vector clas-
sification. Some deviation was reported with the
linearity of MUAP classes due to different standard
deviation (SD), of each recorded EMG signal. The
signal deviation can be compensated by increasing
the correlation index, or selecting the same order
number of (Finite impulse response) FIR filtering
module to attenuate the parasitic noise in the EMG
transmission pathway.
Testing additional wavelet/ k-mean algorithms to
evaluate clustering efficiency presents with robust
hyperplane classification based on other criteria such
as EMG signal turns, spike area, integrated area, and
phases. The tested classes that have been presented
in fig.9 also shows maximum intensity differntiality
performed in adaptive wavelet algorithm as concise
effective methods to increase stability of overall
clustering schemes. Euclidean distance have been
computed in background algorithm as state vector
mapping (SVM) matrices for each EMG signal with-
in individual channel in contrary this will overload
computation time for reiterative clustering.
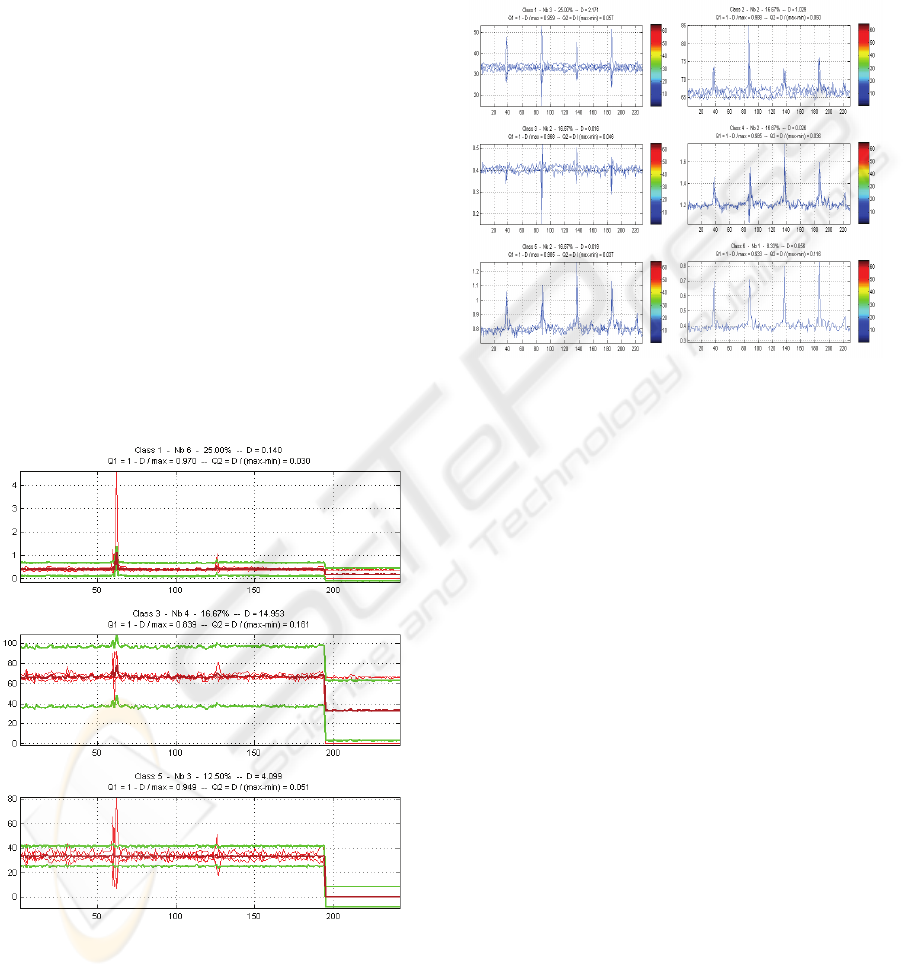
Figure 9: Selective MUAP’s classed that corresponding to
maximum spike activity pattern in recorded EMG signals.
As fig.10 illustrated the clustered coefficients of the
MUAP’s potential signal cab be differentiated in
accordance to the maximum intensity which in this
case considered as discriminative characteristics for
clinical classification system. Odd clusters as it
shown in fig.6 that have been selected for compara-
tive purposes to localize the pre and post-firing myo-
fibers relative to subject movement. Prospective
clustering data for MUAP’s based on k-mean clus-
tering technique that can be demonstrated in fig.7
where
Figure 10: Clustered coefficients of MUAP’s signal using
wavelet decomposition and K-mean clustering using 18
EMG samples.
10 CONCLUSIONS
The decomposition of the intramuscular EMG signal
is a complex task that involves advanced signal
processing and pattern recognition techniques. Their
application covers the fields of basic physiology,
neurology, motor control, ergonomics, and many
others. Current available techniques and the pre-
sented wavelet- k mean allow reliable decomposi-
tion at low /medium force contraction levels during
short and long contractions in static and dynamic
conditions. The availability of such methods for
automatic intramuscular EMG signal analysis allows
the completion of experimental studies that were
unthinkable some years ago, such as the investiga-
tion of MU activity during very long contractions
(up to hours). Intramuscular EMG signal decomposi-
tion is, however, still carried out mainly in research
environments while it finds limited clinical applica-
tion. This is mainly due to the limitations that EMG
signal decomposition still has, such as the amount of
time required to obtain clinically useful information
(especially if high reliability on a number of condi-
tions is required), the necessity in most cases of an
interaction with an expert operator, the applicability
to only low-to-medium contraction levels, and the
need of specially trained persons for the proper posi-
BIOSIGNALS 2009 - International Conference on Bio-inspired Systems and Signal Processing
496

tioning of the needle electrode to obtain the high-
quality signals required for reliable decomposition.
These limitations are being addressed by current
research efforts. The obtained result of this work and
other related work could be contribute to optimize
the efficiency and reliability of intramuscular EMG
signal
ACKNOWLEDGEMENTS
We acknowledge Aachen University of Applied
Sciences, RWTH-Aachen University and DAAD
(Deutsche Akademische Ausländische Dienst) for
providing accessibility with financial and scientific
support to put this work on the track of success.
REFERENCES
Zazula, D. (1999). Higher-order statistics used for decom-
position of sEMGs. Proceedings of the 12
th
IEEE
Symposium on Computer Based Medical System, 72–
77.
Wang, R., C. Huang, and B. Li (1997). A neural network-
based surface electromyography motion pattern clas-
sifier for the control of prostheses. Proceedings of the
19
th
Annual International Conference of the IEEE-
EMBS 1277.
Thompson, B., P. Picton, and N. Jones (1996). A compari-
son of neural network and traditional signal processing
techniques in the classification of EMG signals. IEEE
Colloquium on Artificial Intelligence Methods for
Biomedical Data Processing, Vol 2:1996 , Pp 321-327.
McKeown, M. J., Torpey, D.C., Gehm W. C.: Non-
Invasive Monitoring of Functionally Distinct Muscle
Activations during Swallowing. Clinical Neurophysi-
ology (2002). 109, 112
McKeown, M. J.: Cortical activation related to arm
movement combinations. Muscle Nerve. 9:19-25
(2000). 110, 112
Fang, J., G. C. Agarwal, and B. T. Shahani, “Decomposi-
tion of multiunit electromyographic signals,” IEEE
TransBME 46 , 685–697 (1999).
Jung T.P., Makeig S., McKeown M. J., Bell A. J., Lee
T.W., Sejnowski T. J.: Imaging brain dynamics using
independent component analysis. Proc. IEEE. 89(7):
1107-22, (2001). 112
Andrzej Cichocki, Shun-ichi AMARI, “ Adaptive Blind
Signal and Image Processing: Learning Algorithms
and Applications”, Wiley Press ,2003.
Bell A. J., Sejnowski T. J.: An information-maximization
approach to blind separation and blind deconvolution,
Neural Computation, 7:1129-1159, (1995). 112
Micera S.,Vannozzi G., Sabatini A.M., Dario P.: Improv-
ing Detection of Muscle Activation intervals, IEEE
Engineering in Medicine and Biology, vol. 20 n.6:38-
46 (2001). 112, 113
Karhunen J., Oja E.: A Class of Neural Networks for
Independent Component Analysis, IEEE Transactions
on Neural Network, vol. 8 n. 3:486-504, (1997). 112.
Farina, D., R. Colombo, R. Merletti, and H. Baare Olsen,
“Evaluation of intra-muscular EMG decomposition al-
gorithms,” J Electromyogr Kinesiol 11, 175–187
(2001).
Kadefors, R., M. Forsman, B. Zoega, and P. Herberts,
“Recruitment of low threshold motor-units in the tra-
pezius muscle during different static arm positions,”
Ergonomics 42, 359–375 (1999).
Olsen, H. B., H. Christensen, and K. Søgaard, “An analy-
sis of motor unit firing pattern during sustained low
force contraction in fatigued muscle,” Acta Physiology
Pharmacology Bulg 26, 73–78 (2001).
OPTIMIZATION OF EMG-SIGNAL SOURCE CLASSIFICATION BASED ON ADAPTIVE WAVELETS K-MEAN
ALGORITHM
497
