
A CAD SYSTEM FOR IIF TESTS
Paolo Soda and Giulio Iannello
Facolt
`
a di Ingegneria, Universit
`
a Campus Bio-Medico di Roma, Via Alvaro del Portillo 28, Roma, Italy
Keywords:
Computer Aided Diagnosis (CAD), Medical Imaging, Indirect ImmunoFluorescence (IIF), One-per-class
Classification.
Abstract:
At the present, Indirect ImmunoFluorescence (IIF) imaging is the recommended method for the detection of
antinuclear autoantibodies. IIF diagnosis requires to estimate the fluorescence intensity and to describe the
staining pattern, but resources and adequately trained personnel are not always available. In this respect, an
evident medical demand is the development of Computer Aided Diagnosis (CAD) tools that can offer a support
to physician decision. In this paper we present a comprehensive system that supports the two sides of IIF tests
classification. It is based on a cascade of two systems: the first labels the fluorescence intensity, whereas the
second recognizes the staining pattern of positive wells. The analysis of its perspective performance shows the
system potential in lowering the method variability, in increasing the level of standardization and in reducing
the specialist workload by more than 80%.
1 INTRODUCTION
Connective tissue diseases (CTD) are autoimmune
disorders characterized by a chronic inflammatory
process involving connective tissues. Detection of
antinuclear antibodies (ANA) is a common marker in
patients with suspected CTD, and the recommended
method for ANA testing is the Indirect Immunofluo-
rescence (IIF) imaging (Kavanaugh et al., 2000). IIF
slides are examined at the fluorescence microscope,
and physicians classify both the fluorescence inten-
sity and the staining pattern.
In the field of autoimmune diseases the availabil-
ity of accurately performed and correctly reported
laboratory determinations is crucial for the clinicians,
demanding for highly specialized personnel that are
not always available. Moreover, the readings in IIF
are subjected to interobserver variability that limits
the reproducibility of the method (Piazza et al., 1998;
Feltkamp et al., 1988). To date, the highest level of
automation in IIF tests is the preparation of slides with
robotic devices performing dilution, dispensation and
washing operations (Das, 2004; Bio-Rad Laboratories
Inc., 2004).
Recently, some papers proposed Computer Aided
Diagnosis (CAD) system that supports the classifi-
cation of fluorescence intensity (Soda and Iannello,
2006; Soda et al., 2008) or staining pattern (Sack
et al., 2003; Perner et al., 2002; Hiemann et al., 2007;
Soda and Iannello, 2008). It is worth noting none of
these works discusses an overall CAD that supports
both the two aspects of IIF tests classification, that is,
the fluorescence intensity and staining pattern recog-
nition.
As a novelty, in this paper we present a recogni-
tion tool that supports the classification of both fea-
tures of IIF analysis. It is based on a cascade of
two systems: the first labels the fluorescence inten-
sity, whereas the second recognizes the staining pat-
tern of positive wells. Starting from the results com-
ing out from the feature selection phase, the two
multiclass recognition tasks are divided into multi-
ple binary problems, thus adopting a decomposition
approach as classification paradigm (Dietterich and
Bakiri, 1995; Mayoraz and Moreira, 1997).
The analysis of CAD perspective performance
shows its potential in lowering the method variabil-
ity, in increasing the level of standardization and in
reducing the specialist workload by more than 80%.
2 BACKGROUND
Current guidelines for appropriate IIF tests recom-
mend the use of HEp-2 substrate diluted at 1:80 titer
(Center for Disease Control, 1996) and require to
classify both the fluorescence intensity and the stain-
ing pattern. The same guidelines suggest scoring the
former semi-quantitatively and independently by two
physicians, who are experts of IIF. Since technical
43
Soda P. and Iannello G. (2009).
A CAD SYSTEM FOR IIF TESTS.
In Proceedings of the International Conference on Health Informatics, pages 43-50
DOI: 10.5220/0001544800430050
Copyright
c
SciTePress

problems can affect test sensitivity and specificity,
they suggest using both positive and negative con-
trols. The former allows the physician to check the
correctness of the preparation process; the latter rep-
resents the auto-fluorescence level of the slide under
examination. Hence, the specialist has to compare the
sample with the corresponding positive and negative
control. This comparison is a problematic task that af-
fects the reliability of sample diagnosis (Piazza et al.,
1998; Feltkamp et al., 1988).
To reduce the variability of multiple readings of
the same sample, recently it has been recently pro-
posed to classify the sample fluorescence intensity
into three classes, named negative, intermediate and
positive. On the one hand, in the physicians’ opinion
these three classes maintain the clinical significance
of the IIF test and, on the other hand, this class re-
vision gets ground truth robust enough to develop a
classification system (Rigon et al., 2007).
Using HEp-2 cells as a substrate, the positive sam-
ples may reveal different patterns of fluorescent stain-
ing that are relevant to diagnostic purposes. Although
more than thirty different nuclear and cytoplasm pat-
terns should be identified (Solomon et al., 2002), in
the literature they are classified into one of the fol-
lowing groups (Sack et al., 2003):
• Homogeneous (HO): diffuse staining of the inter-
phase nuclei and staining of the chromatin of mi-
totic cells;
• Peripheral nuclear (PN): solid staining, primar-
ily around the outer region of the nucleus, with
weaker staining toward the center of the nucleus;
• Speckled (SP): a fine or coarse granular nuclear
staining of the interphase cell nuclei;
• Nucleolar (NU): large coarse speckled staining
within the nucleus, less than six in number per
cell;
• No pattern (NP): unclassifiable pattern.
It is worth noting that sometimes two concomitant
staining patterns can be observed in the same well.
In these cases, further dilution and/or better focusing
may help to recognize different overlapping staining.
Recent interest in autoimmune diseases is mo-
tivated by the increase of their reported incidence,
partly due to the improved diagnostic capabilities as
well as the growing awareness of this clinical prob-
lem in the general medicine. In this respect, some
recent papers apply pattern recognition and data min-
ing techniques that classify the fluorescence intensity
(Soda and Iannello, 2006; Soda et al., 2008) or the
staining pattern of HEp-2 slides (Sack et al., 2003;
Perner et al., 2002; Hiemann et al., 2007; Soda and
Iannello, 2008).
Our recognition approach differs from (Sack et al.,
2003), (Perner et al., 2002) and (Hiemann et al., 2007)
for two main reasons. First, they aim only at clas-
sifying the pattern of individual cells. Second, their
data sets differ from ours since we use images ac-
quired from the real patients sera diluted at 1:80,
which therefore exhibits positive fluorescence inten-
sity at various grading. Indeed, in (Hiemann et al.,
2007) the authors employed only sera of positive con-
trols, whereas in (Perner et al., 2002) and (Sack et al.,
2003) the authors used a different data set, which is
constituted by samples diluted at 1:160 and also con-
taining cells that were negative, i.e. they did not ex-
hibit a detectable fluorescence intensity. Moreover,
we presented our efforts in recognizing the fluores-
cence intensity and the staining pattern in (Soda and
Iannello, 2006; Soda et al., 2008) and (Soda and Ian-
nello, 2008), respectively.
It is worth noting that all previous works focus
only on one topic of IIF diagnosis, i.e. fluorescence
intensity or staining pattern classification. Hence,
none presents a complete system able to manage the
two sides of IIF tests. The following sections propose
a solution to this question.
3 SYSTEM ARCHITECTURE
A typical CAD system is made of several blocks
that control data acquisition and storage, interact with
users and support the diagnosis. In this paper we fo-
cus only on a system that supports the classification
phase of IIF tests. To this end, Figure 1 shows the
flow-chart employed to completely classify each input
sample. The recognition approach is based on a cas-
cade of two steps: the first classifies the fluorescence
intensity, whereas the second recognizes the staining
pattern of positive wells. The details of these classifi-
cation systems are discussed in previous papers of the
same authors (Soda and Iannello, 2006; Soda et al.,
2008; Soda and Iannello, 2008). The interested read-
ers may refer to them for further details.
3.1 Fluorescence Intensity Classification
With reference to the system that classifies the flu-
orescence intensity, the results coming out from the
feature selection phase enforce the evidence that the
classification could be reliably faced by introducing
one specialized expert per each of L classes that the
system should recognize. Indeed, we achieved a rel-
atively small set of stable and effective features ob-
tained for each class. We therefore adopt a decom-
position approach, which is based on the reduction of
HEALTHINF 2009 - International Conference on Health Informatics
44
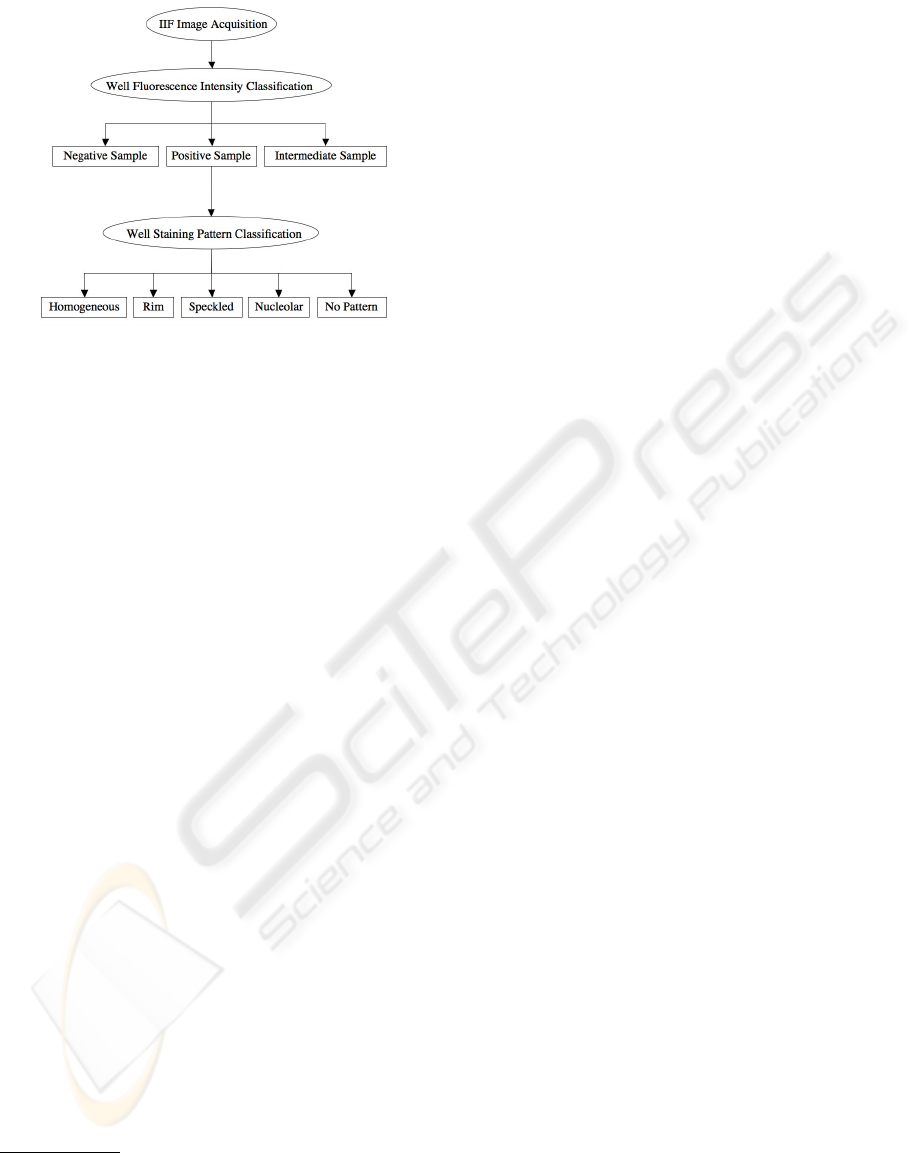
Figure 1: Flow-chart of classification procedure. The ap-
proach is based on the cascade of two systems: the first
classifies the fluorescence intensity, whereas the second rec-
ognizes the staining pattern of positive wells.
the multiclass task into multiple binary problems. The
problem complexity is reduced through the decom-
position of the polychotomy
1
in less complex sub-
tasks. The basic observation supporting this method is
that in the literature most of the available algorithms,
which handle classification problems, are best suited
to learning binary function (Dietterich and Bakiri,
1995; Mayoraz and Moreira, 1997). Different di-
chotomizers, i.e. the discriminating functions that
subdivide the input patterns in two separated classes,
perform the corresponding recognition task. To pro-
vide the final classification, their outputs are com-
bined according to a given rule, usually referred to
as selection or reconstruction rule.
Among the different decomposition methods pre-
sented in the literature (Dietterich and Bakiri, 1995;
Mayoraz and Moreira, 1997; Jelonek and Ste-
fanowski, 1998; Masulli and Valentini, 2000; Allwein
et al., 2001; Crammer and Singer, 2002; Hastie and
Tibshirani, 1998; Kuncheva, 2005), we used the one
usually named as one-per-class. It is based on a pool
of binary learning functions, where each one sepa-
rates a single class from all the others. Therefore, in
the case of fluorescence intensity classification each
module is specialized on the classification of positive,
negative and intermediate samples, respectively.
In such a recognition system, each module em-
ploys a Nearest Neighbor (NN) classifier and uses its
own representation of the input pattern, thus integrat-
ing physically different types of measurements. In
1
Supervised pattern recognition tasks, are referred to as
multiclass learning, or polychotomies, when they aim at
distinguishing instances of more than two classes, whereas
they are named binary learning, or dichotomies, if there are
two categories.
this respect, we utilise statistical features related to
first and second order histogram.
Given the set of binary modules decision, to assign
each input sample to a certain class, we propose two
different rules.
The first consists of a binary combination of the
module’s outputs, referred to as Binary Selection
(BS). Let us denote O(x) the MES output and Y
j
(x)
the output on sample x of the jth block devised to
recognized the class C
j
from the others, with j =
[1, ..., L]. Since each module has a binary output, i.e.
1 or 0, possible input combinations to the selection
module can be grouped into three categories: (i) those
for which only one module j classifies the sample in
its class C
j
, (ii) those for which more modules clas-
sify the sample in its own class, (iii) those for which
no module classifies the sample in its class.
According to these considerations, the following
conservative selection rule is adopted. In case (i) the
class of the module whose output is 1 is chosen as
a final output, since all the classifiers agree in their
decision. In case (ii) the sample is rejected since two
or more modules indicate that the sample belongs to
their own class. In case (iii) the sample is rejected
since no module indicates that the sample belongs to
its class. It is worth noting that this approach does not
require any reliability estimation.
Alternatively, a strategy based on reliability esti-
mation that chooses an output in any of the possible
combinations of modules’ output may be introduced,
referred to as Reliability-based Selection (RbS). Let
us then denote ψ
j
(x) the reliability parameter of the
jth module when it classifies the sample x. Since in
case (i) all the modules agree in their decision, we
choose as before the class of the module whose output
is 1 as a final output. Conversely, in cases (ii) and (iii)
the final decision is performed looking at the accuracy
of each modules’ classifications. More specifically, in
case (ii), m modules vote for their own class, with
2 < m ≤ L, whereas the others (L − m) ones indicate
that x does not belong to their own class (i.e. their
outputs are 1 and 0, respectively). To solve the di-
chotomy between the m conflicting modules we look
at the reliability of their classification and choose the
more reliable one. Formally:
O(x) = C
j
, where j = arg max
i:Y
i
(x)=1
(ψ
i
(x)). (1)
In case (iii), all modules classify x as belonging to
another class than the one they are specialized in (i.e.
their outputs are 0). In this case, the bigger the relia-
bility parameter ψ
j
(x), the less the probability that x
belongs to C
j
, and the bigger the probability that it be-
longs to the other classes. These observations suggest
A CAD SYSTEM FOR IIF TESTS
45
!"#$%&
'%$"%()#*+(&
,&&&&&&&&&&&&&&&&&&&&&&
-%#)./%&
01)/#2*+(&
3%44&5#6%/(&
34#77892#*+(&
:%44&5#6%/(&
34#77892#*+(&
Input& Well&
image&
N&cells&
N&cells&
Output& Well&
pa2ern&
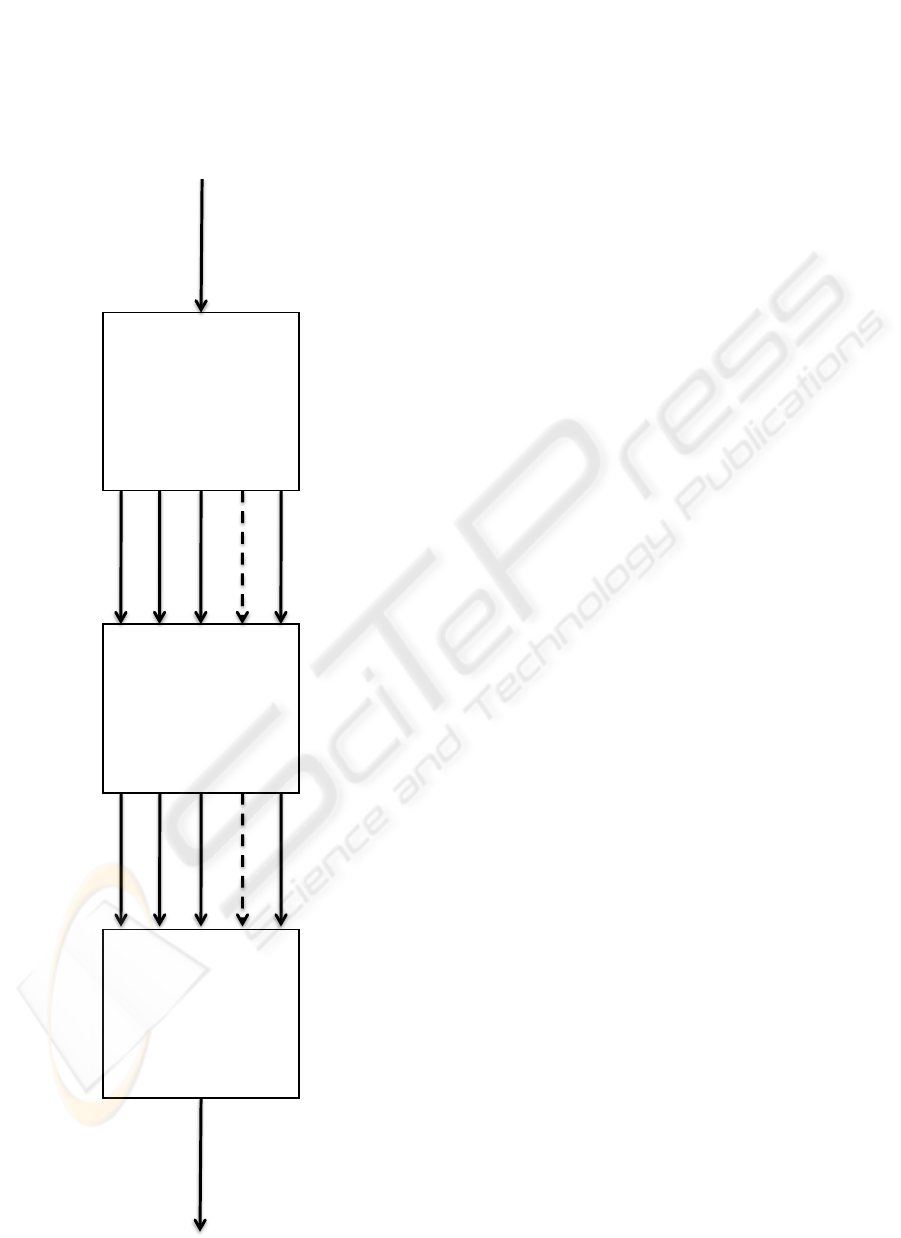
Figure 2: Description of the proposed approach to classify
the well staining pattern.
selecting the following selection rule:
O(x) = C
j
, where j = arg min
i:Y
i
(x)=0
(ψ
i
(x)). (2)
In other words, we first find out which module has
the minimum reliability and then we choose the class
associated to it as a final output. For further details,
see (Soda et al., 2008).
3.2 Staining Pattern Classification
To classify the well staining pattern into one of the
groups reported in Section 2 (i.e. HO, PN, SP, NU
and NP), we adopt the approach depicted in Figure
2. First, we segment the image to locate the cells;
second, we classify the staining pattern of several
cells and, third, we classify the staining pattern of the
whole well on the strength of the classification of its
cells.
In our opinion, such an approach addresses some
key points of IIF staining pattern classification. In-
deed, a recognition approach based on the classifica-
tion of individual cells has the potential for detecting
the occurrence of multiple patterns, i.e. the predomi-
nant and the minor ones. Furthermore, this approach
is tolerant with respect to misclassifications in cells
recognition, since the final label of the well is com-
puted by using several pieces of information, i.e. the
classifications of individual cells. Indeed, if enough
cells per well are available, it is reasonable that cells
misclassification, if limited, does not affect the well
pattern classification.
The first step of the approach depicted in Figure
2 requires to locate the cells: in this respect we use
some morphological filters and global thresholding
techniques (Soda and Iannello, 2006). In the second
step, which asks for staining pattern classification of
individual cells, we adopt once more a decomposi-
tion approach. It aggregates several NN and Multi-
Layer-Perceptrons (MLP), each devised to recognize
one class of staining pattern. Both BS and RbS rules
have been adopted again to select the final label of
input cells (Soda and Iannello, 2008). Each module
uses different feature sets related to texture compo-
nents, computed on the basis of both statistical and
spectral measures. Results of discriminant analysis
show that all the extracted features have limited dis-
criminant strength over the classes, but different fea-
ture subsets discriminate better each class from the
others, enforcing the rationale of a classifier selection
approach.
On the basis of this system that recognizes indi-
vidual cells, we determine the staining pattern of the
whole well. To this end, we tested different voting
rules, such as absolute and relative majority as well
HEALTHINF 2009 - International Conference on Health Informatics
46

as the Weighted Sum (WS) rule, which is based on
weighting the classifications of individual cells of the
well. Formally, for each well we define W S
i
as:
W S
i
=
∑
X
φ(x) · I
i
(x) (3)
where the summation is over the set X of cells that
belong to the well under consideration, φ(x) is the re-
liability of each cell classification (Soda and Iannello,
2008) and I
i
(x) denotes an indicator variable defined
as follows:
I
i
(x) =
1 if the cell x is classified to class C
i
0 otherwise.
(4)
The index of the final class of well staining pattern
is υ = arg max
i
(W S
i
), i.e. the class for which W S
i
is maximum. The experimental results show that the
WS rule outperforms the others in whole well recog-
nition.
4 DATA SET
Since no public data set is available, we populated a
referring image repository. To this aim, two IIF spe-
cialists independently classified both the fluorescence
intensity and the staining pattern of each sample ac-
cording to classes introduced in Section 2.
For testing the system dedicated to classify the
fluorescence intensity, we have used the 600 images
of the database. The a priori probability of positive,
negative and intermediate class 36.0%, 32.5% and
31.5%, respectively.
Furthermore, to carry out the recognition of stain-
ing pattern in accordance to the approach depicted
in Figure 2, we first populate a referring data set of
fluorescent cells by randomly selecting 37 images of
positive wells from our database. The a priori prob-
abilities of HO, PN, SP, NU and NP class for such
wells are 24.3%, 21.6%, 35.1%, 18.9% and 0.0%, re-
spectively. Two third of segmented cells from each
of those images are chosen at random, cropped to a
rectangular region, stored in TIFF format and singly
classified by two specialists. At the end of such a pro-
cess, the cells data set consists of 573 labelled cells,
therefore subdivided: 23.9% HO, 21.8% PN, 37.0%
SP, 8.2% NU and 9.1% artefacts, i.e. cells corrupted
during the slide preparation process.
5 RESULTS
In the following, we initially present the performance
of the system that labels the fluorescence intensity,
then we report the results of well staining pattern clas-
sification and next we discuss the perspective perfor-
mance of the overall CAD.
The error rate has been evaluated according to a
eight-fold cross validation method; the rates reported
in the following are the mean of the tests.
With reference to fluorescence intensity classifi-
cation, the first and second columns of Table 1 report
the absolute performance attained employing both the
selection rules. As to the binary selection rule (BS),
the overall miss rate is quite low. At a deeper analysis,
the selection scheme does not exhibit a false negative
rate. Hence, the positive samples erroneously classi-
fied are assigned to the intermediate class, whereas in-
termediate samples wrongly recognized are assigned
to the positive class. Furthermore, no negative sam-
ples are misclassified and occasionally they are re-
jected. The selection module rejects approximately
11% of samples, which is the counterpart we have to
pay for such low error rates. Therefore, with reference
to not rejected samples, the hit rate is 98.50%.
It is worth noting that in medical application, the
two kinds of errors, i.e. false positive and false neg-
ative, have very different relevance. In order to in-
crease the test sensitivity, the former misclassification
can be tolerated to a larger extent since false posi-
tive leads to non-necessary analysis, whereas the lat-
ter should be as low as possible.
Turning attention to the RbS rule (second column
of Table 1), i.e. the zero-reject strategy based on re-
liability estimation of each classification acts, the hit
rate increases from 87% up to more than 94%. Hence,
some of the samples that are rejected by the previ-
ous approach are now correctly classified. Neverthe-
less, there are also samples previously rejected that
are now misclassified, increasing the overall miss rate
of the recognition system up to 5.67%. Moreover the
performance on negative samples is still fine, since
99% of them are correctly recognized.
The third and fourth column of Table 1 reports the
performance of the system that classifies the staining
pattern of individual cells.
On the one hand, applying the BS rule, the clas-
sification accuracy of HO, PN and NU classes ranges
from 51% to 60%, whereas the best and worst recog-
nition performance are attained for cells of SP and AR
classes, i.e. 75% and 29%, respectively. However, as
introduced in Section 3, such a rule introduces a fixed
reject rate that aims at lowering the misclassifications.
Indeed, the hit rate on the classified samples for HO,
PN, SP, NU and AR classes is 81.3%, 84.6%, 93.0%,
89.0% and 50.1%, respectively.
On the other hand, applying the RbS rule, the clas-
sification accuracy of HO, PN and NU classes ranges
A CAD SYSTEM FOR IIF TESTS
47

Table 1: Recognition rate of both the fluorescence intensity and single cell staining pattern classifiers, adopting the two
selection rules.
Fluorescence Intensity Single Cell Staining Pattern
BS RbS BS RbS
Hit (%) 87.4 94.3 60.8 75.9
Miss (%) 1.3 5.6 10.4 24.6
Reject (%) 11.3 - 28.8 -
from 71% to 74%, whereas the best and worst recog-
nition performance is attained for cells of SP and AR
classes, i.e. 88% and 44%, respectively.
Whatever the selection rule, we deem that mis-
classifications of HO, PN and SP samples are related
to their similarities of staining pattern and texture.
Indeed, the discrimination between such classes is
a burdensome issue also for well-trained specialists.
Furthermore, errors on NU and NP classes are related
to the small cardinality of such sets. The variability
among AR samples is high, since this class contains
those cells corrupted during the slide preparation that
exhibit irregular shape and texture.
It is worth noting a direct comparison of these re-
sults with respect to previous works on the same topic
(Hiemann et al., 2007), (Perner et al., 2002) and (Sack
et al., 2003) is not possible, since their recognition
tasks differ from ours. Indeed, in (Hiemann et al.,
2007) the authors employed only sera of positive con-
trols, whereas in (Perner et al., 2002) and (Sack et al.,
2003) the authors used a different data set, which is
not only constituted by samples diluted at 1:160, but
also containing cells that were negative, i.e. they did
not exhibit a detectable fluorescence intensity.
On the strength of cells classification, we then de-
termine the whole well staining pattern applying the
Weighted Sum (WS) rule (see formula 3). To evaluate
the corresponding recognition performance, we pro-
ceed similarly to a leave one out approach working at
the well level rather than at the cells one: at each iter-
ation one well (and therefore all its cells) constitutes
the test set, while the others populate the training set.
Using this approach, we achieve an hit rate of 85.3%.
This performance, although promising, shows an er-
ror rate that could be still too high to make the system
usable in the medical practice. To overcome such a
limitation, in an operating scenario we may apply the
reject option to the decision taken by the WS criterion.
In this respect, we have to estimate the reliability of
the decision provided by this rule, and then to com-
pare it with respect to a threshold, similarly to what
we did to reject individual cells. It looks reasonable
to adopt as a reliability estimator the quantity:
ρ =
max
i
(W S
i
)
∑
i
W S
i
=
W S
υ
∑
i
W S
i
(5)
where υ is the index of the final class of well stain-
ing pattern and i varies over the four classes homo-
geneous, rim, speckled and nucleolar (see the back-
ground). Indeed, the rationale of this choice is that
the final classification is as much reliable as a larger
number of cells are classified in the final class of the
well. Applying such an option, with a threshold equal
to 0.57 we get an error rate of 5.8%. Notice that this
value is smaller than the estimated intra-laboratory
variability, which it has been measured equal to 7.4%
in (Piazza et al., 1998). The corresponding reject
rate is 17.6% which looks fairly limited. This perfor-
mance seems very good and makes the system usable
in practice, especially as a second reader to support
the specialists’ decisions.
On the basis of the previous results concerning
both fluorescence intensity and well staining pattern
recognition, we discuss now the overall perspective
performance attainable by a CAD based on these
composing systems, that is the recognition systems
that classify the two sides of IIF tests.
Since such systems can apply two selection rules,
different setups can be used. Among all, we focus
on the two extreme available arrangements, which
are referred to as liberal and conservative. On the
one hand, a classification system may be thought as
“liberal” when it makes positive classifications with
weak evidence so it classifies nearly all positives cor-
rectly, but it often has high false positive rates. On the
other hand, it may be defined as “conservative” when
it makes positive classifications only with strong evi-
dence so it makes few false positive errors, but it often
has low true positive rates as well (Fawcett, 2004).
In our case, the most liberal configuration is real-
ized as follows. Both the fluorescence intensity and
the staining pattern classification systems apply the
RbS criterion.
A conservative setup is carried out as follows. The
fluorescence intensity classification system employs
the BS criterion, whereas the system that recognizes
HEALTHINF 2009 - International Conference on Health Informatics
48

Table 2: Performance of the overall CAD system, applying the most liberal and conservative setups.
Liberal Setup Conservative Setup
Hit (%) Miss (%) Reject (%) Hit (%) Miss (%) Reject (%)
Positive Samples 78.6 21.4 0.0 67.2 5.5 27.3
Negative Samples 98.9 1.1 0.0 89.4 0.0 10.6
Intermediate Samples 92.3 7.7 0.0 85.0 3.4 11.6
Total 89.5 10.5 0.0 80.0 3.1 16.9
the single cell staining pattern is based on the RbS
rule. To label the staining pattern of the whole well,
the weighted voting criterion works with the reject op-
tion presented above (equation 5).
The results of the liberal and conservative setup
are shown in Table 2. In case of liberal configuration,
the overall recognition rate is 90%, approximately,
whereas in the conservative one it is 80%. Such a
variation is essentially due to the introduction of re-
ject options both at the stage of fluorescence intensity
and staining pattern classification, respectively. Their
use aims at lowering the misclassifications: indeed,
the miss rate of the conservative configuration is one
third of the corresponding one of the liberal setup, i.e.
3.1% vs. 10.5%. The side effect is that the 16.9% of
samples are rejected. It is worth noting that the stain-
ing pattern classification influences only the recogni-
tion rate of positive samples. Therefore, the employ-
ment of a two stages recognition approach (Figure 1)
permits to achieve low false negative rate in both se-
tups, as discussed for fluorescence intensity recogni-
tion results.
Besides the two configurations presented above,
others should be used. However, these two arrange-
ments represent the most conservative and liberal
ones that can be set on the basis of the systems dis-
cussed in this work. The other setups present inter-
mediate performance between such extrema.
6 CONCLUSIONS
In this paper we have proposed a system for automatic
classification of the two sides of IIF tests, that is, the
fluorescence intensity and the well staining pattern.
The corresponding classification tasks are addressed
by two systems based on a decomposition method. In
this framework, we have presented and evaluated two
different selection rules, providing both a fixed-reject
and a zero-reject system, respectively. We have then
discussed the performance achieved using the cascade
of these two systems for IIF image classification, us-
ing both the most conservative and the liberal setups.
Finally, let us make some considerations on the re-
sults. A system that acquires and classifies IIF images
can be used: (i) to reduce the interobserver variabil-
ity, (ii) to increase the level of standardization of the
reading procedures, (iii) to act as a second reader to
reduce the workload of senior IIF experts. In partic-
ular, according to the preliminary rates measured on
our prototype, all the images can be read by a junior
(e.g. resident) IIF expert and his/her diagnoses com-
pared with those automatically provided by the sys-
tem. If the two classifications match, the diagnosis
is confirmed and the specialist needs no more work.
A senior IIF expert should read mismatched and re-
jected samples to confirm or not the diagnosis of the
junior expert. According to this scenario the system
would allow a remarkable workload reduction for a
senior IIF expert (more than 80%).
In the end, we are currently engaged in populating
a larger annotated database, improving the developed
tools, exploring other classification strategies. Our re-
search efforts are also directed towards both a better
integration of the two systems devised to recognize
the fluorescence intensity and the staining pattern, and
a development of feedback loops to lower more the
error rate.
ACKNOWLEDGEMENTS
The authors gratefully acknowledge the contribution
of DAS s.r.l of Palombara Sabina (www.dasitaly.com),
the comments of Dario Malosti, as well as Antonella
Afeltra, Amelia Rigon and Ilaria Renna for their col-
laboration in IIF images annotation and evaluation.
REFERENCES
Allwein, E. L., Schapire, R. E., and Singer, Y. (2001). Re-
ducing multiclass to binary: a unifying approach for
margin classifiers. Journal of Machine Learning Re-
search, 1:113–141.
A CAD SYSTEM FOR IIF TESTS
49

Bio-Rad Laboratories Inc. (2004). PhD System.
http://www.bio-rad.com.
Center for Disease Control (1996). Quality assurance for
the indirect immunofluorescence test for autoantibod-
ies to nuclear antigen (IF-ANA): approved guideline.
NCCLS I/LA2-A, 16(11).
Crammer, K. and Singer, Y. (2002). On the algorith-
mic implementation of multiclass kernel-based vec-
tor machines. Journal of Machine Learning Research,
2:265–292.
Das (2004). Service Manual AP16 IF Plus. Palombara
Sabina (RI).
Dietterich, T. G. and Bakiri, G. (1995). Solving mul-
ticlass learning problems via error-correcting output
codes. Journal of Artificial Intelligence Research,
2:263–286.
Fawcett, T. (2004). ROC graphs: Notes and practical con-
siderations for researchers. Machine Learning, 31.
Feltkamp, T. E. W., Klein, F., and Janssens, M. (1988).
Standardisation of the quantitative determination
of antinuclear antibodies (ANAs) with a homoge-
neous pattern. Annals of the Rheumatic Diseases,
47(11):906–909.
Hastie, T. and Tibshirani, R. (1998). Classification by pair-
wise coupling. In NIPS ’97: Proceedings of the 1997
conference on Advances in neural information & pro-
cessing systems 10, pages 507–513, Cambridge, MA,
USA. MIT Press.
Hiemann, R., Hilger, N., Michel, J., Nitscke, J., Bohm, A.,
Anderer, U., Weigert, M., and Sack, U. (2007). Au-
tomatic analysis of immunofluorescence patterns of
HEp-2 cells. Annals of the New York Academy of Sci-
ences, 1109(1):358–371.
Jelonek, J. and Stefanowski, J. (1998). Experiments on
solving multiclass learning problems by n
2
classifier.
In 10th European Conference on Machine Learning,
pages 172–177. Springer-Verlag Lecture Notes in Ar-
tificial Intelligence.
Kavanaugh, A., Tomar, R., Reveille, J., Solomon, D. H., and
Homburger, H. A. (2000). Guidelines for clinical use
of the antinuclear antibody test and tests for specific
autoantibodies to nuclear antigens. American College
of Pathologists, Archives of Pathology and Laboratory
Medicine, 124(1):71–81.
Kuncheva, L. I. (2005). Using diversity measures for gen-
erating error-correcting output codes in classifier en-
sembles. Pattern Recognition Letters, 26(1):83–90.
Masulli, F. and Valentini, G. (2000). Comparing decompo-
sition methods for classication. In KES’2000, Fourth
International Conference on Knowledge-Based Intel-
ligent Engineering Systems & Allied Technologies,
pages 788–791.
Mayoraz, E. and Moreira, M. (1997). On the decomposi-
tion of polychotomies into dichotomies. In ICML ’97:
Proceedings of the Fourteenth International Confer-
ence on Machine Learning, pages 219–226.
Perner, P., Perner, H., and Muller, B. (2002). Mining knowl-
edge for HEp-2 cell image classification. Journal Ar-
tificial Intelligence in Medicine, 26:161–173.
Piazza, A., Manoni, F., Ghirardello, A., Bassetti, D., Vil-
lalta, D., Pradella, M., and Rizzotti, P. (1998). Vari-
ability between methods to determine ANA, anti-
dsDNA and anti-ENA autoantibodies: a collaborative
study with the biomedical industry. Journal of Im-
munological Methods, 219:99–107.
Rigon, A., Soda, P., Zennaro, D., Iannello, G., and Afeltra,
A. (2007). Indirect immunofluorescence in autoim-
mune diseases: Assessment of digital images for di-
agnostic purpose. Cytometry B (Clinical Cytometry),
72:472–477.
Sack, U., Knoechner, S., Warschkau, H., Pigla, U., Em-
merich, F., and Kamprad, M. (2003). Computer-
assisted classification of HEp-2 immunofluorescence
patterns in autoimmune diagnostics. Autoimmunity
Reviews, 2:298–304.
Soda, P. and Iannello, G. (2006). Experiences in ANN-
based classification of immunofluorescence images.
International Journal of Applied Science, Engineer-
ing and Technology, 2(2):102–107.
Soda, P. and Iannello, G. (2008). Staining pattern clas-
sification in antinuclear autoantibodies testing. In
HEALTHINF 2008, pages 231–236.
Soda, P., Iannello, G., and Vento, M. (2008). A multiple ex-
perts system for classifying fluorescence intensity in
antinuclear autoantibodies analysis. Pattern Analysis
& Applications, doi: 10.1007/s10044-008-0116-z.
Solomon, D. H., Kavanaugh, A. J., and Schur, P. H. (2002).
Evidence-based guidelines for the use of immunologic
tests: Antinuclear antibody testing. Arthritis Care &
Research, 47(4):434–444.
HEALTHINF 2009 - International Conference on Health Informatics
50
