
ANALYSIS OF THE HEART RATE VARIABILITY BEFORE
AND AFTER ASPHYXIA
Federico Cardona Rocha and Fernando S. Schlindwein
Department of Engineering, University of Leicester, Leicester, LE1 7RH, U.K.
Keywords: Heart rate variability, Autonomic nervous system, Injury, Asphyxia.
Abstract: Over the last two decades there has been a widespread interest in the study of variations in the beat-to-beat
timing of the heart, known as heart rate variability (HRV). The studies of heart rate variability have allowed
access to useful information about disturbances in autonomic regulation, which are a promising marker to
quantify autonomic activity. Heart rate variability has become the conventionally accepted term to describe
variations of both instantaneous heart rate and RR intervals (the RR interval is the time interval between two
consecutive R-points of the QRS complex) (D. Bajic et al., 2006). The objective of this paper is the analysis
and comparison of the HRV before and after asphyxia using data from previous studies where 24 adult
Wistar rats were anesthetised and subjected to controlled asphyxia for specified durations (Boardman et al
2002). Preliminary results of our work show a depression of this parameter after long periods of asphyxia,
indicating that HRV might be a good marker for assessing injury to the autonomic nervous system due to
asphyxia.
1 INTRODUCTION
Cardiac activation is an electrical propagation that
spreads over the structure of the heart in a
coordinated pattern leading to an effective systole.
This results in a measurable change in potential
difference on the surface of the body of the subject.
The resultant amplified and filtered electrical signal
is the electrocardiogram and it is widely used to
measure the heart rate and heart rate variability
(Azuaje et al., 2007).
The base line variability of the heart rate time
series is determined by many factors. However, not
only does the mean beat to beat interval (the heart
rate) change on many scales, but the variance of this
sequence of each heartbeat interval does so too. On
the shortest scale, the time between each heartbeat is
irregular. These short term oscillations reflect
changes in the relative balance between the
sympathetic and parasympathetic branches of the
autonomic nervous system (ANS), the
sympathovagal balance. This heart rate irregularity
is a well studied effect known as heart rate
variability (HRV) (Azuaje et al., 2007). A reduction
of HRV has been reported accompanying many
cardiac and cerebral conditions including foetal
brain stem injury; severe neonatal respiratory
distress syndrome is accompanied by a reduction in
low-frequency heart rate variability, if the
respiratory distress improves heart rate variability
increases (Buerk et al., 1997).
The purpose of the current study is to assess the
heart rate variability before and after asphyxia
periods and determine its correlation with the
severity of the insult. To do this, data arising from
several experiments where 24 adult Wistar rats were
anaesthetised and subjected to controlled asphyxia
for specified durations were used (Boardman et al.,
2002).
2 METHODS
2.1 Statistical Method
The application of statistics to medical data is often
used to design experiments and clinical studies, to
summarize, explore, analyse, and present data, to
draw inferences from data by estimation or
hypothesis testing, to evaluate diagnostic
procedures, and to assist clinical decision making
(Azuaje et al., 2007). Since changes in the ECG are
498
Cardona Rocha F. and S. Schlindwein F. (2009).
ANALYSIS OF THE HEART RATE VARIABILITY BEFORE AND AFTER ASPHYXIA .
In Proceedings of the International Conference on Bio-inspired Systems and Signal Processing, pages 498-501
DOI: 10.5220/0001546104980501
Copyright
c
SciTePress
quasi-periodic, on beat to beat basis, the frequency
can be quantified in statistical terms (Azuaje et al.,
2007)Simple linear time domain statistics such as
standard deviation (SD) and root mean square of the
successive R-R intervals have been often employed
to analyse HRV fluctuations providing insights into
the autonomic cardiac regulation (Bezerianos et al.,
2004).
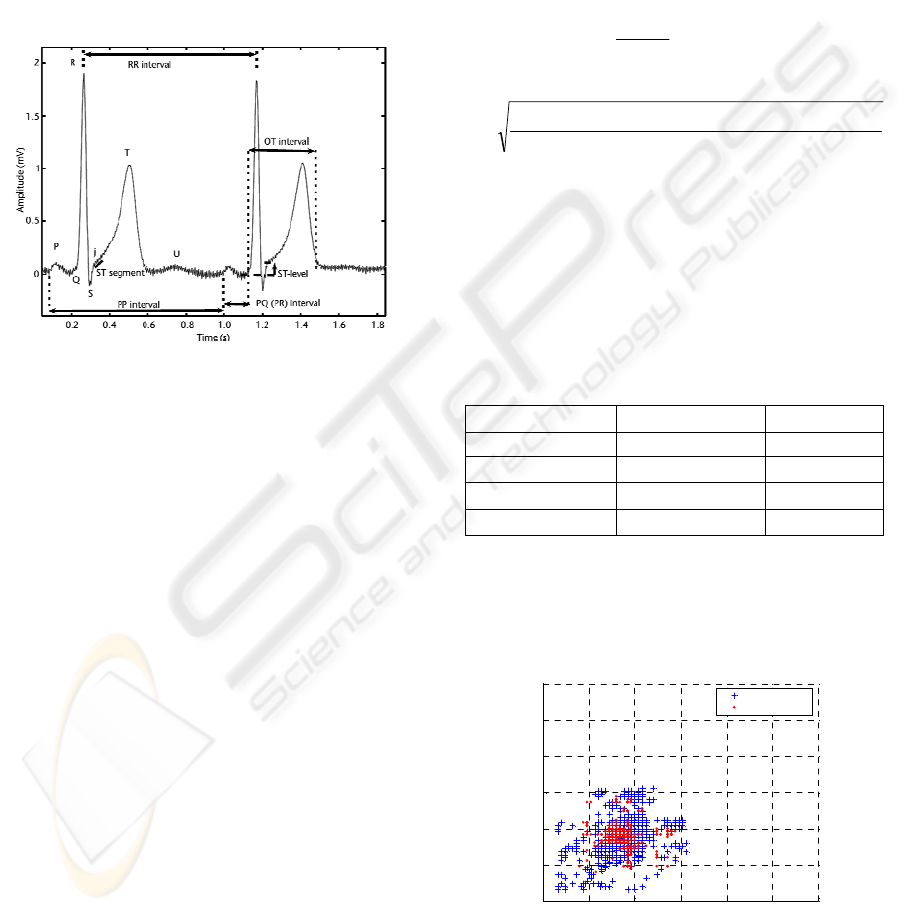
In this study the assessment of the HRV is
carried out / determined by the standard deviation of
normal RR intervals (figure 1).
Figure 1: Points and Intervals in the ECG.
Often the RR interval will oscillate periodically,
shortening with inspiration (and lengthening with
expiration). This is known as ‘respiratory sinus
arrhythmia’ and is mediated by the Bainbridge
reflex.
2.2 Geometrical Method
Time-Domain analysis of heart rate variability is a
statistical approach describing the magnitude of the
variability around a mean, but it does not provide
information about the characteristics of these
variations (Acanfora et al., 1998). Beat to beat
variation can also be displayed by plotting each RR
interval against that of the preceding RR interval,
and allows the identification of beat to beat cycles
and patterns in data that are difficult or maybe not
observable by other methods of analysis.
This Poincaré plot analysis is a quantitative
visual technique taken from nonlinear dynamics,
whereby the shape of the plot is categorized into
functional classes (Smith et al., 2003), (Brennah et
al., 2001). Poincaré plots provide summary
information as well as detailed beat to beat
information on the RR variability (Buerk et al.,
1997).
3 RESULTS
Using the SDNN (figure 2) for the RR intervals we
take the absolute value of each deviation before the
summation otherwise the positive and negative
terms would average to zero. The important
parameter is not the deviation from the mean, but the
power represented by the deviation from the mean.
(Smith et al., 2003)
()
∑
−
=
−
−
=
1
0
2
2
1
1
N
i
i
x
N
μσ
()()() ( )
1
...
2
1
2
2
2
1
2
0
−
−++−+−+−
=
−
N
xxxx
N
μμμμ
σ
Figure 2: Calculation of the standard deviation of the
signal.
We apply this method to the first 5 minutes and
the last 3.5 minutes for each group, to measure the
behaviour of HRV before the asphyxia is present
and after the insult. The results are summarised in
table 1.
Table 1: Comparison before / after asphyxia.
Group Before After
One Minute 3.47 ms 1.87 ms
Three Minute 0.42 ms 0.14 ms
Five Minute 0.68 ms 0.32 ms
Seven Minute 0.34 ms 0.12 ms
Another comparison of the HRV was performed
using Poincaré plots for each group, plotting the RR
intervals against the immediate value (figures 3, 4, 5
and 6).
Figure 3: Comparison before/after asphyxia for one
minute.
400
100 150 200 250 300 350 400
100
150
200
250
300
350
RR Vs RRn-1 Values
RRms
RRn-1
Before asphyxia
After asphyxia
ANALYSIS OF THE HEART RATE VARIABILITY BEFORE AND AFTER ASPHYXIA
499
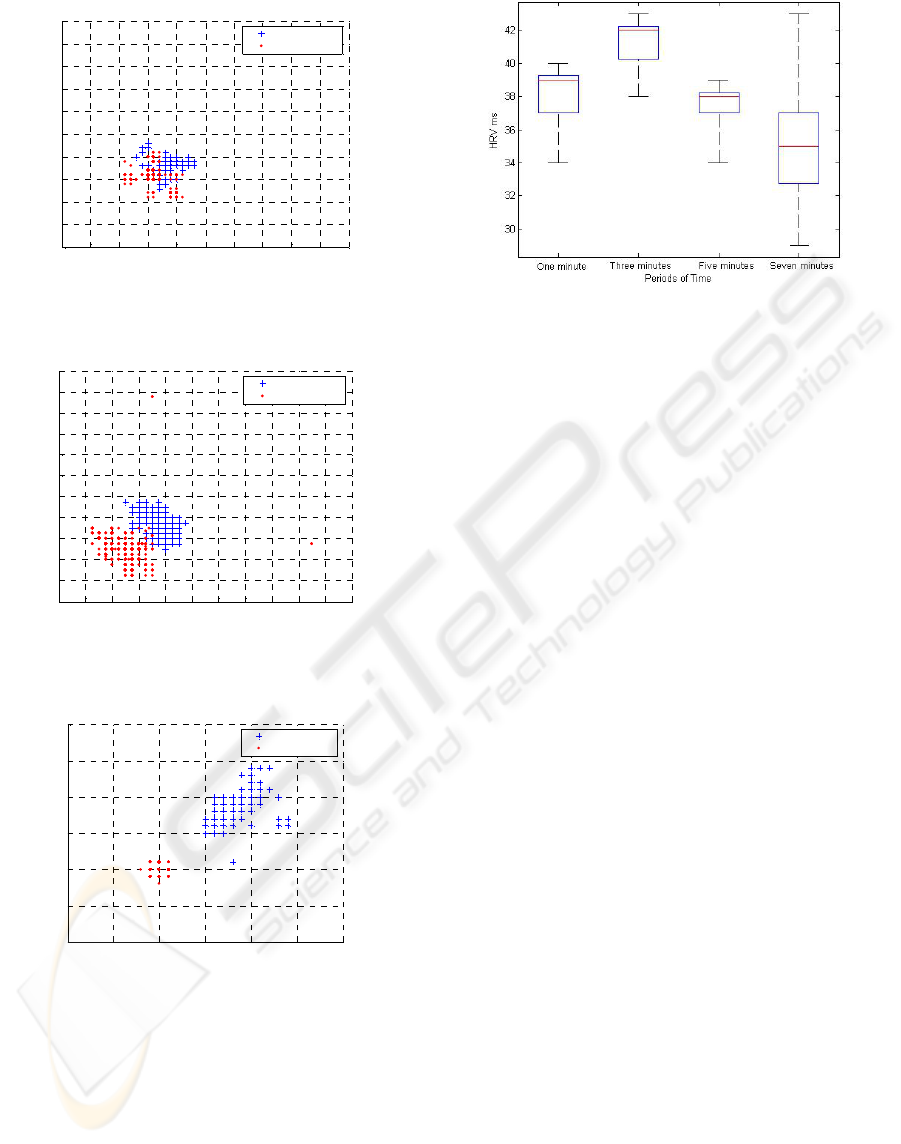
Figure 4: Comparison before/after asphyxia for three
minutes.
Figure 5: Comparison before/after asphyxia for five
minutes.
Figure 6: Comparison before/after asphyxia for seven
minutes.
4 CONCLUSIONS
The results showed that for both methods the heart
rate variability had a marked increase during the
asphyxia. After the asphyxia occurs the HRV had a
marked decrease for longer periods of asphyxia,
while for shortest periods the drop of the HRV was
not so severe (figure 7).
Figure 7: Decrease of The HRV after longer periods of
asphyxia.
We observed that the relation between the
increase and decrease of the heart rate variability
before and after asphyxia could be used as an
indicator of the severity of the injury to the
autonomic nervous system; HRV might then be a
promising marker to estimate the severity of the
asphyxia. In the future it will be interesting to
investigate longer periods of asphyxia to see if this
observation is confirmed.
ACKNOWLEDGEMENTS
To the National Council of Science and Technology
(CONACYT) of Mexico.
REFERENCES
Acanfora D., D’Addio G., Furgir G., MaestriR.,Rengo F.,
Pinna G.D. 1998 Reproducibility of short and long
term Poincaré plot parameters compared with
frequency domain HRV indexes in congestive heart
failure, Computers in Cardiology IEEE vol. 25, pp
381-384.
Azuaje Francisco, D. Clifford Gari, E. Mcsharry Patrick,
2007 Advanced methods and tools for ECG data
analysis, Chapters 1, 2, 3.
Bezerianos A., Cimponeriu L., Moraru L., Thakor N., Ton
S. 2004. Characterization of heart rate variability
changes following asphyxia in rats, Methods Inf.
Med., vol. 43, pp. 118-121.
Boardman Anita, Schlindwein S.Fernando, Thakor V.
Nitish, Kimura Tetsu, Geocadin G. Romergryko
2002. Detection of asphyxia using heart rate variability
Med. Bio. Eng. Computing, vol. 40, pp. 618-624.
Brennah M., Palaniswami. M., and Kamen P. 2001.Do
existing measures of Poincaré plot geometry reflect
nonlinear features of heart rate variability?, IEEE
100 120 140 160 180 200 220 240 260 280 300
100
120
140
160
180
200
220
240
260
280
300
RR Vs RRn-1 Values
RRms
RRn-1
Before asphyxia
After asphyxia
100 120 140 160 180 200 220 240 260 280 300 320
100
120
140
160
180
200
220
240
260
280
300
320
RR Vs RRn-1 Values
RRms
RRn-1
Before asphyxia
After asphyxia
100 120 140 160 180 200 220
100
120
140
160
180
200
220
RR Vs RRn-1 Values
RRms
RRn-1
Before asphyxia
After asphyxia
BIOSIGNALS 2009 - International Conference on Bio-inspired Systems and Signal Processing
500

Transactions on Biomedical Engineering, vol. 48, pp.
1342-1347.
Brennah M., Palaniswami. M., and Kamen P 2002.
Poincare interpretation using a physiological model of
hrv based on a network of oscillators Am. J. Physiol.
Heart Circ. Physiol., vol. 283, pp. 1873-1886.
Buerk D.G., Ghodadra R., Hao L., Mohadjer Y., Thakor
N.V. 1997 Nitric oxide changes in adult rat brain after
transient global ischemia, Proceedings-19
th
International conference IEEE/EMBS.
D, Bajic, N. Japundzic-Zigon, C. Stefanovic, D.
Vukobratovic, S. Milutinovic, O. Sarenac, S.
Milosavljevic. 2006. Contribution of the autonomic
nervous system to the disorder in the heart rate and
blood pressure signals of rats European study group on
cardiovascular oscillations, Jena Germany, pp.15 – 17.
Kamen P.W, Krum H., Tonkin A.M 1996. Poincare plot of
heart rate variability allows quantitative display of
parasympathetic nervous activity Aust. Family
Physician, vol. 25, pp. 1087-1094.
Smith W. Steven, 2003. Digital signal processing a
practical guide for engineers and scientists”. Elsevier,
Science, Chap. 2.
ANALYSIS OF THE HEART RATE VARIABILITY BEFORE AND AFTER ASPHYXIA
501
