
EMD-BASED ANALYSIS OF RAT EEG DATA FOR
SLEEP STATE CLASSIFICATION
S¨uleyman Baykut
1,2
, Paulo Gonc¸alves
2
, Pierre-Herv´e Luppi
3
, Patrice Abry
4
Edmundo Pereira de Souza Neto
4,5
and Damien Gervasoni
3
1
Department of Electronics and Communications Engineering, Istanbul Technical University, Istanbul, Turkey
2
INRIA-RESO, LIP, Ecole Normale Sup´erieure de Lyon, Lyon, France
3
Physiopathologie des R´eseaux Neuronaux du Cycle Veille-Sommeil, UMR5167 CNRS, Universit´e Claude Bernard, Lyon, France
4
Laboratoire de Physique, UMR 5672 CNRS, Ecole Normale Sup´erieure de Lyon, Lyon, France
5
Service d’Anesth´esie R´eanimation, Hˆopital Pierre Wertheimer, Hospices Civils de Lyon, Bron, France
Keywords:
Automatic Sleep State Classification, Empirical Mode Decomposition, Rat EEG.
Abstract:
In this paper Empirical Mode Decomposition (EMD)-based features from single-channel electroencephalo-
graphic (EEG) data are proposed for rat’s sleep state classification. The classification performances of the
EMD-based features and some classical power spectrum density (PSD)-based features are compared. Sup-
ported by experiments on real EEG data, we demonstrate that classification performances can significantly
improve, by simply substituting EMD to PSD in features extraction. This is in noticeably due to the natural
adaptivity of EMD which show more robust to subjects variability.
1 INTRODUCTION
EEG signals are widely used to study the basic as-
pects of the brain activities in human and/or in ani-
mals. EEG data show variations related to the differ-
ent brain states during sleep which make EEG an im-
portant tool in sleep studies (Robert et al., 1999; Vya-
zovskiy et al., 2002; Estrada et al., 2004; Hese et al.,
2001; Vivaldi and Bassi, 2006; Corsi-Cabrera et al.,
2001). Objective staging of the sleep states by visual
analysis of EEG data is a time consuming and rather
subjective process, as staging agreement between dif-
ferent experts is around 80 − 90% (Gervasoni et al.,
2004; Robert et al., 1999). In recent years, the re-
searches focused on defining new methods, mostly
utilizing EEG data, in order to provide an automatic
and more objective staging of the brain states. How-
ever, due to the complexity and to the subject variabil-
ity of EEG signals, automatic sleep classification still
remains a challenging issue.
Automatic sleep state classification based on EEG
data has been performed by a large number of tech-
niques relying on time, frequency or wavelet do-
main features, such as EEG amplitudes, zero crossing
counting, harmonic analysis, Hjorth parameters, spe-
cific bandwidths’ energies (δ, θ, σ), bispectra (Ning
et al., 1990), to cite but a few.
In most studies dealing with automatic quantita-
tive classification of sleep states, frequency domain
features seem to be preferred. In particular, Power
Spectrum Density (PSD)-based classifications rely on
the energy carried out in different frequency inter-
vals, even if a unanimous consensus about the defi-
nition of sensitive bandwidths is still missing (Robert
et al., 1999; Corsi-Cabrera et al., 2001). It is also no-
ticed that mostrepresentativeEEG activities may vary
between sleep states and between different subjects
(Corsi-Cabrera et al., 2001). Moreover, to be fully
relevant, PSD-based methods require the data to be
stationary over the analyzedepoch. This is anotherse-
vere limitation when dealing with EEG signals which
by nature are non-stationary as it is the case for most
biomedical signals. For all these reasons, a method
that is adaptive (data-driven), less sensitive to subject
heterogeneity and robust to non-stationary data is cer-
tainly worth investigating.
Empirical Mode Decomposition (EMD) is known
to be a fully data-driven technique which automati-
cally extracts meaningful oscillating components (in-
trinsic modes) that underlie the signal (Huang et al.,
1998; Rilling et al., 2003). Furthermore, as it acts
locally in time, EMD does not require the analyzed
115
Baykut S., Gonçalves P., Luppi P., Abry P., Pereira de Souza Neto E. and Gervasoni D. (2009).
EMD-BASED ANALYSIS OF RAT EEG DATA FOR SLEEP STATE CLASSIFICATION.
In Proceedings of the International Conference on Bio-inspired Systems and Signal Processing, pages 115-123
DOI: 10.5220/0001546501150123
Copyright
c
SciTePress
signal to be stationary. The main goal of this study
is then to underline how the inherent advantages of
EMD can sensibly strengthen the features’ extraction
and improve the sleep state classification.
The article is organized as follows. Data and
methods are described in Sections 2 and 3, respec-
tively. Section 4 presents and compares the classi-
fication performances of both PSD and EMD-based
approaches. We conclude and discuss possible exten-
sions of this work in Section 5.
2 MATERIALS
In order to reduce the number of experimented
animals, we advisedly re-used for this study a data
set originally obtained from previous experiments.
In these experiments, adult male Sprague Dawley
rats (250-300 g) were chronically implanted for
polygraphic recordings under general anesthesia
(Ketamine / Xylazine, 90 mg/kg and 5mg/kg re-
spectively). Briefly, three stainless steel EEG screws
were inserted into the skull over the frontal, parietal
and occipital cortices, with a reference electrode
placed over the cerebellum. Two stainless wires were
inserted into the neck muscles. All electrodes were
linked to a connector cemented to the skull with
dental acrylic. Post-operative analgesia was ensured
by oral administration of carprofen (Rimadyl
R
, 0.5
mg / 100 g / 24 h). After ten days of recovery from
the surgical procedure, the rats were individually
habituated to the recording chamber and cable under
a 12 hour light/dark cycle (lights on at 7:00 A.M.)
with water and food ad libitum. All procedures
were in accordance with the National Institute of
Health guidelines for animal care and were ap-
proved by our local institutional ethics committee
for animal experimentation. From each rat, three
referential EEG and one bipolar EMG signals were
amplified and filtered (bandwidth 1-250 Hz) using a
preamplifier headstage and a multichannel amplifier
(MCP Plus, Alpha-Omega Engineering, Nazareth,
Israel), and sampled at 512 Hz using an analog to
digital converter (Cambridge Electronic Design,
Cambridge, UK). In this study, the data set from 6
rats are analyzed. Data files were manually scored by
10-seconds epochs using EEG and EMD magnitude
criteria defined in the four distinct papers (Gervasoni
et al., 2004), (Gottesmann et al., 1976), (Timo-Iaria
et al., 1970), (Winson, 1974). Although the epochs
were scored by two scorers with an inter-rater agree-
ment of 85%, here the result from only one scorer
was used. Blind repeated scoring was not performed
in this study. Three sleep states are identified;
0 1 2 3 4 5 6 7 8 9 10
−4
−2
0
2
4
a) AW
0 1 2 3 4 5 6 7 8 9 10
−4
−2
0
2
4
b) SWS
Amplitude
0 1 2 3 4 5 6 7 8 9 10
−4
−2
0
2
4
c) PS
time − [sec]
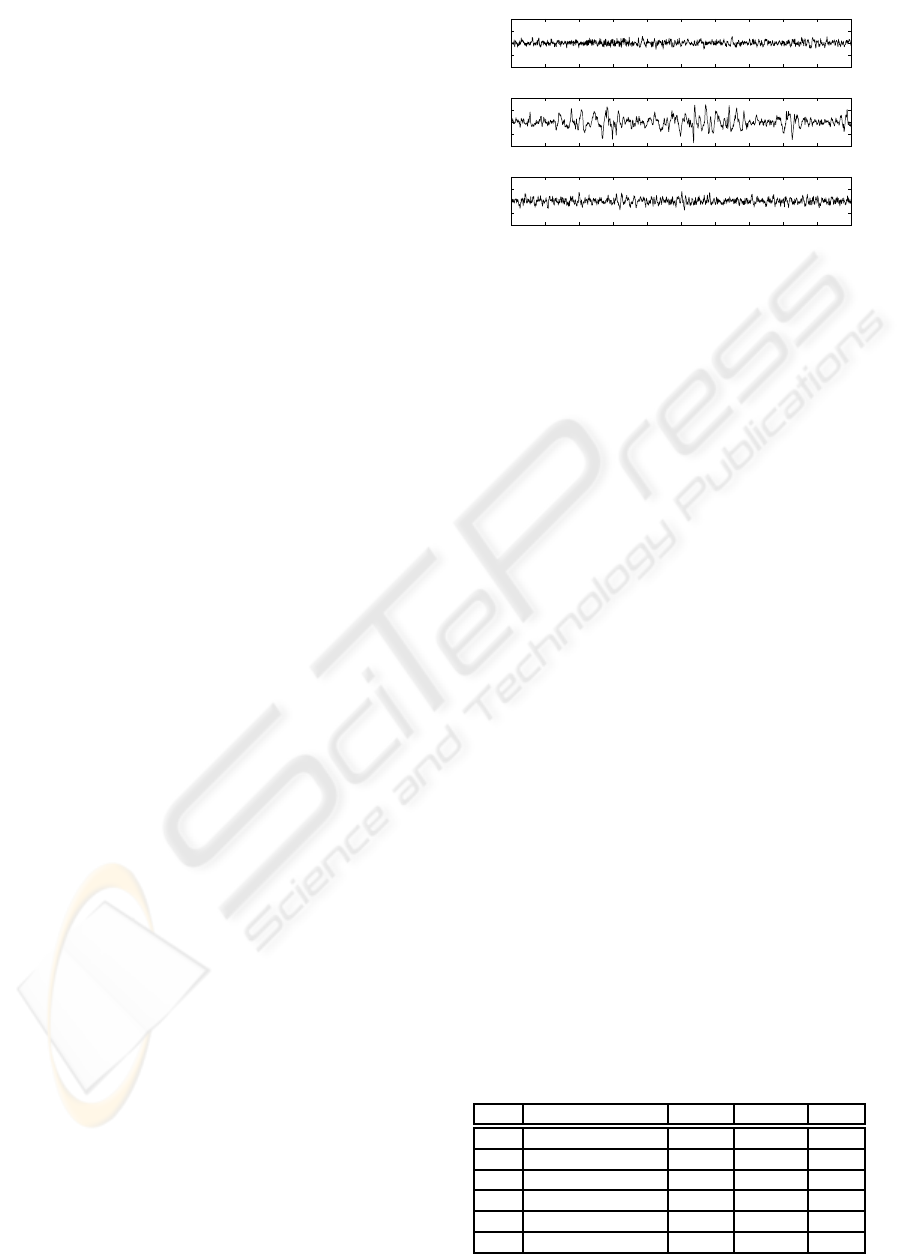
Figure 1: Rat EEG Signals at a) Awake, b) Slow Wave
Sleep, c) Paradoxical Sleep.
1. Awake (AW): AW epochs are characterized by
low amplitude EEGs with high θ (5-9 Hz) and γ
(30-55 Hz) power density and a high amplitude
EMG with phasic bursts.
2. Slow Wave Sleep (SWS): SWS epochs are iden-
tified by high amplitude EEG with a high δ (1-4
Hz) and spindles (10-14 Hz) power density and a
low amplitude EMG.
3. Paradoxical Sleep (PS): PS (Rapid Eye Move-
ment) was identified by a low amplitude EEG
with a predominant θ rhythm (5-9 Hz) and a con-
comitant low amplitude EMG reflecting the typi-
cal muscular atonia.
In Figure 1 a-c, examples of 10-seconds rat EEG sig-
nals from frontal cortex derivation are plotted for AW,
SWS and PS states, respectively.
All the segments with saturated sample points are
discarded from the analysis. In the data set, only the
three main sleep states are identified. However, it
is known that, at the sleep cycles, middle transition
sates are also present between main sleep states (Ger-
vasoni et al., 2004). These transition states may cre-
ate ambiguity during the search for best representative
and discriminative features. Therefore, the transition
segments that may correspond to possible transition
states are also excluded from the data base. The num-
bers of remaining segments after data cleaning are de-
scribed in Table 1 for all states and from each of the
six rats.
Table 1: The number of segments at each sleep states for six
rats.
Rat Time \ segments # AW # SWS # PS
1 208 min \ 1253 863 198 192
2 91 min \ 547 200 135 212
3 115 min \ 689 352 188 149
4 241 min \ 1446 930 467 49
5 194 min \ 1162 766 232 164
6 310 min \ 1860 784 869 207
BIOSIGNALS 2009 - International Conference on Bio-inspired Systems and Signal Processing
116

Table 2: Spectral Energy Bands.
Band Bandwidth (Hz)
δ
1
0.5 - 2.5
δ
2
2.5 - 4.0
θ
1
4.0 - 6.0
θ
2
6.0 - 8.0
α 8.0 - 12.0
β
1
12.0 - 20.0
β
2
20.0 - 45.0
3 METHODS
This section starts presenting two classical ap-
proaches based on the estimated power spectrum den-
sity of EEG time series. After describing the PSD-
based techniques, new feature sets based on EMD
analysis are proposed. Each data segment is normal-
ized before PSD or EMD analyses in order to have
unit energy within each 10-seconds segment.
3.1 PSD-based Features
3.1.1 Relative Bandwidths’ Energies
Several studies have shown relevance in parsing EEG
signals into different frequency bands. For instance,
(Goeller and Sinton, 1989) suggests to consider four
bands 1-3 Hz, 4-6 Hz, 6-10 Hz and 11-25 Hz; accord-
ing to (Ruigt et al., 1989), seven bands are relevant:
1-3 Hz, 3-6 Hz, 6-9 Hz, 9.5-20 Hz, 20-45 Hz, 49-51
Hz and 1-45 Hz; as for (Neckelmann et al., 1994),
only four bands are necessary:0.5-5 Hz, 6-9 Hz, 11-
16Hz, 20-60.5 Hz. We chose in the present study to
divide the frequency axis into seven different energy
bands as proposed in (Estrada et al., 2004; Hese et al.,
2001) and reported in Table 2.
The normalized PSD is estimated for each 10 sec-
onds EEG segment, and then partially integrated over
these seven frequency intervals. The resulting ener-
gies serve as input features of the sleep state classifi-
cation.
3.1.2 PSD-based Spectral Energy Ratios
In the second PSD-based approachdeveloped in (Ger-
vasoni et al., 2004), two specific spectral energy ratios
are defined and used as input features of a supervised
classifier. In (Gervasoni et al., 2004), Local Field
Potential (LFP) data is analyzed in order to exam-
ine sleep state transitions. Four frequency bands are
defined: 0.5-20Hz, 0.5-55H, 0.5-4.5Hz, 0.5-9Hz and
then the spectral amplitude ratios, r
1
and r
2
, are ob-
tained by dividing the integrated spectral amplitudes
over defined frequency bands:
r
1
=
R
20Hz
0.5Hz
P( f)d f
R
55Hz
0.5Hz
P( f)d f
r
2
=
R
4.5Hz
0.5Hz
P( f)d f
R
9Hz
0.5Hz
P( f)d f
(1)
where P( f) denotes the spectral amplitudes over the
frequency f. These ratios are heuristically chosen af-
ter a thorough search in order to obtain the best sepa-
ration of states. Numerators of the ratios are included
in the denominators to obtain more symmetrical dis-
tributions. The feature space for classification is con-
structed by two variables (r
1
, r
2
) calculated from each
segment.
3.2 EMD-based Features
EMD is an entirely data-driven (adaptive)method that
iteratively decomposes the analyzed signal into a set
of componentscalled Intrinsic ModeFunctions (IMF)
(Huang et al., 1998). In contrast with the Fourier or
the wavelet analyses, EMD adaptively extracts the in-
trinsic components that compose the signal without
necessitating to choose any a priori fixed basis. The
core of the algorithm is the so-called “sifting proce-
dure” which, locally in time, isolates the fastest os-
cillation in the signal. The resulting (possibly non-
stationary) component, referred to as the first intrinsic
mode function (IMF), is an amplitude and frequency
modulated waveform that corresponds to the signal
details at the finest time scales. This IMF is subtracted
from the original signal, and the same adaptive proce-
dure is applied to the remainder (low-pass approxi-
mation) to identify the second IMF, and recursively
for the next ones.
EMD has been successfully used in many biolog-
ical signal processing applications (see e.g. (Ziqiang
and Puthusserypady, 2007; Torres et al., 2007; Shara-
baty et al., 2006)), and we believe that EMD-based
features are also promising candidates for a more ro-
bust sleep state classification.
EMD is applied to each of the EEG signal ex-
amples shown in Figure 1 and the first 8 IMFs of
each signal are displayed in Figure 2-a. It was ob-
served that a N points time series generally decom-
poses into log
2
(N) IMFs (Huang et al., 1998; Rilling
et al., 2003). In our case, we most often obtained be-
tween 10 and 12 IMFs but only the first 8 are sys-
tematically considered as the frequencycontent of the
remainders lay below the physiologically meaningful
bandwidth (< 0.5Hz). As it can be seen in the fig-
ure, the IMFs reproduce the non-stationarities of the
signal at different characteristic time scales.
EMD-BASED ANALYSIS OF RAT EEG DATA FOR SLEEP STATE CLASSIFICATION
117
1000 2000 3000 4000 5000
−0.5
0
0.5
# 1
Awake
1000 2000 3000 4000 5000
−0.5
0
0.5
Slow Wave Sleep
1000 2000 3000 4000 5000
−0.5
0
0.5
Paradoxial Sleep
1000 2000 3000 4000 5000
−1
0
1
# 2
1000 2000 3000 4000 5000
−1
0
1
1000 2000 3000 4000 5000
−1
0
1
1000 2000 3000 4000 5000
−1
0
1
2
# 3
1000 2000 3000 4000 5000
−1
0
1
2
1000 2000 3000 4000 5000
−1
0
1
2
1000 2000 3000 4000 5000
−1
0
1
# 4
1000 2000 3000 4000 5000
−1
0
1
1000 2000 3000 4000 5000
−1
0
1
1000 2000 3000 4000 5000
−1
0
1
# 5
1000 2000 3000 4000 5000
−1
0
1
1000 2000 3000 4000 5000
−1
0
1
1000 2000 3000 4000 5000
−0.2
0
0.2
# 6
1000 2000 3000 4000 5000
−0.2
0
0.2
1000 2000 3000 4000 5000
−0.2
0
0.2
1000 2000 3000 4000 5000
−0.1
0
0.1
# 7
1000 2000 3000 4000 5000
−0.1
0
0.1
1000 2000 3000 4000 5000
−0.1
0
0.1
1000 2000 3000 4000 5000
−0.05
0
0.05
0.1
# 8
1000 2000 3000 4000 5000
−0.05
0
0.05
0.1
1000 2000 3000 4000 5000
−0.05
0
0.05
0.1
a)
0.5 2 5 10 25 50 100
0
0.02
0.04
0.06
0.08
0.1
AW
log(f)
Amplitude
0.5 2 5 10 25 50 100
0
0.02
0.04
0.06
0.08
0.1
SWS
log(f)
Amplitude
0.5 2 5 10 25 50 100
0
0.02
0.04
0.06
0.08
0.1
PS
log(f)
Amplitude
IMF−1
IMF−2
IMF−3
IMF−4
IMF−5
IMF−6
IMF−7
IMF−8
IMF−1
IMF−2
IMF−3
IMF−4
IMF−5
IMF−6
IMF−7
IMF−8
IMF−1
IMF−2
IMF−3
IMF−4
IMF−5
IMF−6
IMF−7
IMF−8
b)
8 7 6 5 4 3 2 1
0.5
1
2
5
10
25
50
AW
log(f)
IMF #
8 7 6 5 4 3 2 1
0.5
1
2
5
10
25
50
SWS
log(f)
IMF #
8 7 6 5 4 3 2 1
0.5
1
2
5
10
25
50
PS
log(f)
IMF #
c)
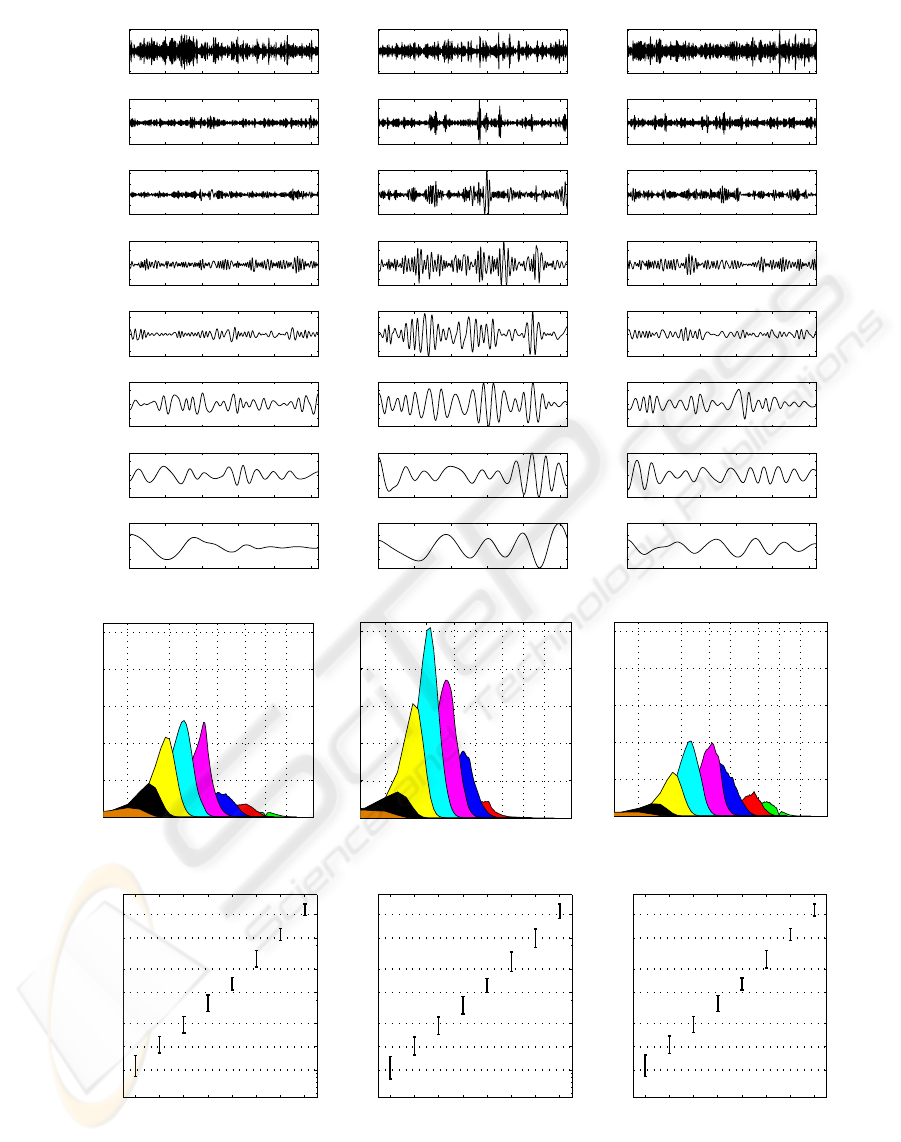
Figure 2: a) The first 8 IMFs of EEG Signals for AW (the 1
st
column), for SWS (the 2
nd
column) and for PS (the 3
rd
column)
states; b) Average PSD of IMFs at the states AW, SWS and PS (from left to right respectively); c) The logarithm of mean
values and the standard deviations of the peak frequencies of IMF spectra (EEG data segments are taken from rat-1).
BIOSIGNALS 2009 - International Conference on Bio-inspired Systems and Signal Processing
118
Note that, for broad band signals such as EEG,
EMD behaves like a dyadic filter bank (Flandrin et al.,
2003). In Figure 2-b, average PSDs of IMFs obtained
from EEG segments (at AW, SWS and PS states) are
given. It can be observed that the frequency struc-
tures of the automatically generated IMFs are similar
to that of artificially pre-defined EEG bands. For ex-
ample, the frequency content of the first IMF approx-
imately corresponds to the γ band (>30Hz), whereas
the second IMF overlaps with the β band (13 − 30
Hz). The third and the fourth IMFs also coincide with
the α (8− 13 Hz) and θ (3.5− 8 Hz) bands. A still
open question though, is to determine to which extent
these adaptively identified bandwidths correspond to
physical phenomena. Note that the frequency regions
that are automatically extracted by EMD are variable,
i.e. they are changing adaptively with the analyzed
signal. This can be seen from Figure 2-b that com-
pares the IMF spectra corresponding to the differ-
ent states. Moreover, the frequency peak distribution
(mean and variance) of each IMF spectrum, displayed
as box plots in Figure 2-c, show that characteristic
modes of a given state can also vary along time.
3.2.1 EMD-based Band Energies
As it is seen in Figure 2-b, the energies at some scales
are noticeably different for different states which can
be convenient for classification. Therefore, energies
of eight IMFs are individually considered as features
for sleep staging. This approach is similar to the
PSD-based relative frequency band energy features
given in Section 3.1.1. However, instead of defining
fixed bands beforehand, the bands are automatically
selected by the method.
3.2.2 EMD-based Spectral Energy Ratios
By considering the same frequency bands defined in
Section 3.1.2 the EMD-based spectral ratios can ap-
proximately mimic the PSD-based spectral ratios. It
is approximately identified which IMF lie in which
bandwidths considered in the energy ratios r
1
and r
2
defined in (1). The EMD based energy ratios are then
constructed as below:
r
1
=
∑
i∈(2,..,7)
P
IMF
i
∑
i∈(1,..,7)
P
IMF
i
r
2
=
∑
i∈(5,..,7)
P
IMF
i
∑
i∈(4,..,7)
P
IMF
i
(2)
Here P
IMF
i
is the energy of the i
th
IMF.
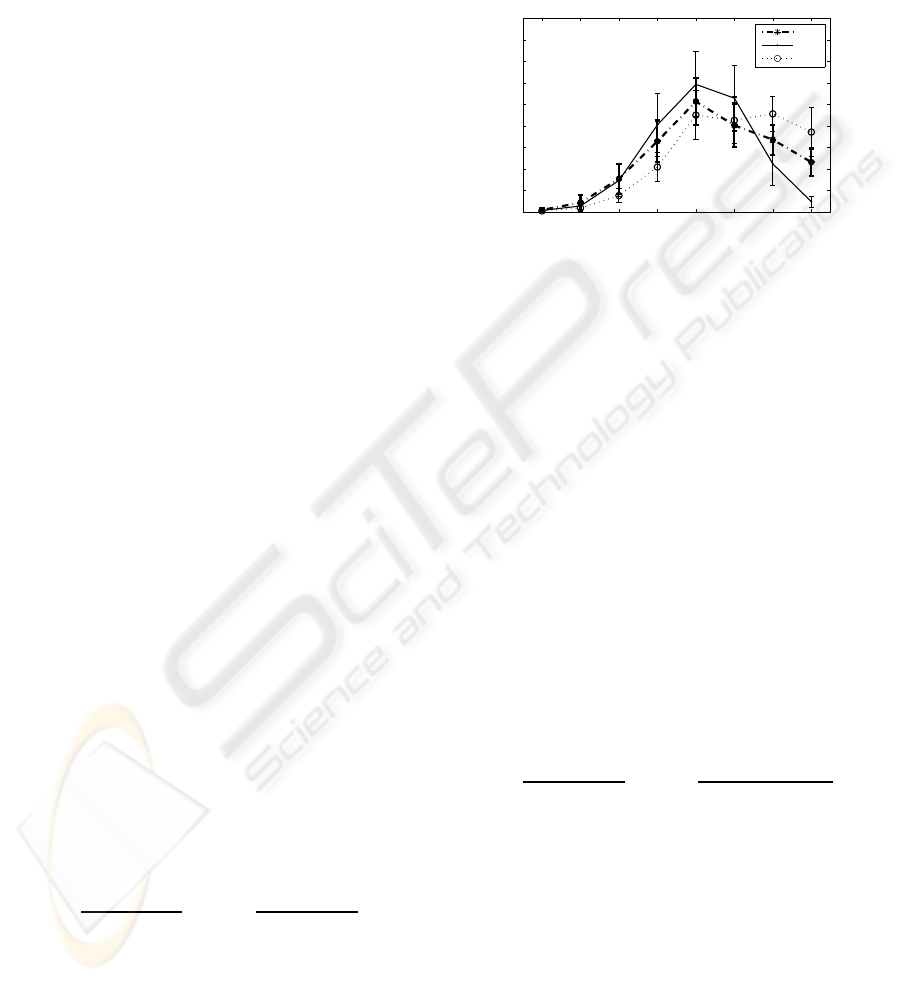
3.2.3 EMD-based New Spectral Ratios
EMD providelimited number of naturally dividedfre-
quency bands which make possible to search for ad-
ditional features. In Figure 3, the energy spectra of
IMFs are plotted for three sleep states. All six rats’
data are combined and the mean and the standard de-
viations of the IMF energies are calculated. This fig-
ure is utilized to search for new energy ratios that may
provide better separation of the classes.
8 7 6 5 4 3 2 1
0
0.05
0.1
0.15
0.2
0.25
0.3
0.35
0.4
IMF #
Mean IMF Energies +− σ
IMF Enegry Spectrum
AW
SWS
PS
Figure 3: IMF Energy Spectra (the mean and the standard
deviation of the IMF energies) of three sleep states.
We define two new ratios. The first ratio is defined
for separation of AW and SWS states. It is slightly
different than the ratio in (2) (6
th
and the 7
th
IMF en-
ergies are removed from the ratio since they are not
significantly different for AW and SWS states as it is
seen in Figure 3).
The second ratio is defined for the separation of
AW and PS states. It is observed in Figure 3 that the
energies at the first two IMFs obtained from PS state
are higher than the energies of IMFs obtained from
AW state. In contrast, the energies of IMFs from AW
at last four scales (5, 6, 7, 8) are higher than the ener-
gies of IMFs from PS state. Considering these obser-
vations, the second ratio is defined as the total energy
of the first two IMFs over the total energy of the last
four IMFs. Similar to the previously defined ratios,
the denominator includes also the numerator compo-
nents:
r
1
=
∑
i∈(2,..,5)
P
IMF
i
∑
i∈(1,..,5)
P
IMF
i
r
2
=
∑
i∈(1,2)
P
IMF
i
∑
i∈(1,2,5,6,7,8)
P
IMF
i
(3)
The two PSD-based and the threeEMD-based fea-
ture sets defined in the previous Sections are used as
input features of a supervised classifier of EEG data.
Results are compared in the next section.
4 STATISTICAL ANALYSIS AND
RESULTS
A simple supervised classifier is used by fitting a mul-
tivariate normal density to each class. Several classi-
EMD-BASED ANALYSIS OF RAT EEG DATA FOR SLEEP STATE CLASSIFICATION
119

fication parameters are provided for each feature set
as a measure of classification performances:
• Sensitivity (Sns.) and Specificity (Spc.): Sensi-
tivity is the proportion of the correctly identified
(true positives) segments that actually belong to
the class and specificity is the proportion of the
correctly identified (true negatives) segments that
actually do not belong to the class.
• Omission Error (ε
o
) and Commission Error (ε
c
):
ε
o
is the proportion of the omitted segments that
actually belong to the class (ε
o
= 1 - Sns.). ε
c
is the
proportion of the segments classified as the corre-
sponding class where they actually do not belong
to the class (ε
c
= 1 - Spc.).
• Overall Accuracy (Acc.): Accuracy is the propor-
tion of the truly classified segments in the whole
population.
• Kohen’s Kappa (κ): κ is a measure of agree-
ment between the manual and automatic staging.
1 > κ > 0.81 indicates almost perfect agreement,
whereas 0.8 > κ > 0.61 and 0.6 > κ > 0.41 indi-
cate substantial and moderate agreements respec-
tively. This parameter is different from the overall
agreement in the sense that it removes the effects
of the agreements occurred by chance. κ is calcu-
lated as: κ =
P
0
−P
c
1−P
c
where P
0
is the overall agree-
ment between manual and automatic staging, and
P
c
is the expected agreement by chance (Cohen,
1960).
• ConcordanceTable (Confusion Matrix): The frac-
tion of the data which was classified as each of
the existing classes are given in concordance ta-
bles. In these tables, each row represents the ac-
tual class whereas each column representsthe pre-
dicted class.
We hold two different scenarios of classification ex-
periment.
• Self Classification: In the first group experiment,
all the data from the six rats are gathered and a
5-folds cross validation is used. Since the training
and the test data are selected from the same data
pool, this experiment is called self-classification
throughout the paper.
• Cross Classification: In the second group exper-
iment, we train the classifier with mixed data
coming from only five rats, and test the algo-
rithm with the remaining sixth rat’s EEG. This
procedure is repeated for all possible combina-
tions of the rats and only the mean classification
rates are provided. We refer to this experiment as
cross-classification. The aim of this experiment
is to assess the robustness of the features to inter-
individual variability.
4.1 Self-classification Experiments
4.1.1 PSD-based Band Energies vs. EMD-based
Band Energies
Self-classification results (mean ± standard devia-
tion of each performance parameters) obtained by the
PSD-based and EMD-based band energy features are
given in Tables 3 and 4. It is observed in the con-
cordance tables that the separation of SWS class from
the other two classes is attains a high matching score
(with ∼ 96− 98%) by both PSD and EMD based fea-
tures. On the other hand, separation of AW and PS
states is more arduous. Yet, the energies computed
over the adaptively EMD-selected bandwidths pro-
vide relatively better results. Indeed, the omission
error of AW state decreases of about 7% and the com-
mission error of PS state gains 18%. As we can see,
simply replacing the pre-fixed bands with the ones
that are automatically identified by EMD provides a
3% increase on the overall accuracy and a 0.04 me-
lioration of κ index. This shows that even within the
same rat’s EEG, the frequency content relative to a
given state, can vary from one time segment to the
other (as it can be seen in Figure 2-c), and that auto-
matic band selection is an encouraging alternative to
handle this non-stationarity.
4.1.2 PSD-based Energy Ratios vs. EMD-based
Energy Ratios
Self classification results for PSD-based spectral ra-
tios and for their EMD-based counterpart are given in
Table 5 and 6, respectively. Similarly to the band en-
ergy features, SWS class is easily distinguished from
the other two classes (∼ 96−97%agreement) by both
PSD and EMD-based ratios. However, discrimination
of AW and PS classes is relatively worse. For PSD-
based ratios, 23% of AW segments are classified as
PS and 15% of PS segments are classified as AW. By
using EMD-based ratios, these percentages lower to
18% and 12% respectively. Overall accuracy also gets
better, with a 3% upgrade, whereas κ index increases
of about +0.04.
As it is explained in Section 3.2.3, in order to have
better separation between AW and PS classes, new
EMD-based ratios were defined. The classification
results are provided in Table 7. Compared to the PSD-
based ratios’ results of Table 5, EMD-based new ra-
tios pull the omission for AW class from 24% down to
17%. Omission of PS class also decreases from 16%
to 11%. Overall accuracy improves by 4.6% and the
BIOSIGNALS 2009 - International Conference on Bio-inspired Systems and Signal Processing
120
κ gain is 0.07. For similar reasons to the ones evoked
in the preceding paragraph, it is very likely that the
adaptivity of EMD turns the energy ratios more ro-
bust to non-stationarities.
4.2 Cross-classification Experiments
The aim of this experiment is to investigate the ro-
bustness of the feature sets to the inter-individualvari-
ability. The results obtained for the cross classifi-
cation experiment are presented in Table 8. As for
the self classification, EMD features globally provide
better classification performances. Again the differ-
ences stem from a better separation between AW and
PS states. For example, compared to PSD-based en-
ergy ratios, EMD-based new energy ratios increases
the sensitivity for AW and PS classes by 9% and 7%,
respectively. The specificities also improve (4% and
13%), as well as the overall accuracy (about 5.5%)
and the κ index which raises by +0.09. Improvements
of the same order of magnitude can be observed in the
same table for frequency bands features. Altogether,
these results demonstrate that EMD-based features,
through their adapted bandwidth selection, fit better
the individual characteristics. Indeed, IMFs convey
a spectral information (notably the frequency band-
width) that can significantly vary from one individual
to the other. Then, as the ratios defined in expres-
sions (3) solely imply IMFs indices, they can natu-
rally adapt to the spectral specificities of each indi-
vidual.
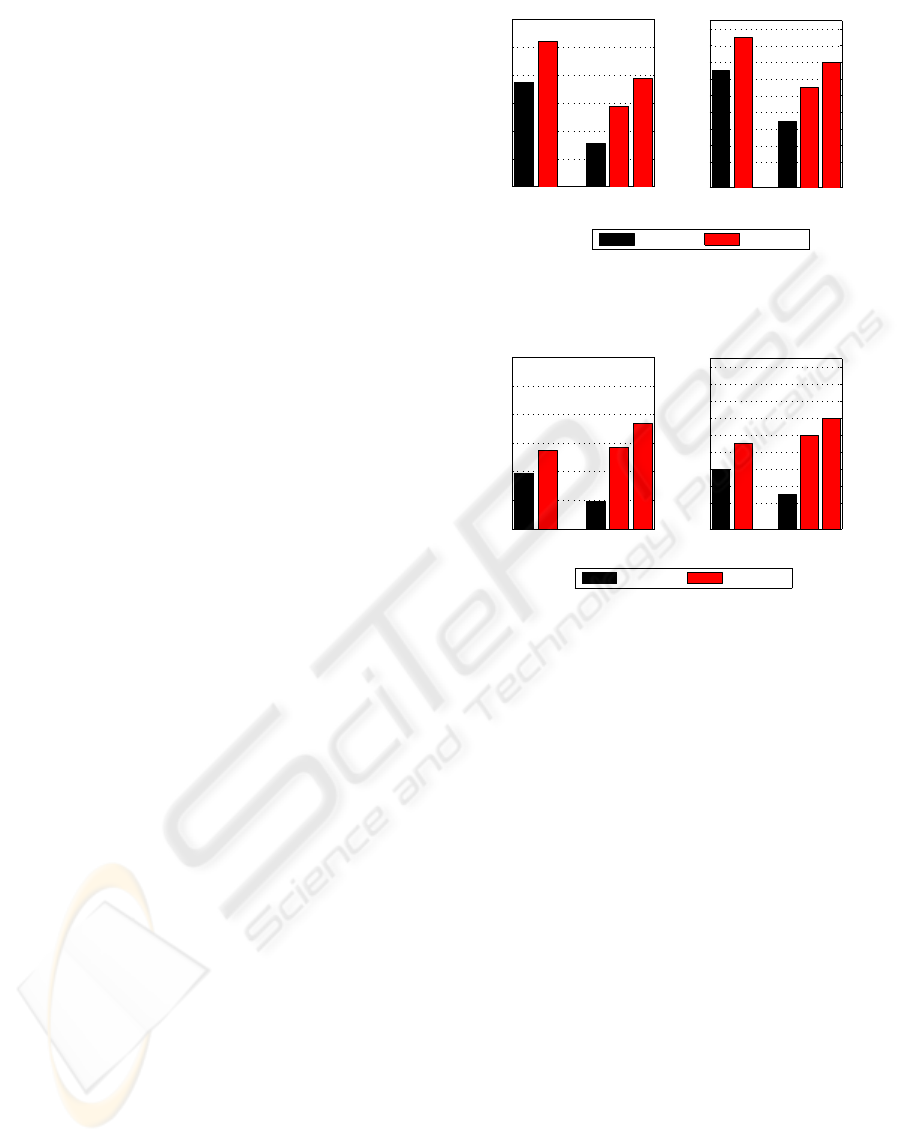
For better visual comparison, overall accuracies
and κ values obtained with PSD and EMD-based fea-
ture sets are bar-plotted in Figures 4 and 5.
Another interesting outcome of this experiment is
that in cross classification EMD-based energy ratios
outperform the EMD-based energy bands whereas it
is the opposite for self-classification. The overall ac-
curacy and the κ values of EMD-based ratios are sen-
sibly the same for self and cross classifications. With
EMD-based energy bands, the performancedecreases
for the cross classification. This can be explained as
follows. When test and training data are selected from
different subjects, energies at some scales (mostly
coarse scales corresponding to low frequency compo-
nents) may substantially vary affecting thus the clas-
sification performance. With energy ratios however,
since they combine the energies at different scales,
this local energy variability is less penalizing.
80
82
84
86
88
90
92
a) Accuracy
Accuracy %
PSD−Based EMD−Based
0.68
0.7
0.72
0.74
0.76
0.78
0.8
0.82
0.84
b) Cohen’s κ
κ
PSD
Bands
EMD
Bands
PSD
Ratio
EMD
Ratio
EMD
New
Ratio
PSD
Bands
EMD
Bands
PSD
Ratio
EMD
Ratio
EMD
New
Ratio
Figure 4: Final comparison of the classification perfor-
mances (First group classification).
80
82
84
86
88
90
92
a) Accuracy
Accuracy %
PSD−Based EMD−Based
0.68
0.7
0.72
0.74
0.76
0.78
0.8
0.82
0.84
b) Cohen’s κ
κ
PSD
Bands
EMD
Bands
PSD
Ratio
EMD
Ratio
EMD
New
Ratio
PSD
Bands
EMD
Bands
PSD
Ratio
EMD
Ratio
EMD
New
Ratio
Figure 5: Final comparison of the classification perfor-
mances (Second group classification).
5 CONCLUSIONS AND FUTURE
WORKS
In this paper EMD is applied to rat EEG signals in
order to extract features for sleep state classification.
The results obtained from EMD-based features are
compared to those obtained from PSD-based features,
and show that EMD-based techniques are particularly
adapted to analyze non-stationary signals, such EEGs
or any otherbiophysical signals. Since EMDis a data-
driven technique that naturally decomposes the data
into intrinsic components, it removes the necessity of
a hazardous fixed band division. Adaptivity of EMD
also yields a more robust classification with respect to
the inter-individual variability.
In addition, as the sifting process performs locally
in time, a on-line version of the EMD algorithm was
proposed in (Rilling et al., 2003). Then, we could
use this to adapt our EMD-based classifier to contin-
uous time, with no prior segmentation of the signal
needed. This approach would permit sleep state mon-
itoring with real-time classification and detection of
transition points.
EMD-BASED ANALYSIS OF RAT EEG DATA FOR SLEEP STATE CLASSIFICATION
121

Table 3: Self classification performances after using PSD-based spectral band energy features.
AW SWS PS ε
o
ε
c
AW 0.84±0.01 0.02±0.00 0.14±0.01 0.16±0.01 0.07±0.00
SWS 0.02±0.00 0.98±0.00 0.00±0.00 0.02±0.01 0.04±0.01
PS 0.20±0.01 0.01±0.00 0.79±0.01 0.21±0.02 0.42±0.01
Spc.=82.5%±0.4 Sns.=86.8%±0.4 Acc.=87.5%±0.4 κ=0.79±0.01
Table 4: Self classification performances after using EMD-based spectral band energy features.
AW SWS PS ε
o
ε
c
AW 0.91±0.01 0.03±0.00 0.06±0.01 0.09±0.01 0.08±0.01
SWS 0.04±0.01 0.96±0.01 0.00±0.00 0.04±0.01 0.06±0.01
PS 0.22±0.02 0.01±0.01 0.77±0.02 0.23±0.02 0.25±0.02
Spc.= 87.1%±0.7 Sns.=87.9%±0.7 Acc.=90.4%±0.4 κ=0.83±0.01
Table 5: Self classification performances after using PSD-based spectral energy ratios.
AW SWS PS ε
o
ε
c
AW 0.76±0.02 0.01±0.00 0.23±0.02 0.24±0.02 0.07±0.01
SWS 0.03±0.01 0.97±0.01 0.01±0.00 0.03±0.01 0.03±0.00
PS 0.16±0.02 0.00±0.01 0.84±0.02 0.16±0.03 0.53±0.02
Spc.=79.4%±0.6 Sns.=85.4%±0.8 Acc.=83.2%±0.9 κ=0.73±0.01
Table 6: Self classification performances after using EMD-based spectral energy ratios.
AW SWS PS ε
o
ε
c
AW 0.80±0.01 0.02±0.00 0.18±0.01 0.20±0.01 0.06±0.01
SWS 0.03±0.01 0.96±0.00 0.01±0.00 0.04±0.00 0.04±0.01
PS 0.12±0.02 0.01±0.00 0.88±0.02 0.12±0.02 0.46±0.02
Spc.=81.6%±0.9 Sns.=87.8%±1.0 Acc.=85.8%±0.9 κ=0.77±0.01
Table 7: Self classification performances after using EMD-based new ratios.
AW SWS PS ε
o
ε
c
AW 0.83±0.01 0.02±0.00 0.15±0.01 0.17±0.01 0.05±0.01
SWS 0.03±0.01 0.96±0.01 0.01±0.00 0.04±0.01 0.04±0.01
PS 0.11±0.02 0.01±0.00 0.89±0.02 0.11±0.02 0.41±0.02
Spc.=83.4%±0.7 Sns.=89.2%±0.9 Acc.=87.8%±0.6 κ=0.80±0.01
Table 8: Cross classification results. The data from five rats are used for training and the remaining rat’s data is used for
testing. The procedure repeated for all rats and the mean values are provided.
AW SWS PS Mean Mean
Methods Spc. Sns. Spc. Sns. Spc. Sns. Spc. Sns. Acc. κ
PSD-Bands 89.7 79.2 92.7 96 56.7 74.8 79.7 83.3 84.0 0.72
EMD-Bands 91.5 80.2 87.1 98.4 69.5 78.7 82.7 85.8 85.5 0.75
PSD-Ratios 89.5 73.6 98.2 91.4 47.5 81.8 78.4 82.3 81.9 0.69
EMD-Ratios 93.0 79.5 96.7 95.7 54.7 87.1 81.5 87.4 85.7 0.76
EMD-New 93.4 82.2 96.6 95.3 60.0 88.1 83.3 88.6 87.4 0.78
BIOSIGNALS 2009 - International Conference on Bio-inspired Systems and Signal Processing
122

ACKNOWLEDGEMENTS
S¨uleyman Baykut’s work is supported by “The
Scientific and Technological Research Council of
Turkey-The Department of Science Fellowships and
Grant Programmes (TUBITAK-BIDEB)” with the
programme # 2214.
REFERENCES
Cohen, J. (1960). A coeeficient of agreement for nominal
scales. In Educational and Psychological Measure-
ment. Vol. 20, pp. 37-46.
Corsi-Cabrera, M., P´erez-Garci, E., Rio-Portilla, Y. D.,
Ugalde, E., and Guevara, M. A. (2001). EEG bands
during wakefulness, slow-wave, and paradoxical sleep
as a result of principal component analysis in the rat.
In Sleep. Vol. 24, No. 4.
Estrada, E., Nazeran, H., Nava, P., Behbehani, K., Burk,
J., and Lucas, E. (2004). EEG feature extraction for
classification of sleep stages. In Proc. of the 26th An-
nual International Conference of the IEEE EMBS. San
Francisco, USA.
Flandrin, P., Rilling, G., and Goncalves, P. (2003). Empiri-
cal mode decomposition as a filter bank. In IEEE Sig.
Proc. Lett. Vol. 11, No. 2, Part 1, pp. 112- 114.
Gervasoni, D., Lin, S., Ribeiro, S., Soares, E., Pantoja, J.,
and Nicolelis, M. (2004). Global forebrain dynam-
ics predict rat behavioral states and their transitions.
In The Journal of Neuroscience. Vol. 24, No. 49, pp.
11137-11147.
Goeller, C. J. and Sinton, C. M. (1989). A microcomputer-
based sleep stage analyser. In Computer Methods and
Programs in Biomedicine. Vol. 29, No. 1, 316.
Gottesmann, C., Lacoste, G., Rodrigues, L., Kirkham, P.,
Arnaud, C., and Rallo, J. L. (1976). Method of auto-
matic analysis and quantification of wakefulness-sleep
behavior in the rat. In Rev. Electroencephalogr. Neu-
rophysiol. Clin. Vol. 6, pp. 37-49.
Hese, P. V., Philips, W., Koninck, J. D., de Walle, R. V.,
and Lemahieu, I. (2001). Automatic detection of sleep
stages using the EEG. In Proc. of the 23rd Annual
International Conference of the IEEE EMBS. Istanbul,
Turkey.
Huang, N., Shen, Z., Long, S., Wu, M., Shih, H., Zheng,
Q., Yen, N. C., Tung, C. C., and Liu, H. (1998). The
empirical mode decomposition and hilbert spectrum
for nonlinear and nonstationary time series analysis.
In Proc. Roy. Soc. London A. Vol. 454, pp. 903-995.
Neckelmann, D., Olsen, O. E., Fagerland, S., and Ursin,
R. (1994). The reliability and functional validity of
visual and semi-automatic sleep:wake scoring in the
moll-wistar rat. In Sleep. Vol. 17, No. 2, pp. 12031.
Ning, T., Joseph, D., and Bronzino, D. (1990). Bispectral
analysis of the rat EEG during REM sleep. In Proc.
of the Annual International Conference of the IEEE
EMBS. Vol. 12, No. 5.
Rilling, G., Flandrin, P., and Goncalves, P. (2003). On em-
pirical mode decomposition and its algorithms. In
IEEE-EURASIP Workshop on Nonlinear Signal and
Image Processing NSIP-03. Grado.
Robert, C., Guilpin, C., and Limoge, A. (1999). Automated
sleep staging systems in rats. In Journal of Neuro-
science Methods. Vol. 88, No.2, pp. 111-122.
Ruigt, G. S. F., Proosdij, J. N. V., and Delft, A. M. L. V.
(1989). A large scale, high resolution, automated sys-
tem for rat sleep staging i. In Methodology and techni-
cal aspects. Electroencephalogr. Clin. Neurophysiol.
Vol. 73, pp. 52-63.
Sharabaty, H., Martin, J., Jammes, B., and Esteve, D.
(2006). Alpha and theta wave localisation using
hilbert-huang transform: Empirical study of the ac-
curacy. In Proc. of IEEE Information and Communi-
cation Technologies-ICTTA. Vol. 1, pp. 1159-1164.
Timo-Iaria, C., Negrao, N., Schmidek, W. R., Hoshino, K.,
de Menezes, C. E. L., and da Rocha, T. L. (1970).
Phases and states of sleep in the rat. In Physiol. Behav.
Vol. 5, pp. 1057-1062.
Torres, A., Fiz, J. A., Jan´e, R., Galdiz, J. B., Gea, J., and
Morera, J. (2007). Application of the empirical mode
decomposition method to the analysis of respiratory
mechanomyographic signals. In Proc. of the 29th
Annual International Conference of the IEEE EMBS.
Lyon, France.
Vivaldi, E. A. and Bassi, A. (2006). Frequency domain
analysis of sleep EEG for visualization and automated
state detection. In Proc. of the 28th Annual Interna-
tional Conference of the IEEE EMBS. New York City,
USA.
Vyazovskiy, V. V., Borb´ely, A. A., and Tobler, I. (2002).
Interhemispheric sleep EEG asymetry in the rat is en-
hanced by sleep deprivation. In J. Neurophysiology.
Vol. 88, pp. 2280-2286.
Winson, J. (1974). Patterns of hippocampal theta rhythm
in the freely moving rat. In Electroencephalogr. Clin.
Neurophysiol. Vol. 36, pp. 291-301.
Ziqiang, Z. and Puthusserypady, S. (2007). Analysis of
schizophrenic EEG synchrony using empirical mode
decomposition. In Proc. of 15th Int. Conference on
Digital Signal Processing. pp. 131-134, Cardiff, Eng-
land.
EMD-BASED ANALYSIS OF RAT EEG DATA FOR SLEEP STATE CLASSIFICATION
123
