
APPLICATION OF NEURAL NETWORKS IN AID FOR
DIAGNOSIS FOR PATIENTS WITH GLAUCOMA
Dário A. B. Oliveira, Marley M. B. R. Vellasco
Electrical Engineering Department, Pontifical Catholic University of Rio de Janeiro - Rio de Janeiro, RJ, Brazil
Mariana M. B. Oliveira, Riuitiro Yamane
Medical Sciences Faculty, Department of Opthtalmology, Rio de Janeiro State University - Rio de Janeiro, RJ, Brazil
Keywords: Neural Networks, Glaucoma, Computer Aided Diagnosis, Multi-Layer Perceptron.
Abstract: Glaucoma is an ophthalmologic disease very difficult to diagnose in the earlier phase. Additionally, exams
and methods used to give reliable information for correct diagnosis are usually very expensive. Therefore,
other methods less expensive and also reliable must be proposed as an auxiliary tool to Glaucoma diagnosis.
This paper analyzes the performance of neural networks as an auxiliary tool for the diagnosis of patients
with glaucoma, avoiding the use of data only available in expensive exams. The analysis considers two
different kinds of neural networks (Multi-Layer Perceptron (MLP) and Probabilistic Neural Networks
(PNN)) and two different methods variable selection: a random and iterative method; and the Least Square
Extrapolation (LSE) method. The paper also evaluates the benefits of applying principal components
analysis (PCA) to the database. The results obtained were very good, attaining an accuracy of more than
90% of correct classification of all cases present in our database. It confirms the real possibility of using
neural networks as an auxiliary and inexpensive tool to help in Glaucoma diagnosis.
1 INTRODUCTION
Advances in medicine increase daily the volume of
data to be analyzed by experts. This large amount of
data often makes it harder the definition of a profile
of diagnosis using all available information and
based only on past experience. Computational
intelligence methods may be used in this context,
since they are able to acquire knowledge through
historical data, obtained from patient examinations
and diagnose, and provide a decision support system
to help in the glaucoma diagnosis.
The human visual system is extremely complex
and functional loss of vision, as in glaucoma, affects
in a significant way the quality of life. Glaucoma is a
disease of the optic nerve and is the leading cause of
irreversible blindness and the second leading cause
of low vision in the world, affecting about 67
million people. It usually has a slow progression,
and can lead to blindness in 27% of cases.
More than half of people with glaucoma is not
diagnosed, since ill patients are rarely symptomatic
before submitting an advanced degree of injury of
ganglion cells and, consequently, changes in the
visual field (Quigley, 1996; Hattenhauer et al, 1998).
The presence of changes in visual field represents an
injury of 30%-50% of ganglion cells, which
represents an advanced injury (Kerrigan-Baumring
et al. 2000). The irreversible nature of injuries
makes the diagnosis and early treatment essential.
An analysis of extreme importance in the
diagnosis of glaucoma is the assessment of nerve
fibre layer (NFL) of the retina, which is composed
of ganglion cells axons, among other cells (Hoyt et
al, 1972). Various methods are available to assess
the NFL. One example is the direct ophthalmoscopy
or red-free photographs, allowing a qualitative and
semi-quantitative analysis. However, photographs of
good quality depend on the patient level of
cooperation, maximum pupil dilation, trained
photographer and other factors, such as pigmentation
of the retinal pigmented epithelium, which can
difficult the nerve fibres identification as it changes
the nerve fibres reflection. Therefore, it is a
subjective analysis, since it depends on the examiner
experience (Quigley et al, 1993).
139
A. B. Oliveira D., M. B. R. Vellasco M., M. B. Oliveira M. and Yamane R. (2009).
APPLICATION OF NEURAL NETWORKS IN AID FOR DIAGNOSIS FOR PATIENTS WITH GLAUCOMA.
In Proceedings of the International Conference on Bio-inspired Systems and Signal Processing, pages 139-145
DOI: 10.5220/0001547401390145
Copyright
c
SciTePress
The HRT (Heidelberg Retina Tomograph), a
confocal laser scanning ophthalmoscope, is another
technique for easy operation, rapid acquisition and
useful to obtain images without dilation of the pupil,
but it is not able to measure the layer of nerve fibres
directly. It calculates the NFL from a plan of
reference, based on studies of histological NFL in
monkeys. If used with diagnostic purposes, there is a
degree of overlap between the patients with and
without glaucoma.
One of the most currently used methods, due to
its high precision, is optical coherence tomography
(OCT). The OCT is a method capable of providing
images of the retina nerve fibres layer through
transverse sections with high resolution (8-10 μ m),
described by Huang et al in 1991, in vivo or in vitro.
This technique is based on the principle of low
coherence interferometry, creating two-dimensional
images with information of distance and thickness of
retinal structures.
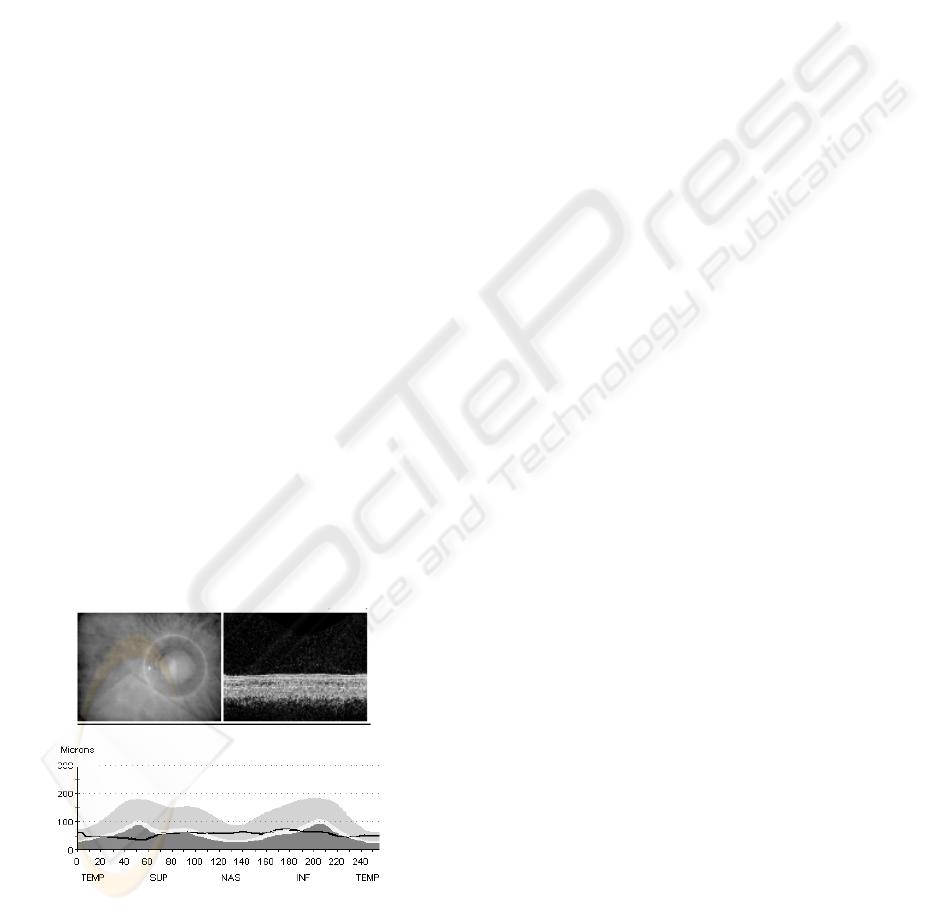
The final image provided by OCT is produced
based on code of colors, processed by a computer, as
shown in Figure 1. Figure 1-a illustrates the eye
background image and the retina nerve fibres layer.
Bright gray indicates greater concentration of nerve
endings. Figure 1-b shows the thickness of retinal
NFL distributed spatially into four different regions:
superior, temporal, inferior and nasal. The graph
shows the spatial distribution of the retinal NFL
thickness in black, and a benchmark in gray levels,
where the region in dark gray indicates healthy
patient, the region in white in between the two gray
regions indicates a patient with a possible presence
of dysfunction, and the light gray region indicates
the presence of dysfunction.
Figure 1: Image of the retina with information obtained by
the OCT.
Although this examination provides very precise
information about the retinal NFL, which is used in
glaucoma diagnosis, it is important to stress that it is
an expensive examination. Therefore, this work
intends to propose a much cheaper alternative that
still can obtain satisfactory results in the
identification of retinal dysfunction in NFL. The
proposed method only uses variables that can be
obtained through cheaper examinations, and it is
based on neural networks.
Artificial neural networks are systems inspired
on biological neurons and on the ability of the brain
to process information in a massively parallel way.
These systems are able to acquire knowledge
experimentally and to properly respond to new
cases.
A neural network is represented by weighted
interconnections between processing elements (PEs).
These weights are the parameters that actually define
the non-linear function performed by the neural
network. The process of determining such
parameters is called training or learning, relying on
the presentation of many training patterns. Thus,
neural networks are inherently adaptive, conforming
to the imprecise, ambiguous and faulty nature of
real-world data. Learning procedures can be either
supervised or unsupervised. In supervised learning, a
training pair, consisting of an input pattern and the
target output, is submitted to the network. The
network usually adjusts the weights based upon the
error value between the target and the network
output. Unsupervised learning procedures, on the
other hand, classify input patterns without requiring
information on target output. In such procedures, the
network must detect the patterns' regularities,
classifying them into disjoint groups according to
their feature similarities.
This paper assesses the ability of neural networks
(Haykin, 1994), based on supervised learning, to
properly classify patients with dysfunction in retinal
NFL, an indication of the presence of glaucoma,
based on variables obtained in simpler and cheaper
exams than OCT.
It compares the performance of two neural
network models: Multi-Layer Perceptron (MLP)
(Rumelhart et al, 1986), and probability neural
networks (PNN) (Wasserman et al, 1993). For both
MLP and PNN models, two different methods of
selection of variables were tested: a random and
repetitive, and another that uses least square
extrapolation (LSE) (Roxana et al, 2005) (Chung,
2000).
The database was also decomposed into its
principal components (PCA) (Krzanowski, 1988), in
order to assess the importance of this transformation
(
a
)
(b)
BIOSIGNALS 2009 - International Conference on Bio-inspired Systems and Signal Processing
140

in increasing the neural network rate of proper
identification for this application.
The article has three additional sections, which
explain in more details, the proposed study. Section
2 describes in details the database obtained and the
neural networks modeling. Section 3 shows the
results obtained and section 4 presents the main
conclusions that this work has generated.
2 GLAUCOMA DIAGNOSIS
THROUGH NEURAL
NETWORKS
2.1 Medical Database
The input database used to classify patients was
generated from results obtained with the Optical
Coherence Tomography of Stratus OCT 3.0 (Carl
Zeiss Meditec) and consists of 256 samples. Values
of 14 different input variables were catalogued, as
well as the status of the dysfunction in retinal NFL.
This dysfunction indicates the presence of glaucoma.
The input variables are:
1. Age
2. Sex
3. Rim Area
4. Average width of nerve
5. Diameter of Disk
6. Diameter of Excavation
7. Width of Rim
8. The proportion of excavation area and disk area
9. The proportion of excavation horizontal diameter
and disk horizontal diameter
10. The proportion of excavation vertical diameter
and disk vertical diameter
11. Thickness of the superior region of retinal NFL
12. Thickness of the nasal region of retinal NFL
13. Thickness of the inferior region of retinal NFL
14. Thickness of the temporal region of retinal NFL
Among the input variables, age is an important
risk factor associated with glaucoma. The rim, or
neuroretinal ring, can be considered as an equivalent
intrapapillary NFL of the retina, and measures about
width, diameter and values of areas are physical
measurements of the human eye. In normal
individuals, the inferior neural rim is usually thicker,
followed by the superior, nasal and temporal. In
glaucoma, there is mainly loss of rim nerve in
superior and inferior poles. Variables 11 to 14
represent the thickness of retinal NFL, for each
region, in micrometers (μ m).
The classification of the dysfunction is obtained
with the commercial software that comes with OCT.
In the process, the values of variables 11, 12, 13 and
14 of each patient are submitted to a specific
function, whose expression is not provided by the
software, and that determines whether or not the
patient has some dysfunction in retinal NFL. These
four variables can be obtained only using this
specific exam, and neural networks will be used to
identify the same dysfunction using other variables,
that can be obtained through cheaper exams.
2.2 Neural Network Modeling
All numerical variables (1, 3 to 14) were normalized
according to their range, in order to remain in the
interval [0, 1]. The following normalization equation
was used:
minmax
min
xx
xx
x
i
i
−
−
=
(1)
The variable sex was codified in binary (0 for
female and 1 for male).
The class output was also coded in binary form,
0 being the code of patients whose configuration of
retinal NFL indicates a healthy patient and 1 the
code for patients whose configuration is
pathological. The specification in the database of the
presence or absence of dysfunction in retinal NFL
was obtained by examination of the OCT response
(see Figure 1).
As already mentioned, two different neural
network models were evaluated: Multi-Layer
Perceptron (MLP) and Probabilistic Neural Network
(PNN). The structure of the MLP networks was
composed of a single intermediate or hidden layer in
all performed experiments. The number of neurons
(processing elements) varied according to the
experiment, as discussed on the next section.
Due to the binary definition of the output
codification, the MLP neural networks output
consists of a single node, whose real value between
0 and 1 indicates the likelihood of NFL retinal
dysfunction, given a particular individual in the
entry. It was assumed that a value greater than 0.5
indicates dysfunction and a value lower than 0.5
indicates a healthy patient.
The structure of PNN networks is defined
according to the number of patterns in the training
group, and the output layer is treated exactly like the
output layer of MLP networks.
The cross-validation method (Kohavi, 1995) was
used for training the MLP networks, with 50% of the
APPLICATION OF NEURAL NETWORKS IN AID FOR DIAGNOSIS FOR PATIENTS WITH GLAUCOMA
141

population for training, 25% for validation and 25%
for testing. In PNN networks, the proportion was
75% of the population for training, and 25% for
testing. The samples were distributed in a balanced
way between sets, that is, both sets of patients with
pathological and healthy profiles were divided using
similar proportions.
It is important to mention that the set of
validation was used to determine the optimal
configuration of the network, in terms of number of
processors in the hidden layer and to avoid over
training. The same set of test was used through all
networks configurations. The results presented in the
next section are related only to the test set, which
means that the sets of training and validation were
not used for the generation of results.
3 RESULTS
The first experiment was performed using only the
variables that bring information from the thickness
of the NFL (11, 12, 13 and 14), which evaluates the
performance of the proposed neural networks
models for the classification of patients when these
four variables are available. As these variables are
used by the OCT to define which patients are
healthy and which are not, the task of the neural
network is only to model the function inside the unit.
The second experiment, on the other hand, is to
assess the performance of the proposed models
without using these four variables. The purpose of
this experiment is to provide a cheaper alternative to
raise the profile of pathological NFL patients,
regardless of OCT.
3.1 Experiment 1: Classification using
only Measures of Retinal NFL
Thickness
The best configuration of MLP networks used four
input nodes (one for each of the four input
variables), 5 neurons in the hidden layer and one
node in the output layer, as explained in section 2.
The results obtained by the two networks are
shown in Table 1. This table shows the results for 64
samples of patients from the test set, 19 regarding
patients with dysfunction and 45 regarding healthy
patients. As shown in Table 1, both networks had an
excellent performance, resulting in 100% of success.
This result was already expected, since we used
exactly the same input variables that are needed by
the unit to define the outcome of the examination.
Table 1: results of MLP and PNN neural networks for
experiment 1.
4-Variables
(fixed)
MLP PNN
Hit rate 100% 100%
Confusion Matrix 45 0 45 0
0 19 0 19
3.2 Experiment 2: Classification
without Measures of Retinal NFL
Thickness
The second experiment had the intention to evaluate
the performance of neural networks in the
classification of patients using the other variables,
excluding the four input variables corresponding to
the retinal NFL thickness, as mentioned above.
This decision was taken for two reasons. First to
evaluate the performance of the network using other
variables whose direct involvement in defining the
profile of disease for the patient was not pre-known.
The second reason is the fact that the variables
regarding the thickness of the nerve fibres can only
be obtained through the OCT, which is a very
expensive exam, while the other variables can be
obtained in other exams. It is therefore interesting to
know if these other variables can be used to detect
the presence of retinal NFL dysfunction, or at least
simulate the result of the indication of dysfunction
proposed by OCT.
The structures of MPL and PNN networks in this
experiment are exactly to the same as the structures
of networks in experiment 1, except for the number
of variables in the entry that varied from 3 to 10.
These N input variables, where N ranges from 3
to 10, were selected in accordance with 4 different
criteria for selection, in both types of neural
networks (MLP and PNN):
a) Selection of N variables set randomly;
b) Selection of N most important variables
defined by the LSE method;
c) Selection of N first major components
identified by the PCA;
d) Selection of N most important variables
defined by the LSE method with data transformed
into its principal components using PCA.
The results obtained by the various
configurations of networks are presented in Tables 2
and 3, using only the test set. Table 2 presents the
results for MLP networks and table 3 for PNN
networks.
BIOSIGNALS 2009 - International Conference on Bio-inspired Systems and Signal Processing
142

Table 2: Results from MLP networks using different number of input variables and different methods of variables selection.
Number of
input
variables
Multilayer Perceptron
Random LSE PCA PCA/LSE
Hit
rate
Confusion
Matrix
Hit
rate
Confusion
Matrix
Hit
rate
Confusion
Matrix
Hit
rate
Confusion
Matrix
3 56,25
21 24
79,69
38 7
87,50
43 2
85,94
41 4
4 15 6 13 6 13 5 14
4 90,63
42 3
89,06
42 3
79,69
37 8
81,25
38 7
3 16 4 15 5 14 5 14
5 89,06
42 3
90,63
42 3
84,38
40 5
87,50
42 3
4 15 3 16 5 14 5 14
6 89,06
42 3
89,06
41 4
85,94
41 4
89,06
42 3
4 15 3 16 5 14 4 15
7 82,81
36 9
87,50
41 4
82,81
37 8
92,19
44 1
2 17 4 15 3 16 4 15
8 85,94
40 5
89,06
41 4
87,50
40 5
87,50
41 4
4 15 3 16 3 16 4 15
9 89,06
41 4
87,50
41 4
85,94
41 4
89,06
41 4
3 16 4 15 5 14 3 16
10 82,81
38 7
87,50
41 4
65,63
25 20
87,50
40 5
4 15 4 15 2 17 3 16
Table 3: Results from PNN networks using different number of input variables and different methods of variables selection.
Number of
input
variables
Probabilistic Neural Networks (PNN)
Random LSE PCA PCA/LSE
Hit
rate
Confusion
Matrix
Hit
rate
Confusion
Matrix
Hit
rate
Confusion
Matrix
Hit
rate
Confusion
Matrix
3 87,50
42 3
84,38
44 1
82,81
41 4
81,25
40 5
5 14 9 10 7 12 7 12
4 85,94
41 4
84,38
44 1
84,38
41 4
87,50
45 0
5 14 9 10 6 13 8 11
5 84,38
40 5
87,50
44 1
84,38
42 3
84,38
43 2
5 14 7 12 7 12 8 11
6 82,81
39 6
81,25
42 3
82,81
41 4
78,13
40 5
5 14 9 10 7 12 9 10
7 85,94
42 3
81,25
42 3
85,94
44 1
78,13
40 5
6 13 9 10 8 11 9 10
8 85,94
42 3
79,69
40 5
85,94
44 1
79,69
41 4
6 13 8 11 8 11 9 10
9 85,94
43 2
84,38
44 1
85,94
44 1
85,94
44 1
7 12 9 10 8 11 8 11
10 85,94
44 1
85,94
44 1
85,94
44 1
85,94
44 1
8 11 8 10 8 11 8 11
APPLICATION OF NEURAL NETWORKS IN AID FOR DIAGNOSIS FOR PATIENTS WITH GLAUCOMA
143

The performance of a given network setting was
measured using two consecutive criteria. The first
welcomes the network that obtained the highest hit
rate of patients with retinal NFL dysfunction, since
the main goal is the correct classification of patients
with an indication of glaucoma. The second criterion
is the highest hit rate of the overall, healthy or
pathological patients, among the best networks
obtained by the first criterion.
The best overall hit rate was 92.19% and it was
obtained with a MLP network with 7 entries, the
data decomposed into its principal components, and
the variables selected by the LSE method. High
performance (90.63%) was also achieved with MLP
neural networks and the variables selected by the
LSE method. The transformation of the database
into its principal components seems not to have
substantially improved the performance of networks.
Various configurations of networks have hit rates
above 84% in patients with an indication of
glaucoma, correctly classifying 16 patients in a total
of 19. All networks that have this kind of
performance were MLP, and therefore one can say
that generally the performance of networks MLP
was higher than of PNN networks in this application.
The LSE method has proved to be very
consistent, making explicit that from 10 variables,
not considering the ones related to retinal NFL
thickness, 4 have much relevance and allow
classification with a hit rate of over 89%: rim width,
excavation diameter, disk diameter and average
width of nerve. The result of the networks shows
that there is a clear link between these 4 variables
and an amendment of retinal NFL that may suggest
the presence of glaucoma, according to the pattern of
this amendment.
According to the specialist, these results are very
interesting. In glaucoma, there is really a loss of
preferential rim nerve in superior and inferior poles,
and so it is consistent the involvement of these
variables in the definition of retinal NFL
dysfunction.
4 CONCLUSIONS
In ophthalmologic exams, the detection of optic
nerve damage by glaucoma involves morphological
characteristics, like size and shape of rim and the
excavation of the disk, which were pointed out as an
important feature in the results. It is known that
these characteristics vary with the size of the disk
(Hoffman et al, 2007).
Moreover, the measure of the disk size varies
with the technique used, among populations. Often it
is easier to detect suggestive changes of
glaucomatous damaged nerves with a larger size
compared to the small disks. This characteristic
affects the likelihood of a doctor to make the
diagnosis, being a major factor of bias, which
characterizes the complexity of the process involved.
According to most specialists, it is not possible
to make the diagnosis of glaucoma without
characteristics changes in the visual field, which
represents a significant loss of neural tissue, in
which functional injuries are most often irreversible.
Therefore, researchers have pursued ways to find
the changes that precede these symptoms for a
diagnosis and early treatment of glaucoma. Such
searches are based, most of them, on morphological
changes of the optical disk and the layer of nerve
fibres, as detected by the OCT.
The neural network can help the doctor in the
diagnosis since these physical measures of disk are
mathematically related, so it is possible to correlate
them and generate an output profile of the
pathology. In this study, through the use of neural
networks, there was a significant hit rate of this
pathological profile characterized by changes in
retinal NFL, which suggests presence of glaucoma.
As discussed in the previous section, it was
expected that the variable width of rim, excavation
diameter, disk diameter and average width of nerve
were relevant to the indication of glaucoma.
However, other studies are still needed to understand
the complex relationship between size of disk,
neural tissue, demographic factors and the
development of glaucoma.
The suppression of the 4 input variables related
to NFL thickness in the second experiment did not
prevent the high performance of networks using the
other variables. The hit rates in patients with
dysfunction in retinal NFL were still satisfactory.
Therefore, this work provided an important result
as it proved that it is possible to detect the presence
of retinal NFL dysfunction, or at least simulate the
result of the statement obtained on OCT, using
neural networks fed by variables that can be
obtained by different and cheaper exams.
Other classification methods besides ANN could
be tested with the available database, such as support
vector machines (Cristianini, 2000) (Haykin, 1999)
and hybrid neuro-fuzzy models (Gonçalves et al,
2006) (Vellasco et al 2007) (which would also allow
one to extract fuzzy rules that could generate
linguistic rules over the classification problem).
However, in this work we chose the ANN models to
BIOSIGNALS 2009 - International Conference on Bio-inspired Systems and Signal Processing
144

classify our data, because they fit well the desired
automatic, accurate and cheap method profile. It is
known that ANN have an excellent performance in
classification problems due to their universal
approximation characteristics, and they are also
recommended in problems where the formulation is
not easily defined, such in this application.
Despite this work achieved success in identifying
patients with retinal dysfunction of CFN, it only
suggests the presence of glaucoma, and
consequently further steps can be suggested.
One of them would be to better evaluate the
performance of the networks obtained, using a new
database where the patients would have a clinical
diagnosis of glaucoma. It would be good to assess
the direct relationship between the variables of entry
and the final diagnosis of glaucoma. This study
could be important because it would indicate how
important the retinal NFL is in the diagnosis of
glaucoma.
Another step would be to include data from
clinical diagnosis such as visual field and
campimetry. Using these data it would be possible to
quantify the importance of each of these exams in
the final diagnosis of glaucoma, and possibly find a
good set of examinations for aid in the diagnosis of
glaucoma through the use of neural networks.
REFERENCES
Bowd, C; et al. The retinal nerve fiber layer thickness in
ocular hypertensive, normal and glaucomatous eyes
with optical coherence tomography. Arch Ophthalmol.
2000 Jan; 118 (1): 22-6.
Carl Zeiss Meditec, Inc. “STRATUS OCT™ Optical
Coherence Tomography”.
Chung F.-L., and J.-C. Duan (2000) "On Multistage Fuzzy
Neural Network Modeling", IEEE Trans. on Fuzzy
Systems, 8(2): 125-142.
Cristianini, N. & J. Shawe-Taylor (2000) An Introduction
to Support Vector Machines and other kernel - based
learning methods. Cambridge University Press.
Gonçalves, L., M.M.B.R. Vellasco, M. Pacheco, F. Souza,
Inverted Hierarchical Neuro-Fuzzy BSP System: A
Novel Neuro-Fuzzy Model for Pattern Classification
and Rule Extraction in Databases, IEEE Trans. on
Systems, Man & Cybernetics, Part C: Applications
and Review, 36(2): 236-248.
Hattenhauer MG, Johnson DH, Ing HH, Herman DC,
Hodge DO, Yawn BP,et al. The probability of
blindness from open-angle glaucoma. Ophthalmology
1998;105:2099-104.
Haykin, S., Neural Networks: A Comprehensive
Foundation, Macmillan College Publishing Company,
Inc., 1994.
Hoffman, EM, et al, Optic Disk Size and Glaucoma
Survey, Ophthalmology, 2007 vol 52, 1: 32-49;
Hoyt WF, Newman, NM. The earliest observable defect in
glaucoma. Lancet 1972; 1:692-693.
Huang D, Swanson EA, Lin CP, et al. Optical coherence
tomography. Science 1991; 254: 1178-81.
Kerrigan-Baumring LA, Quigley HA, Pease ME, et al.
Number of ganglion cell in glaucoma eyes compared
with threshold visual field tests in the same persons.
Invest Ophthalmol Vis Sci, 2000; 41: 741-748.
Kohavi, R. A study of cross-validation and bootstrap for
accuracy estimation and model selection".
Proceedings of the Fourteenth International Joint
Conference on Artificial Intelligence, 1995, 2: 1137–
1143.
Krzanowski, W. J., Principles of Multivariate Analysis,
Oxford University Press, 1988.
Quigley HA. Number of people with glaucoma
worldwide. Br J Ophthalmology 1996;80:389-93.
Quigley HA, Reacher M, /Katz J et al. Quantitative
grading of nerve fiber layer photographs.
Ophthalmology, 1993; 100: 1800-807.
Roxana J. Contreras, Marley M.B.R. Vellasco, Ricardo
Tanscheit, Feature Selection Techniques Applied to
Hierarchical Neuro-Fuzzy BSP Models, 11th World
Congress of International Fuzzy Systems Association
(IFSA 2005), Vol. 3, pp. 1316-1320, July 28-31, 2005,
Beijing, China.
Rumelhart, D.; Hinton, G & Williams, R. Learning
Internal Representations by Error Propagation. In:
Parallel Distributed Processing: Explorations in the
Microstructure of Cognition - Vol. 1. Cambridge: MIT
Press, 1986.
Vellasco, M.M.B.R., M. Pacheco, K. Figueiredo, F. Souza
(2008) Hierarchical Neuro-Fuzzy Systems - Part I,
"Encyclopedia of Artificial Intelligence", Information
Science Reference
Wasserman, P.D., Advanced Methods in Neural
Computing, New York: Van Nostrand Reinhold, pp.
35-55, 1993.
APPLICATION OF NEURAL NETWORKS IN AID FOR DIAGNOSIS FOR PATIENTS WITH GLAUCOMA
145
