
A TOOL FOR ENDOSCOPIC CAPSULE DATASET
PREPARATION FOR CLINICAL VIDEO EVENT
DETECTOR ALGORITHMS
Sérgio Lima
1
, João Paulo Cunha
1,2
, Miguel Coimbra
3
and José M. Soares
4
1
IEETA – University of Aveiro, Aveiro, Portugal
2
DETI – Department of Electronics, Telecommunications and Informatics of University of Aveiro, Portugal
3
IT – Faculdade de Ciências da Universidade do Porto, Portugal
4
Hospital General Santo António, Porto, Portugal
Keywords: Capview, Endoscopic Capsule, Image Processing, Computer Aided Vision.
Abstract: In all R&D projects there's at least one phase of model verification and accuracy, and when we are working
with visual information (such as pictures and video) this phase should be emphasised. When working with
medical information and clinical trials the truth of automatic results must be accurate. This work is based on
the need of a huge and well annotated dataset of pictures retrieved from endoscopic capsule. This datasets
should be used to learn the computer vision algorithms focused on endoscopic capsule video processing,
and event detection.
1 INTRODUCTION
The endoscopic capsule (EC) (Ravens et al., 2002;
Iddan et al, 2000) is a small device with a behavior
similar to a photographic camera that flows through
the human digestive system recording pictures after
being swallowed by the patient. Considering that the
exam lasts between 6 to 8 hours, and that the EC
records/store frames with a 2 frames per second
cadence, it results on approximately 57600 frames to
be analysed, which could take up to 90 minutes
(Qureshi et al., 2004).
With this amount of information, pattern
recognition and machine learning algorithms are
helpful to augment review time efficiency by
automating or semi-automating this task. To achieve
this level of automatic analysis we need many
theoretical studies, which can benefit immensely
from experimental software that has been
specifically designed to support hypothesis testing
and validation.
On the other hand these algorithms require a
substantial number of test sets and correspondent
training ones. Therefore to fulfil this gap the ECCA
software was created (described bellow).
The principal motivation for its creation was the
lack of annotated EC events at large scale in a way
that could be used on computer vision algorithms.
The several repositories (also called atlas) on the
internet with endoscopic images and videos (GIA,
;AGE, ) are for education purposes only. Its
information is disease centric, containing patterns
and symptoms for each one so it maintains all the
clinicians all over the world up to date.
The ECCA repository has a different philosophy.
Its paradigm is based on machine learning
algorithms. Therefore it’s not sufficient one or two
photos from each disease neither it’s important many
of the clinical and symptomatic information.
In this paper we describe the “Endoscopic
Capsule Capview cAtaloguer” (ECCA), a tool for
creating subsets of annotated images for simplified
collection and management of image datasets.
The tool here described is intended to be a
complement of the Capview software platform
(Cunha et al., 2006) that is already used by doctors
to perform an agile diagnostic review of videos from
the Endoscopic Capsule (EC). It integrates several
functionalities, such as flexible report generation
facilities or a MPEG-7 features extraction engine to
support automatic detectors for bleeding events and
topographic segmentation (Coimbra et al., 2006;
Cunha et al., 2008; Coimbra et al., 2005). At the end
of a review process with Capview, we will have a set
of events marked by the clinician. These events
265
Lima S., Cunha J., Coimbra M. and M. Soares J. (2009).
A TOOL FOR ENDOSCOPIC CAPSULE DATASET PREPARATION FOR CLINICAL VIDEO EVENT DETECTOR ALGORITHMS.
In Proceedings of the International Conference on Health Informatics, pages 265-269
DOI: 10.5220/0001548502650269
Copyright
c
SciTePress
(short videos around the image where a particular
event was marked, such as a polyp) are the data units
we use for the ECCA tool. We aim at using them for
further annotation of independent clinicians to
obtain a multi-reviewer consensus degree on the
collected events.
The present tool is then intended to generate and
manage the multi-expert annotation and dataset
creation for further development of new detectors
that will be integrated in the Capview platform.
2 ECCA TOOL
2.1 Objectives
With this software tool we'll retrieve several subsets
of endoscopic images (gathered from real exams),
divided by type of disease, size of polyps or tumours
when applied, and their morphology. Those images
will also have information about image quality,
where high quality means low presence of food
and/or fecal matter, and good light conditions.
Thus, its primary objective is to contain an
on-line repository with enough information to test
and verify each new algorithm that works with EC
video and/or images.
On the course of the development process,
another challenge came up: Use this software to
teach fresh intern doctors analysing this kind of
exams. We then need the ability to compare two
different catalogues, and identify their differences so
that performance of training doctors could be
measured.
2.2 Architecture
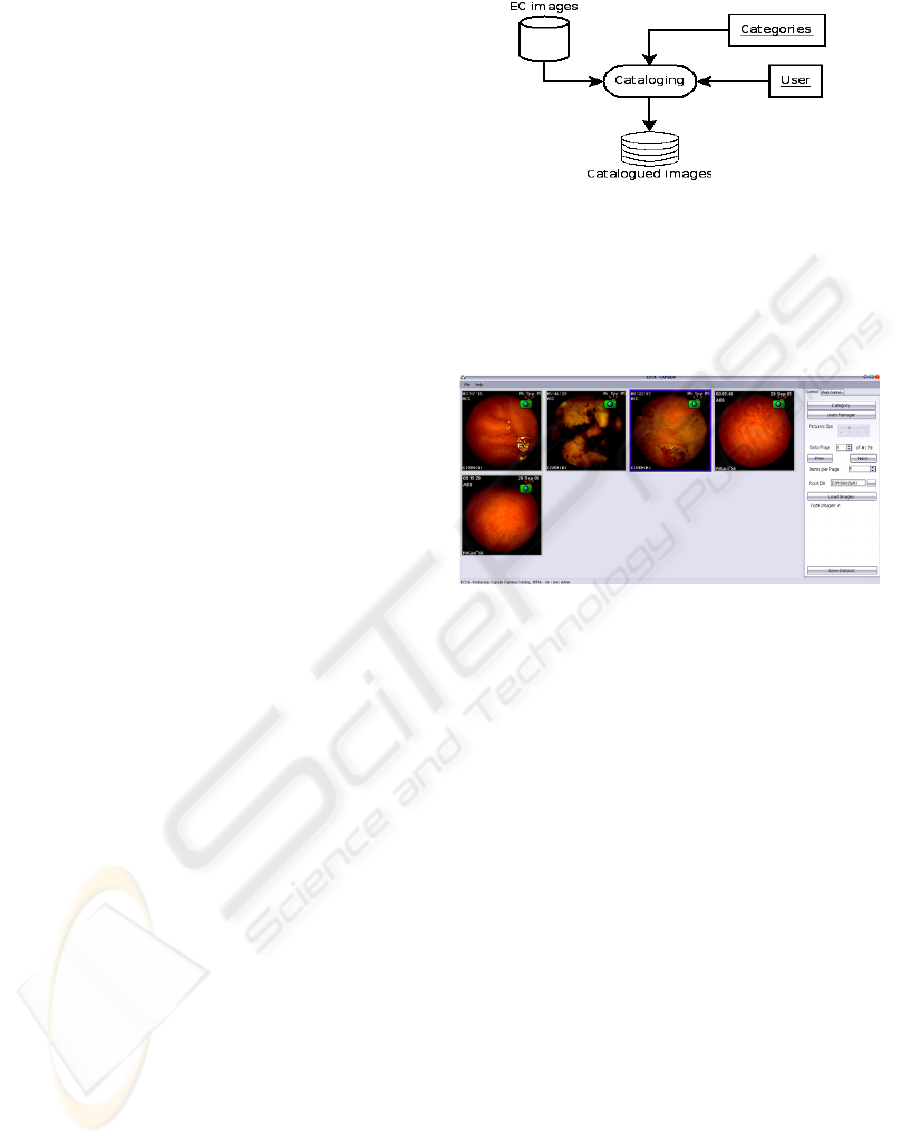
ECCA has a database-centric architecture. This
means that the main logic of it is to store
information. In this particular case we want to store
a catalogue of image annotations.
In this framework, a catalogue of EC images
needs to store information on event category and
Medical doctor (MD) responsible for that annotation
(Figure 1).
The application needs a thin layer of security,
where each medical doctor has its own
username/password to distinct each catalogue from
another. Thus one user cannot see or edit other user
catalogue. Therefore the results of one doctor aren't
biased by others.
Figure 1: Simplified architecture.
2.2.1 Workflow
An MD enters its username and password, giving
access to main window (Figure 2) where EC images
will appear.
Figure 2: Main window.
He selects the desired image, by double-clicking
on it, and then a popup window () appears with only
the selected image and a panel with the categories
available to that image. After the MD makes his
choice of type of illness, its description, and quality,
the save button must be clicked. When clicked, the
information for that image is automatically stored in
the database (xml file for simplicity), and the next
image in line appears inside the popup window.
When all MD's finished their annotations, the
database will have information about each image
and correspondent illness and description.
With that database, we can create the subsets of
annotated images about each disease based on the
multi-expert classification obtained through ECCA
tool and establish the “gold standard” set by
choosing only the events where all experts agreed.
2.3 Applications
After describing how the software was designed it’s
necessary to show what can be done with it. The tool
has 2 main applications “Dataset Manager” and
“Pedagogical/Teaching”.
HEALTHINF 2009 - International Conference on Health Informatics
266
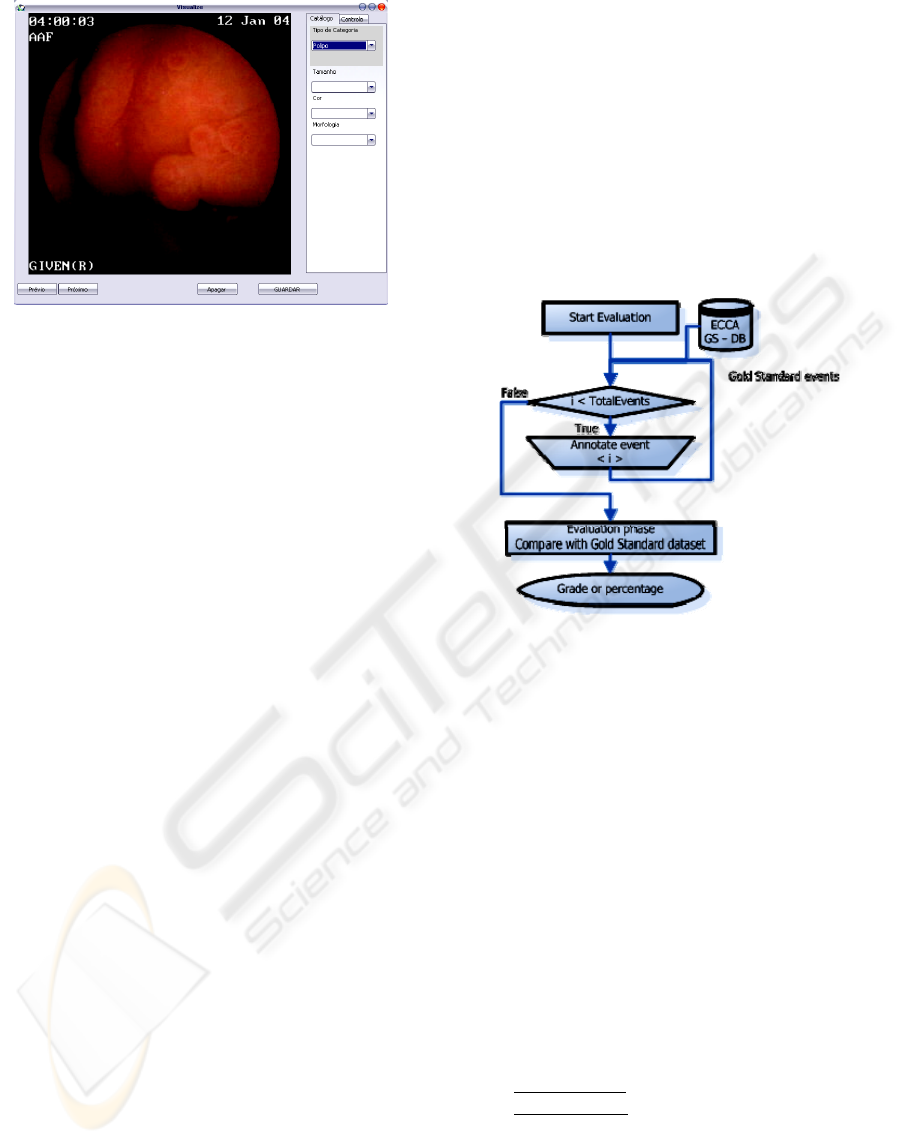
Figure 3: ECCA popup window.
2.3.1 Dataset Manager
Like it was said before the purpose of this dataset
manager is to create a considerable amount of
annotated EC exams, containing images and small
video clips, so following has validated and reliable
data to work on.
The images contained in this database have
mainly low resolution with 256x256 pixels, and the
newer capsules with 512x512 pixels. Previous
studies using computer aided tumor detection
(Karkanis et al, 2003) use 1K*1K pixels which is 16
times better than the first and 4 times better than the
last. Therefore the analysis and algorithms to detect
events such as tumors or polyps using this kind of
exams should be tested exhaustively against many
samples.
The methodology in the creation of this database
took advantage of the IEETA-CapDB (Campos,
2006) which contains considerable amount of
endoscopic capsule exams and respective diagnosis
retrieved from different clinicians that used the
CapView software, and submitted those diagnosis to
IEETA-CapDB repository on an anonymous and
freely manner.
Focusing on diagnosis of polyps, tumors and
normal cases 1900 randomly selected event images
and corresponding videos were gathered on an
uniform basis (evenly distributed by each test case).
The manager allows the creation of a gold
standard set of events derived from the annotation of
clinicians using the workflow described above. Then
they are filtered by similarity, i.e only the
annotations that are equal by all EC experts will be
present on the gold standard. At the end a confident,
distinct and valid dataset of annotated events is
available.
2.3.2 Pedagogical
Using it as pedagogical/teaching tool has an
important requirement. The gold standard (GS)
database must already be present. This GS database
or dataset is created using only the annotations from
the clinicians belonging to the capsule experts group
using for that matter the dataset manager, which
contains all the exams and respective annotations.
With the gold standard reference dataset and the
methodology bellow it’s possible to evaluate each
person.
Figure 4: Evaluation workflow.
The schematic above illustrates the methodology
to evaluate each one. It cycles through all exams
inside GS dataset and the student/person to evaluate
must annotate it. After all the exams were annotated
the final step will evaluate his responses/annotations.
In the evaluation phase all the events are
compared to the GS dataset and it will grade each
response based on the following equation:
EVAL = 60% x Type + 40% x (# correct
characteristics / # GS characteristics)
(1)
The equation (1) gives more weight to the type
of illness (either it's a polyp, tumor or normal case),
and the remaining will be equally distributed by all
the characteristics of that illness (inside
characteristics.xml file, see results section).
The evaluation takes into account the following:
type of illness
: normal case, tumor or polyp
characteristics
of each illness:
polyp: size, morphology, color.
tumor: size, morphology, color
normal: not applied, it hasn't any
characteristics.
A TOOL FOR ENDOSCOPIC CAPSULE DATASET PREPARATION FOR CLINICAL VIDEO EVENT DETECTOR
ALGORITHMS
267

There are also some extra categories that will not
be considered because it’s only for image quality
screening such as food remains, image quality, and
others. This “others” category means that image
doesn’t belong to any of the categories above. The
“image quality” is evaluated using some qualitative
expressions such “good”, “bad” or “moderate”.
At the end there is an overall rating resulting
from the average of each grade of each event.
With the methodology illustrated in it's possible
to quantify the capacity each group of clinicians has
to diagnose using the endoscopic capsule method.
Figure 5: Group evaluation.
This methodology will show the capability of
distinct group of clinicians to diagnose using EC
method. Because those results are off scope of this
article they would be presented in a future work.
Then with more insight and reasonable amount of
clinicians using this software, it would be possible to
answer some of the questions above.
3 RESULTS
The present version of the event database has an
overall of 1900 events. Our clinical partners at
HGSA, Porto are using this software. Until the
present date two experts in Endoscopic Capsule
diagnosis and a couple of interns used it and had an
overall of 3700 annotations. About 900 were
annotated 3 times, and the remaining 1000 were
annotated only once. Thus, the confidence on those
first 900 events is very high. It is only a question of
time to annotate all events.
The tool is able to produce a “results file” in the
form of a ZIP file. That ZIP file will contain a
directory with all the images, and one CSV file with
the raw data. These CSV file has the following
structure:
(imagepath), (type), (GoldStandard), (characteristic),
(value), {(characteristic),(value)}
The first column contains the path of the image.
Second the type of illness (tumour, polyp, or
normal). Third the GoldStandard is a boolean field,
telling if that image is part of the Gold standard
dataset. The fields after has a list of characteristics
and respective value for that image. This list can
have many pairs (characteristic, value), ex: (Size,
5mm), (Colour, Red). All the possible characteristics
and its values will be discriminated on the file
caracteristics.xml also inside the ZIP file.
Its structure follows:
<characteristics>
...
<characteristic>
<value1>
<value2>
...
</characteristic>
...
</characteristics>
4 DISCUSSION
The experts in EC diagnosis at HGSA are creating
the gold standard dataset which will be used to test
and train future computer vision algorithms. Their
feedback tells us that it’s easy to use and a handy
tool, with the only setback being the time needed to
annotate all the events which takes over 4 hours.
The ECCA software generates subsets of
annotated events derived from those high confidence
ones that will be used in the development of
computer vision algorithms to be integrated in the
Capview software, which is our main research goal.
Therefore a well annotated and high confidence
dataset of events is at the most importance. Thus it
could be used as train/test sets for machine learning
algorithms. The difference between Capview and
ECCA tool is that the first is used for clinical and
diagnosis annotation, while the ECCA aims a
construction of a well defined dataset with necessary
information for event detector algorithms.
Those algorithms need to minimize the
classification error rate and improve its performance.
One of the main aspects to take into attention is the
training and test sets size and quality. It should be
large enough and independent from one another
(Jain et al., 2000). This can easily be generated using
the ECCA tool.
The evidence of pedagogical relevance is not
proved yet, because there were not subjects that tried
HEALTHINF 2009 - International Conference on Health Informatics
268

this software, therefore there are not results to
demonstrate this approach.
5 CONCLUSIONS
The ECCA software is not another endoscopic or
endogastric atlas. The atlas is for humans as is this
tool for computers. Those atlas are available on the
internet or books which intends to instruct and
provide up to date information about endogastric
diseases, in a way that medical doctors can provide
the best care possible, while the tool described in
this paper aims a similar learning phase for
computers and artificial intelligence algorithms.
The main objective is to create a large set of data
capable of training and testing several machine
learning and computer vision algorithms. In that way
distinct algorithms could be tested with the same or
similar test and training data. Therefore, the
comparison between them could be performed more
directly and with high accuracy.
Several on going studies taken place at SIAS-
IEETA R&D department using computer vision
applied to EC video benefit from the data gathered
from this tool. The development and evaluation of
these computer vision and detection algorithms,
based on EC video processing, become a simpler
process by using the data gathered by this tool.
Furthermore, it may be used as a teaching tool
for EC specialist trainees. Due to lack of test
subjects, students willing to expend some time
trying this tool, there are not data that prove or not
the pedagogical relevance of this software, in spite
accreditation by the EC specialists.
ACKNOWLEDGEMENTS
The authors would like to thank the
Gastroenterology Department of Santo António
General Hospital (HGSA) in Portugal and the
endoscopic capsule specialists of the same
department for their contribution to the clinical
annotation using the ECCA software. The authors
would also like to thank the IEETA institute for their
vital support The presented work was developed in
the scope of project PTDC/EEA-ELC/72418/2006,
financed by FCT (Fundação para a Ciência e a
Tecnologia), under “POS-Conhecimento”
programme of the Portuguese Government.
REFERENCES
Cunha, J. P. S., Coimbra, M., Campos, P., and Soares, J.,
(2008), "Automated Topographic Segmentation and
Transit Time Estimation in Endoscopic Capsule
Exams", in IEEE Trans. on Medical Imaging, vol. 27,
pp. 19-27.
GIA, Gastro Intestinal Atlas Home Page
http://www.gastrointestinalatlas.com/index.html
AGE, Atlas of Gastrointestinal Endoscopy,
http://www.endoatlas.com/
Iddan, G., Meron, G., Glukhovsky, A., and Swain P.,
(2000). Wireless Capsule Endoscopy, Nature, pp. 405-
417
Qureshi, W.A., (2004). Current and future applications of
capsule camera, Nature, vol.3, pp. 447-450
Ravens, A.F., Swain, C.P., (2002). The wireless capsule:
new light in the darkness, Digestive Diseases, vol.20,
pp. 127-133
Coimbra, M., Campos, P., Cunha, J.P.S., (2005).
Extracting clinical information from endoscopic
capsule exams using mpeg-7 visual descriptors,
Integration of Knowledge, Semantics and Digital
Media Technology EWIMT, pp.105-110.
Cunha, J. P. S., Coimbra, M., Campos, P., and Soares, J.,
(2006). The First Capview.Org Automatic Tool for
Capsule Endoscopy, presented at 4th Iberian Meeting
of Capsule Endoscopy, Coimbra.
Coimbra, M., Campos, P., and Cunha, J.P.S., (2006).
Topographic Segmentation and Transit Time
Estimation for Endoscopic Capsule Exams, in IEEE
ICASSP - International Conference on Accoustics,
Speech and Signal Processing. Toulouse, France:
IEEE.
Jain, Anil K., Duin, Robert P.W., Mao Jianchang, (2000).
Statistical pattern recognition: A Review, IEEE
Transactions on pattern analysis and machine
intelligence, vol.22 No.1 pp. 4-37
Karkanis, Stavros A., Iakovidis, Dimitris K., Maroulis,
Dimitris E., Karras, Dimitris A., (2003). Computer-
Aided Tumor Detection in Endoscopic Video Using
Color Wavelet Features, IEEE Transactions on
Information Technology in Biomedicine, vol. 7, No 3,
pp. 141-152.
Campos, Paulo Costa Pereira, (2006). Plataforma de
arquivo e processamento de eventos em cáspula
endoscópica, Aveiro: Department of Electronics,
Telecommunications and Informatics, University of
Aveiro.
A TOOL FOR ENDOSCOPIC CAPSULE DATASET PREPARATION FOR CLINICAL VIDEO EVENT DETECTOR
ALGORITHMS
269
