
SIMULATION AND EXPERIMENTAL DESIGN OF A
SYMMETRY CONTROLLER FOR FES CYCLING OPTIMISED
ON STROKE PATIENTS
Emilia Ambrosini, Simona Ferrante
NEARLab, Bioengineering Department, Politecnico di Milano, via Golgi 39, Milano, Italy
Thomas Schauer
Technische Universität Berlin, Control Systems Group, Einsteinufer 17, Berlin, Germany
Alessandra Pedrocchi, Giancarlo Ferrigno
NEARLab, Bioengineering Department, Politecnico di Milano, via Golgi 39, Milano, Italy
Keywords: FES cycling, Control systems, Stroke, Rehabilitation.
Abstract: This study deals with the design of a controller for FES cycling able to assure a symmetrical pedalling. This
controller is exploitable in the rehabilitation of patients with unilateral neurological disorders which need to
recover a symmetrical use of the legs. The controller updates the values of pulse width used in the
stimulation of the two legs in order to nullify the unbalance between the torques produced at the cranks and
then to maintain a symmetrical pedalling. The controller was tested first in simulation by means of a neuro-
musculo skeletal model of a stroke patient which identifies the kinematic and dynamic of cycling induced
by FES. After a stability analysis and an optimization of the controller tuning performed in simulation, the
controller was tested experimentally on a healthy subject. The results of this trial show that the controller is
able to reach a symmetrical pedalling in about 18 s, starting from an unbalance of 0.73 Nm. Furthermore, it
is able to maintain a symmetrical task with small oscillations of the PWs. Thus, its employment in the
rehabilitation of stroke patients could be crucial in the recovery of motor functions, such as walking, where
a cyclical symmetrical motor task is required.
1 INTRODUCTION
Cycling induced by means of controlled functional
electrical stimulation (FES) of the large leg-
actuating muscles is an interesting method in the
rehabilitation of patients with neurological or
muscular disorders (Scheffler, 2007). We will refer
to this artificial movement with the term FES
cycling. In order to induce this task, superficial
electrodes are placed over the target muscle groups:
always over the quadriceps and the hamstrings,
sometimes over the gluteus maximum, the plantar-
flexors and dorsal-flexors of the ankle. Patients sit
on the ergometer and the computer controls the
appropriate sequence of stimulation of the muscles
in order to obtain the cycling movement. A shaft
encoder at the crank measures the crank angle; each
muscle is stimulated for a particular range of the
crank angle to turn the pedals. Usually, FES cycling
system use an active drive mechanism (for example,
an electric motor) to maintain a constant cadence.
Indeed, iso-kinetic training devices allow a larger
number of patients to undertake FES cycling, i.e.,
those unable to generate and maintain sufficient
muscular force to rotate a flywheel or those with low
tolerance to FES due to residual sensation.
FES cycling has become an established method
in the rehabilitation of patients with Spinal Cord
Injury (SCI) (Hunt, 2004; Faghri, 2005). Only
recently it was demonstrated the importance of FES
cycling on patients with stroke (Ferrante, 2008a).
When patients do not have a complete spinal lesion
245
Ambrosini E., Ferrante S., Schauer T., Pedrocchi A. and Ferrigno G. (2009).
SIMULATION AND EXPERIMENTAL DESIGN OF A SYMMETRY CONTROLLER FOR FES CYCLING OPTIMISED ON STROKE PATIENTS.
In Proceedings of the International Conference on Biomedical Electronics and Devices, pages 245-250
DOI: 10.5220/0001548802450250
Copyright
c
SciTePress
the employment of FES cycling could become
crucial in re-learning the Central Nervous System
the proper sequence of activation of the muscles
involved in the task (Scheffler, 2007).
Designing a proper FES cycling controller
presents several challenges. First, the physiological
system to be controlled is strongly non-linear and
time variant. Further, there is an high degree of
uncertainty and variability in the response properties
of the system. In this context, it would be helpful to
design a neuro-musculo skeletal model able to
identify the response of the subject to FES in order
to increase the awareness about the system to control
and to test the implemented controllers before
performing experimental trials on patients. Another
crucial aspect in the development of control
strategies for FES cycling is the identification of the
rehabilitative objective and, thus, the choice of the
controller rationale; both these steps depend on the
target pathology. In this contest, another essential
step is the choice of the sensors needed on the
ergometer in order provide a real-time controlled
signal. Up to now only controllers for patients with
complete SCI aimed at the maximization of the
power output or at the minimization of muscular
fatigue were developed (Hunt 2004; Hunt 2006). In
those studies, the ergometer was equipped with a
torque sensor at the crank and thus the power output
could be chosen as the controlled signal (Hunt,
2008).
The aim of the study was the development of a
control system for FES cycling optimised for the
rehabilitation of patients with stroke. Because of the
laterality of the pathology, the recovery of the motor
symmetry is crucial in the rehabilitation of these
patients. Thus, the controller, starting from a real-
time measure of the unbalance between the torques
produced at the two cranks, modifies the stimulation
parameters of the two lower limbs independently in
order to achieve a symmetrical pedalling. The
implemented controller was first tested and validated
by means of a simulation model and then some trials
on healthy subjects were carried out.
2 THE DESIGN OF THE
SYMMETRY CONTROLLER
The structure of the closed-loop system developed is
shown in Figure 1. It includes two parallel branches
in order to control two systems contemporaneously.
Each system corresponds to a lower limb, whose
input (control signal) is the value of pulse width,
PW, used to stimulate the selected muscles of the leg
and whose output (controlled signal) is the torque, T,
produced at the crank. For each leg, the muscular
groups included in the stimulation strategy are the
quadriceps and the hamstrings, which are the
muscles which mostly contribute to the pedalling
(Ferrante, 2008b). The range of stimulation of each
muscle in respect to the crank angle is set following
(Ferrante, 2008a).
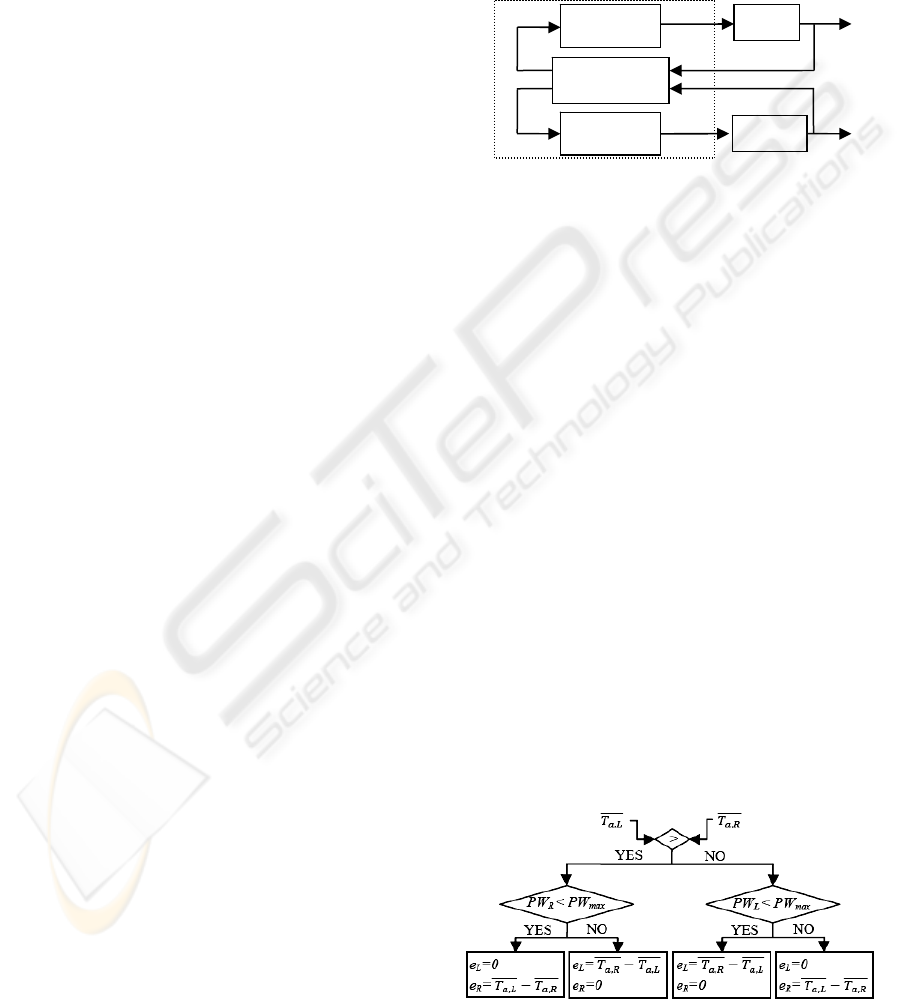
Figure 1: Block scheme of the symmetry controller; the
dotted line includes the whole controller.
The PW delivered to each leg is defined by a
pure integral controller (see Figure 1). The definition
of the reference signal of each controller is not
unique. Indeed, there are two possibilities to nullify
the difference between the T
R
and T
L
, which are the
T produced at the right and left crank, respectively:
- increasing the PW of the weaker leg;
- decreasing the PW of the stronger leg.
In the design of the controller, it is chosen to
stimulate as much as possible the weaker leg till the
maximum value (PW
max
). Then, if an unbalance is
still present, the PW of the stronger leg is decreased.
In order to take into account the unbalance only due
to the stimulation, the two active T,
T
a,L
and T
a,R
, are
computed for each leg. T
a, L/R
is the difference
between the T produced when the stimulation is ON
and the one obtained during passive cycling, i.e,
when legs are driven by the motor at a constant
speed. Then,
,/
is computed averaging T
a,L/R
over the crank angle range during which the muscles
of the left/right leg are stimulated. Finally, the error
signals, e
L
and e
R
, are defined by comparing
,
and
,
, as shown by the flow diagram reported in
Figure 2.
Figure 2: The flow diagram which describes how the error
signals are computed.
PW
R
e
R
e
L
T
R
PW
L
T
L
Integral
Controller
Integral
Controller
Average &
Comparison
left leg
right leg
BIODEVICES 2009 - International Conference on Biomedical Electronics and Devices
246
The two integral controllers, shown in Figure 1,
are parameterised only be the integral gain K
C
, as
described by equation (1)
),(K)1()(
c
kekPWkPW
iii
+
−=
i=R, L
(1)
The values of PW
i
are updated every revolution.
K
C
was set at the same value for both the legs
and was defined according to the stability analysis
performed by means of the simulation model. The
integral controllers were developed with an integral
anti-windup design so that the PW
i
is constrained
between 0 and PW
max
. The controller was
implemented in Matlab.
3 STIMULATION PROTOCOL
A FES cycling protocol was defined both to perform
the stability analysis and to test the working of the
controller in simulation and in experimental trials.
Each trial lasted 3 minutes: the initial 60 s were
characterised by passive cycling while, during the
last 120 s, FES started with the symmetry controller
switched on. The patients was ask not to pedal
voluntary at all. An electric motor maintained the
angular velocity at a constant value of 20 rpm,
during the whole trial.
4 SIMULATION
4.1 The Neuro-muscolo Skeletal Model
for Cycling
To test the symmetry controller developed, a neuro-
muscolo skeletal model which simulates a stroke
patient pedalling by means of FES was designed.
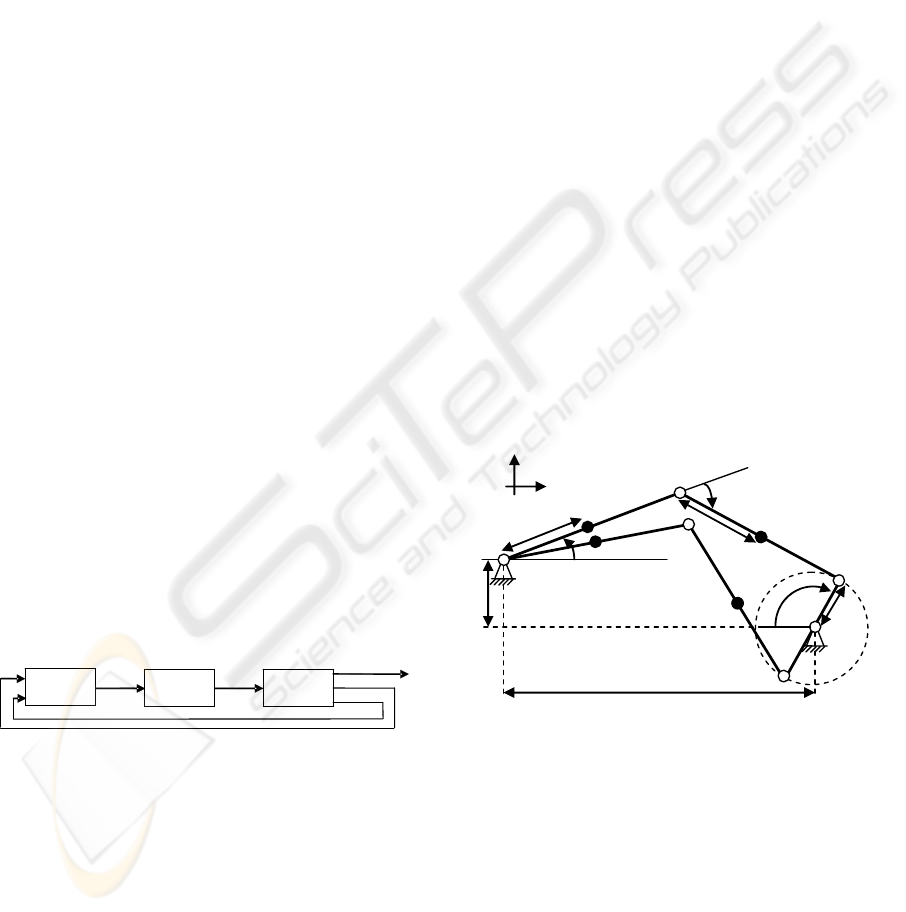
Figure 3: Block structure of the simulation model.
The block structure of the simulator is reported in
Figure 3 and consists of three main parts:
1) Stimulation Pattern Generator, which defines
the PW, the frequency and the crank angular ranges
in which the stimulation has to be delivered to each
muscle involved in the stimulation strategy.
2) Muscular Model, which calculates the joint
moments, M
J
, produced by muscular contractions.
The model is inspired to a previous work (Riener,
1998). The muscle groups included in the model are:
mono-articular hip extensors, hamstrings, biceps
femoris-short head, rectus femoris and vasti. The
maximum isometric forces of all the muscles of the
right leg were set at the half of those of the muscular
groups of the left leg. This permits to reproduce the
muscular model of a stroke patient, with the right
side impaired. The fatigue occurrence shows a
decrease of the muscle activation to about 50% of its
nominal value over 100 s of stimulation with a PW
of 400 μs, comparable to (Abbas, 1995).
3) Kinematics and Dynamics of Cycling, which
computes the crank angle, θ
C
, the cadence, θ’
C
and
the T produced by each leg at the cranks, starting
from the M
J
. The mechanical structure consists of a
planar five-bar linkage (Figure 4). All the five links
(B1 to B5) are assumed to be rigid and are
connected by planar joints (J1 to J7), which
correspond to the hips, the knees, the ankles and the
crank shaft. The ankle joints coincide with the
pedals and any rotation around these joints is
forbidden; the positions of the two hip joints
coincide and they are fixed as well as the crank axis.
Thus, the entire system, has only one degree of
freedom and can be fully characterised by θ
C
. The
kinematics and dynamics were implemented using
the Open Dynamics Engine (ODE). The complete
model was developed in Matlab/Simulink.
More details on the simulator can be found in
(Ambrosini, 2008).
Figure 4: The five-bar linkage model. B1: right thigh, B2:
right shank, B3: left thigh, B4: left shank, B5: crank arms;
J1: right hip, J2: left hip, J3: right knee, J4: knee left, J5:
right ankle, J6: left ankle, J7: crank shaft.
4.2 The Stability Analysis of the
Controller
The stability analysis of the controller was carried
out to tune K
C
. Only one branch of the block scheme
reported in Figure 1 was included in the analysis.
The simplified system analysed is shown in Figure
5; it refers to the left leg.
θ
C
θ'
C
Kinematics an
d
d
ynamics
o
f
cycling
Stimulation
p
attern gene
r
a
t
or
Muscula
r
model
T
PW
M
J
J1, J2
x
y
J3
J5
J4
J6
J7
B1
B2
B3
B4
B5
θ
k
r
θ
h
r
θ
C
l
h
l
d
l
mt
l
ms
SIMULATION AND EXPERIMENTAL DESIGN OF A SYMMETRY CONTROLLER FOR FES CYCLING
OPTIMISED ON STROKE PATIENTS
247
In order to analyse only the region of linearity, it
was assumed that the controller output (PW
L
) was
not saturated and the system was approximated by a
linear transfer function P(q
-1
), computed as follows:
P(q
-1
) = K
P
q
-1
(2)
where the only parameter is the gain K
P
. Its value
was estimated by means of the simulation model,
setting the value of PW at 400 μs, i.e., the value of
PW
max
, and calculating the consequent value of
,
,
produced. The value of K
P
was computed dividing
this value of
,
by the difference between 400 μs
and the threshold value of PW over which the
stimulated muscles start to produce an increase in
the torque, i.e., 100 μs. The value of K
P
obtained
was 0.0075 Nm/μs. It was chosen to analyse the
stability of the system referred to the left leg
because, in the model, the left side was the healthy
one and, thus, its value of K
P
was the bigger.
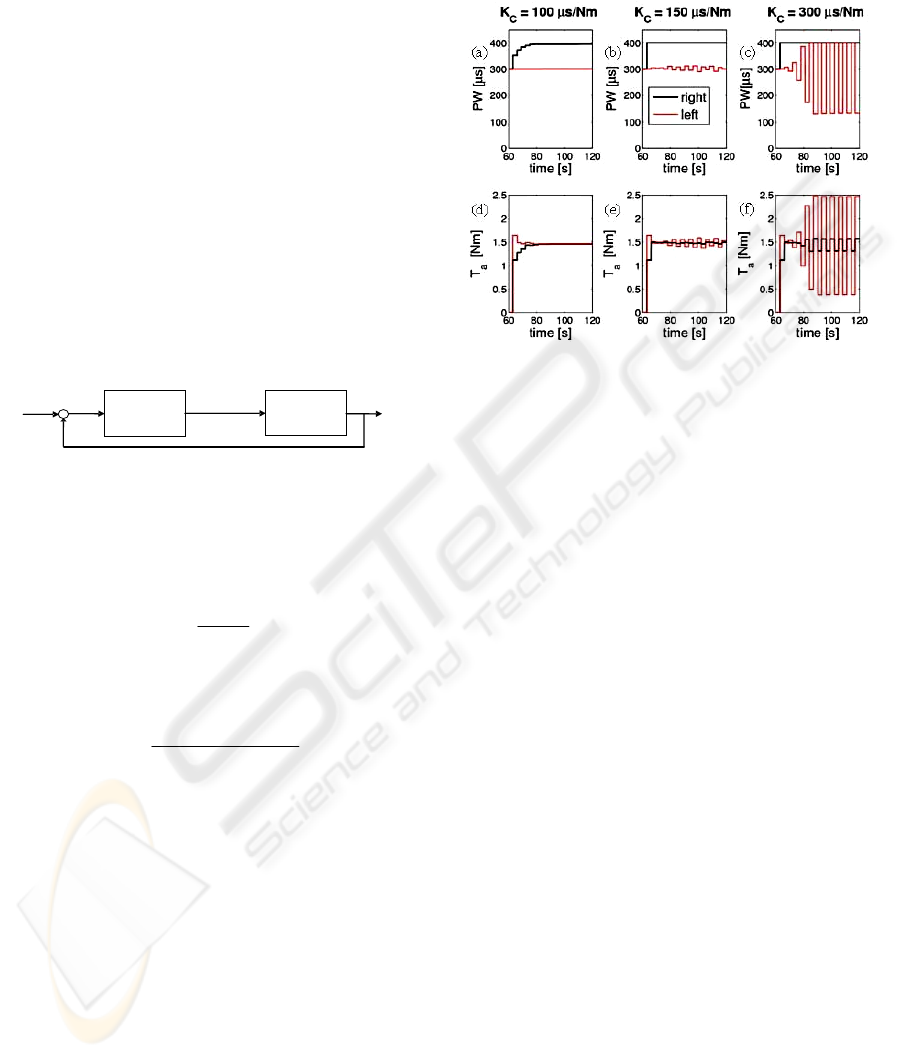
Figure 5: Simplified version of the closed-loop system.
P(q
-1
) and C(q
-1
) represent the transfer function of the
system and of the controller, respectively.
The transfer function of the integral controller C(q
-1
)
was computed as follows:
1
C
1
-1
K
)(
−
−
=
q
qC
(3)
From equations (2) and (3), it was possible to
calculate the closed-loop transfer function as:
1
CP
1
CP
1
)1KK(1
KK
)(
−
−
−
−+
=
q
q
qH
(4)
The stability of a closed-loop system is
guaranteed if the poles of H(q
-1
) are inside the unit
circle. Therefore, our system is stable if:
| 1 – K
P
K
C
| < 1 (5)
From equation (5), it resulted that the maximum
value of K
C
to remain in the stability region is
260 µs/Nm. Furthermore, to avoid oscillations of the
system output, the pole of the system should be real
positive. Thus, the maximum value of the controller
gain was fixed at 130 µs/Nm.
To verify the results of the simplified stability
analysis, the controller was tested in simulation with
different values of K
C
. The results of the trials are
reported in Figure 6; only the first 60 s in which the
stimulation was on are shown. According to the
stability analysis, the system was stable if K
C
was
100 µs/Nm (panels (a)-(d)), stable with some
oscillations if K
C
was 150 µs/Nm (panels (b)-(e)),
and unstable with K
C
of 300 µs/Nm (panels (c)-(f)).
Figure 6: Panels (a)-(b)-(c): values of PW
R
and PW
L
.
Panels (d)-(e)-(f): values of
,
and
,
. The trials were
carried out with different values of K
C
: 100 µs/Nm (panels
(a)-(d)), 150 µs/Nm (panels (b)-(e)), and 300 µs/Nm
(panels (c)-(f)). Only the first 60 s in which the stimulation
was on are reported.
Finally, it would be better to fix K
C
at a value
lower than 130 µs/Nm to be sure that the closed-
loop system is stable without oscillations. From
equation (5) follows that stability will not be lost for
any decrease in the value of K
P
during the cycling
session, e.g. caused by muscular fatigue.
4.3 Results
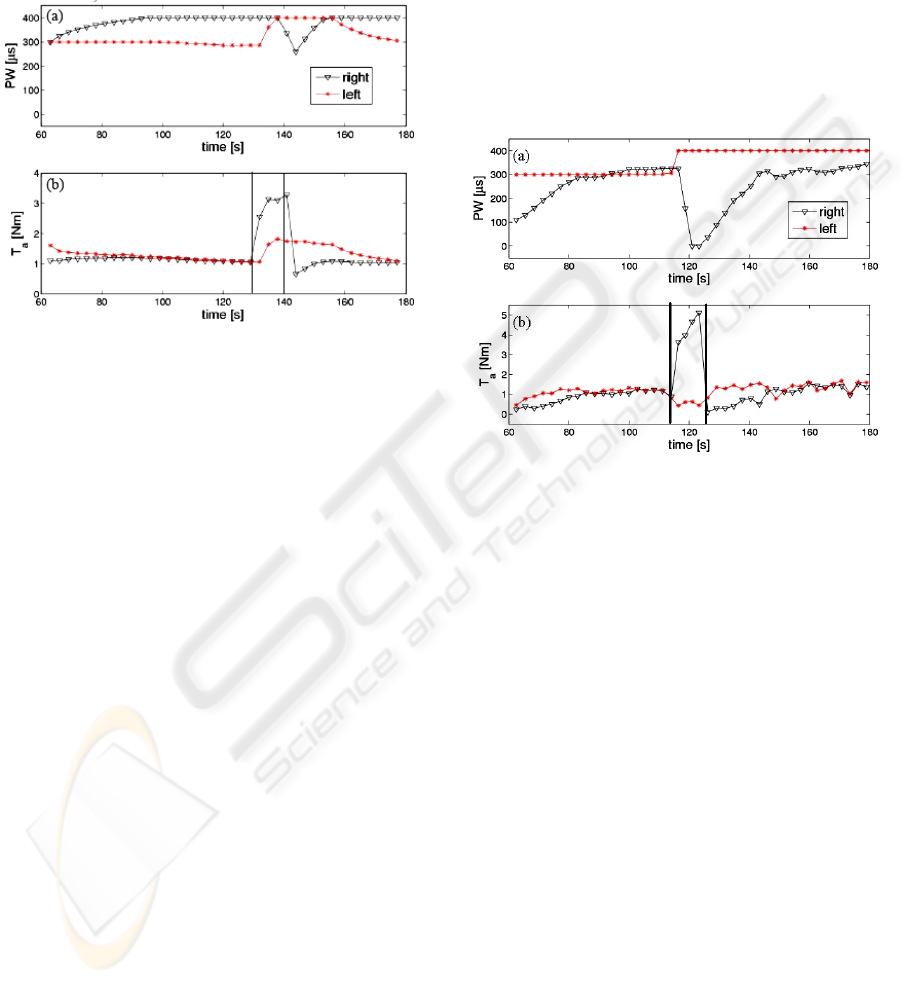
Figure 7 reports the results of a simulation trial
characterised by the protocol described in Section 3.
The initial values of PW
L
and PW
R
were the same
and fixed at 300 µs; the value of K
C
of both the
integral controllers was set at 50 µs/Nm to update
the PW gradually. As shown in panel (b), at the
beginning the value of
,
was lower than the one
of
,
, because the right was the impaired side in
the model. Thus, the PW
R
increased until the
difference between
,
and
,
became zero (at
about 90 s). Between the 90 s and the 130 s, the
controller maintained the symmetry. It is possible to
notice a slow decrease of both the
,/
due to the
occurrence of the muscular fatigue. Then (130 s-
140 s), in order to test the robustness of the
controller, a positive constant value of 4 Nm was
added to the
,
. Accordingly, because the value of
,
became higher than the one of
,
, the
controller tried to nullify the difference, first
P
(
q
-1
)
C
(
q
-
1
)
T
a,R
PW
L
T
a,L
-
e(k)
BIODEVICES 2009 - International Conference on Biomedical Electronics and Devices
248
increasing the PW
L
till the maximum value and then
decreasing the PW
R
. When the disturbance ceased,
the
,
suddenly became lower than the
,
and,
therefore, the PW
R
increased again till the maximum
value and then the PW
L
decreased till the symmetry
was reached, at about 170 s.
Figure 7: Panel (a): values of PW
R
and PW
L
. Panel (b):
values of
,
and
,
. The black lines indicate the period
in which a positive constant value of 4 Nm was added to
the
,
. Only the phase in which the stimulation was on is
reported.
5 EXPERIMENTAL TRIALS
5.1 The Experimental Setup
The experimental setup developed includes an 8-
channel stimulator (Rehastim
TM
, Hasomed GmbH,
Germany) and a motorised cycle-ergometer
(THERA-live
TM
, Medica Medizintechnik GmbH,
Germany) equipped by resistance strain gauge
sensors able to measure the torques at the left and
right crank arm. These signals are transmitted from
the ergometer to a desktop PC via wireless,
providing a measure of the unbalance between the
two legs during cycling. More details on the setup
can be found in (Ferrante, 2008b).
In all the trials, an ON-OFF PW profile was
used. The stimulation currents were set at a value,
tolerated by the subject, which produces a good
muscular contraction. The stimulation frequency
was fixed at 20 Hz and all the signals were sampled
at 200 Hz.
5.2 Results
Figure 8 shows the results of the controller test
carried out on an able-bodied subject. The subject
was a female (24 years old, 166 cm and 52 kg). The
stimulation currents used were 30 mA for all the 4
muscles. The value of K
C
of both the integral
controllers was set at 50 µs/Nm. Moreover, in this
trial, the values of PW were fixed at 300 µs and
100 µs for the left and the right leg, respectively, in
order to induce an unbalance between the two sides
in a healthy subject.
Figure 8 shows that, at the beginning, there was a
slight unbalance which the controller tried to
compensate increasing the PW
R
.
Figure 8: Panel (a): values of PW
R
and PW
L
. Panel (b):
values of
,
and
,
. The black lines indicate the period
in which the subject pedalled voluntary only with the right
leg. Only the phase in which the stimulation was on is
reported.
After 85 s, the controller achieved a symmetrical
movement. This symmetry was maintained till the
subject began to pedal voluntarily only with the right
leg (115 s-125 s) producing a high increment in the
,
(panel (b)). Thus, the controller increased the
PW
L
and then, when the saturation value was
reached, the controller reduced the value of PW
R
(panel (a)). This controller action was not sufficient
to gain symmetry because the subject was pedalling
voluntarily. When the subject stopped to pedal
voluntarily with the right leg,
,
suddenly
decreased to zero, which corresponds to the mean
value during passive cycling. Indeed, the leg was not
stimulated at all. Thus, the PW
R
started to increase
and the symmetry was re-gained in about 25 s and
maintained till the end of the trial.
SIMULATION AND EXPERIMENTAL DESIGN OF A SYMMETRY CONTROLLER FOR FES CYCLING
OPTIMISED ON STROKE PATIENTS
249

6 DISCUSSIONS
AND CONCLUSIONS
The present study deals with the design and the
testing of a novel closed-loop controller for FES
cycling, able to gain and then to maintain the
symmetry of the pedalling in stroke patients. This
controller could be useful in the rehabilitation of
these patients, who need to re-learn symmetrical
tasks in order to recover basic motor functions, such
as walking.
Furthermore, a neuro-muscolo skeletal model to
simulate cycling induced by FES in stroke patients
was developed. This simulator aided in the tuning of
the controller parameters and in the validation of the
controller before testing it experimentally.
Finally, first trials on healthy subjects were
carried out. Starting from a measurement in real-
time of the unbalance between the torques produced
by each leg at the cranks, the controller was able to
reach and then to maintain a symmetrical pedalling,
modifying the stimulation parameters of the two
lower limbs, independently. For example, the initial
unbalance of 0.38 Nm was nullified by the controller
in about 18 s as shown in the results reported in
Figure 8. The results of this trial showed also that
the controller maintained the symmetry of the
pedalling by means of small oscillations of the
values of PW, till an external contribution occurred.
When the subject started to pedal voluntarily only
with the right leg, an unbalance between the two
legs was introduced again and the controller
answered properly, without showing an unstable
behaviour. When the subject ceased to pedal
voluntarily, the unbalance of the pedalling was about
0.73 Nm and the controller re-gained the symmetry
in about 18 s. This trial showed clearly that the
system is not linear; indeed, even if the unbalance
doubles, the time needed to reach symmetry is the
same.
The automatic control system developed shows a
reliable behaviour. Thus, the next step will be the
testing of the controller on stroke patients to
demonstrate if this system could be actually useful
in the rehabilitation of these patients, accelerating
and improving the motor recovery of the lower
limbs.
ACKNOWLEDGEMENTS
This work was supported by the Italian Institute of
Technology (IIT). It was also partly funded through
grant by the German Federal Ministry of Education
and Research (BMBF) within the project
RehaRobES (FKZ 01EZ0766).
REFERENCES
Sheffler, L.R., Chae, J. (2007) ‘Neuromuscular electrical
stimulation in neurorehabilitation’, Muscle & Nerve,
vol. 35, no. 5, pp. 562-590.
Hunt, K.J., Stone, B., Negard, N.O., Schauer, T., Fraser,
M.H., Cathcart, A.J., Ferrario, C., Ward, S.A., Grant,
S. (2004) ‘Control strategies for integration of electric
motor assist and functional electrical stimulation in
paraplegic cycling: utility for exercise testing and
mobile cycling’, IEEE Transactions on Neural and
Rehabilitation Systems Engineering, vol. 12, no. 1, pp.
88-101.
Trumbower, R.D., Faghri, P.D. (2005) ‘Kinematic
analyses of semireclined leg cycling in able-bodied
and spinal cord injured individuals’, Spinal Cord, vol.
43, no. 9, pp. 543-549.
Ferrante,
S., Pedrocchi, A., Ferrigno, G., Molteni, F.
(2008a) ‘Cycling induced by functional electrical
stimulation improves the muscular strength and the
motor controls of individuals with post-acute stroke’,
European Journal of Physical and Rehabilitation
Medicine, vol. 44, no.2, pp. 159-167.
Hunt, K.J., Ferrario, C., Grant, S., Stone, B., Mclean,
A.N., Fraser, M. H., Allan, D.B. (2006) ‘Comparison
of stimulation patterns for FES-cycling using
measures of oxygen cost and stimulation cost’,
Medical Engineering & Physics, vol. 28, no. 7, pp.
710–718.
Ferrante,
S., Comolli, L., Pedrocchi, A., Bocciolone, M.,
Ferrigno, G., Molteni F. (2008b) ‘Optimization of FES
cycling neuroprosthesis on stroke patients by means of
the left and right crank measurement’, Biodevices –
Conference Proceedings, International Conference on
Biomedical Electronics and Devices, Madeira,
Portugal, pp. 206-211.
Riener, R., Fuhr, T. (1998) ‘Patient-driven control of FES-
supported standing up: a simulation study’, IEEE
Transactions on Rehabilitation Engineering, vol. 6,
no. 2, pp. 113-124.
Abbas, J., Chizack, H. (1995) ‘Neural network control of
functional neuromuscular stimulation systems:
Computer simulation studies’, IEEE Transactions on
Biomedical Engineering, vol. 42, no. 11, pp. 1117-
1127.
Ambrosini, E., Schauer, T., Ferrante, S., Pedrocchi, A.,
Ferrigno, G (2008) ‘Neuro-muscolo skeletal model for
cycling induced by functional electrical stimulation in
individuals with stroke’, accepted by 9
th
International
Workshop on Research and Education in
Mechatronics, Bergamo, Italy.
BIODEVICES 2009 - International Conference on Biomedical Electronics and Devices
250
